Pennsylvania’s population in 2025 is estimated to be approximately 13,078,751 reflecting a continuing trend in demographic changes according to World Population Review.
These shifts highlight differing patterns across the state’s rural and urban areas, with urban regions experiencing growth while rural areas face a decline.
This dynamic is reshaping Pennsylvania’s social and economic landscape, offering a rich area of exploration for understanding future impacts.
The growth rate in Pennsylvania over the past decades has varied, with a modest increase between 2010 and 2020.
But from 2020 to 2025 it has declined for over 40.000 residents according to the last US census of 2020.
Key Takeaways
Age of Population
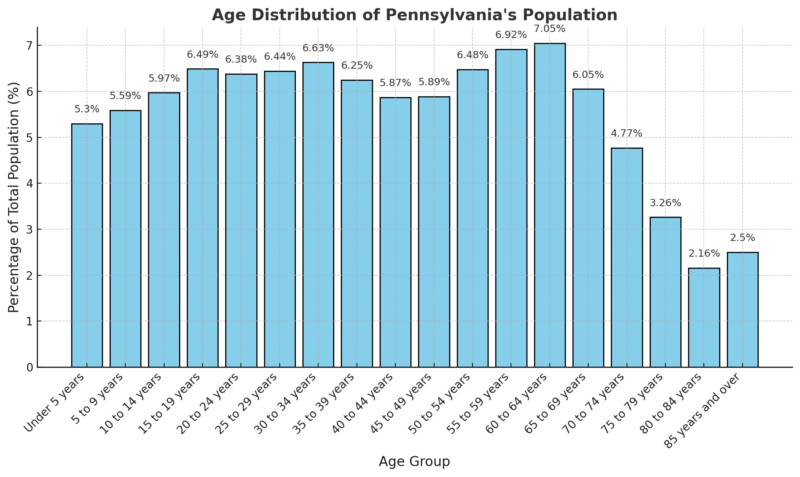
According to the 2018-2022 ACS 5-Year Estimates, Pennsylvania’s median age is 40.8. The age distribution of the population is as follows: 16.86% are under 15, 19.31% are between 15 and 29, 45.09% are aged 30 to 64, 16.24% fall within the 65 to 84 range, and 2.50% are 85 or older.
Age Cohorts
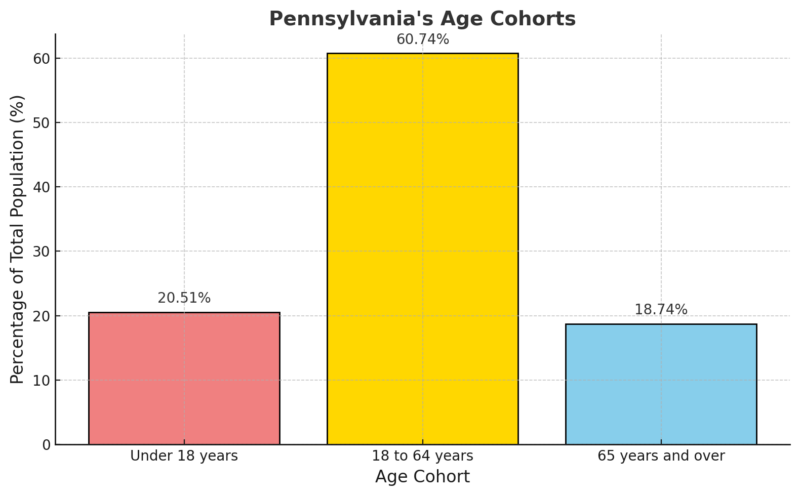
In Pennsylvania, the population distribution across age cohorts shows a predominance of working-age individuals (18 to 64 years), who make up 60.74% of the total population, slightly below the national average of 61.36%.
This indicates a relatively strong labor force presence within the state, but marginally less than the national average.
Youths under 18 years constitute 20.51%, slightly lower than the national average of 22.11%, indicating lower youth dependency than in some other regions.
The senior population (65 and over) makes up 18.74%, notably higher than the national rate of 16.53%, suggesting Pennsylvania has a relatively older population compared to the broader U.S. demographic profile.
Gender and Age
Age Group
Male Population (%)
Female Population (%)
0-4
5.11%
4.88%
5-9
5.37%
5.16%
10-14
5.78%
5.47%
15-19
6.23%
6.00%
20-24
6.10%
5.91%
25-29
6.19%
5.94%
30-34
6.36%
6.14%
35-39
5.94%
5.85%
40-44
5.60%
5.46%
45-49
5.58%
5.53%
50-54
6.11%
6.10%
55-59
6.46%
6.59%
60-64
6.49%
6.81%
65-69
5.48%
5.93%
70-74
4.21%
4.78%
75-79
2.70%
3.45%
80-84
1.66%
2.42%
85+
1.54%
3.12%
The Pennsylvania population pyramid reflects a relatively balanced gender distribution in younger and middle-aged groups, with close percentages of men and women up to age 64.
However, in the 65+ age groups, there is a marked increase in the female population percentage compared to males, especially in the 75+ categories.
This suggests a higher life expectancy among women, a trend that aligns with broader U.S. demographic patterns.
Ethnic and Racial Composition
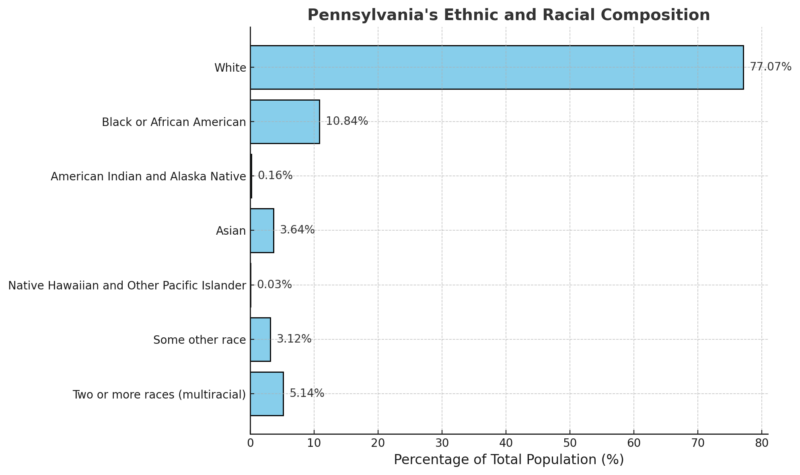
Racial composition highlights a predominance of White residents, who make up 77.07% of the total population according to Neilsberg.
This substantial majority reflects historical and demographic trends in the state.
The second-largest racial group is Black or African American, accounting for 10.84%, followed by multiracial individuals, who represent 5.14% of the population.
These groups, along with a smaller proportion of Asian residents at 3.64%, showcase Pennsylvania’s diversity but indicate a more modest level of racial diversity compared to some other states.
Education
Educational Attainment for Population Aged 25 and Older in Pennsylvania
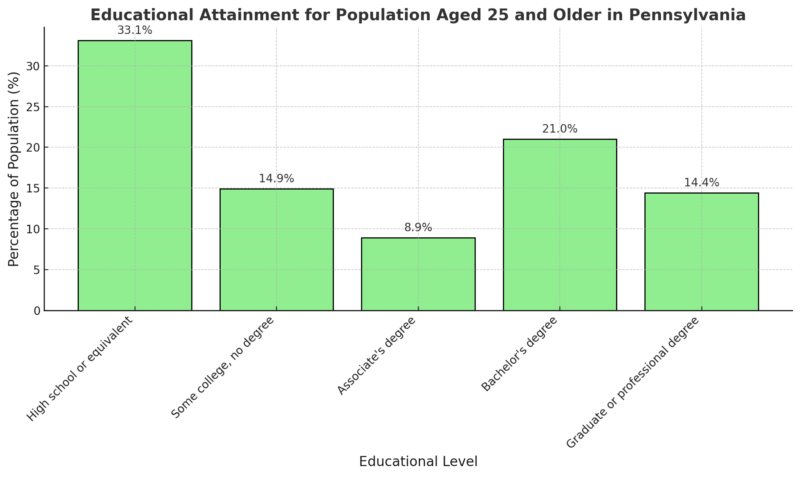
A substantial portion of Pennsylvania’s adult population has attained at least a high school diploma, with 35.4% holding a bachelor’s or higher.
This is slightly below the national level, which stands at 36.2%, highlighting room for growth in higher educational attainment within the state according to US census data.
Bachelor’s Degree or Higher – Comparative Estimates (2023 ACS)
Location
Percentage with Bachelor’s Degree or Higher
Margin of Error
Pennsylvania
35.3%
±0.3%
United States
36.2%
±0.1%
Pennsylvania’s rate of bachelor’s degree attainment is closely aligned with the national average, though slightly lower.
This small gap could influence the state’s economic opportunities, as regions with higher education levels often attract more businesses and offer higher wages.
School Enrollment in Pennsylvania (Population Aged 3 and Over)
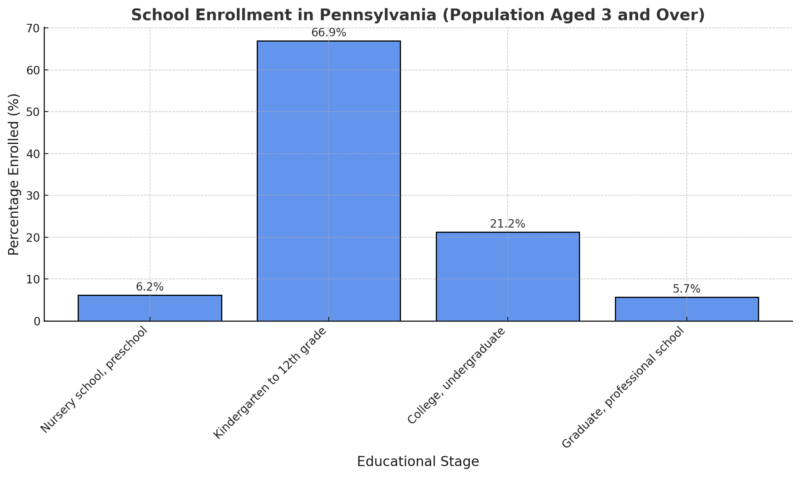
The majority of enrolled students in Pennsylvania are in K-12 education (66.9%), consistent with the national enrollment of 67.8%.
College and graduate enrollments reflect a diverse range of educational pursuits, though they may benefit from increased support to further strengthen workforce readiness.
Kindergarten to 12th Grade Enrollment – Comparative Estimates (2023 ACS)
Location
Percentage of Population Enrolled in K-12
Margin of Error
Pennsylvania
66.9%
±0.4%
United States
67.8%
±0.1%
Pennsylvania’s K-12 enrollment is nearly identical to the national rate, suggesting strong school participation among children.
However, the slight margin indicates Pennsylvania could further align its educational initiatives to maximize student engagement and retention rates across all educational levels.
Employment Statistics
Month
Civilian Labor Force (in thousands)
Employment (in thousands)
Unemployment (in thousands)
Unemployment Rate (%)
July 2024
6,602.5
6,378.5
224.0
3.4%
August 2024
6,580.4
6,357.5
223.0
3.4%
September 2024
6,555.9
6,334.1
221.8
3.4%
October 2024
6,531.4
6,308.0
223.4
3.4%
November 2024
6,507.4
6,279.9
227.5
3.5%
December 2024 (Preliminary)
6,490.3
6,256.9
233.3
3.6%
The civilian labor force declined steadily from 6,602.5K in July to 6,490.3K in December.
This loss of 112.2K workers over six months could indicate a reduction in labor force participation, possibly due to retirements, migration, or discouraged workers exiting the job market.
Employment numbers fell from 6,378.5K in July to 6,256.9K in December, a decline of 121.6K jobs according to BLS.
The drop in employment suggests job losses across industries, which may be a response to economic downturns, seasonal employment shifts, or layoffs.
While the number of unemployed individuals fluctuated slightly from 224.0K in July to 223.4K in October, it rose to 233.3K in December.
This increase in unemployed individuals despite a shrinking labor force could be a warning sign of job market weakening.
The unemployment rate remained steady at 3.4% from July to October, then rose to 3.5% in November and 3.6% in December.
A rising unemployment rate, combined with a declining labor force, suggests that job losses are outpacing the number of people entering the workforce.
Income Levels
Household Income
Statistic
Pennsylvania
United States
Difference
Average Household Income
$104,925
$110,491
1% lower
Median Household Income
$76,081
$78,538
1% lower
Poverty Threshold
$30,000
$30,000
Equal
- Pennsylvania’s average household income is slightly below the national average, indicating that while incomes are competitive, they still lag behind the U.S. overall.
- The median household income in Pennsylvania is 1% higher than the U.S. median, reflecting a relatively balanced income distribution across the state.
- The poverty threshold aligns with the national standard, reinforcing the cost-of-living consistency across Pennsylvania.
Richest Pennsylvania Zip Codes
Rank
Zip Code
Population
Mean Income
Median Household Income
1
19035
3,779
$479,917
$250,001+
2
19085
10,679
$469,409
$250,001+
3
19066
5,893
$329,168
$243,500
4
19025
7,417
$280,475
$183,586
5
19072
10,352
$276,313
$175,833
6
18925
6,650
$270,843
$207,926
7
19096
15,136
$270,198
$186,648
8
19312
11,901
$256,987
$199,107
9
19041
6,088
$255,426
$147,531
10
19425
17,071
$248,221
$210,227
The wealthiest zip codes in Pennsylvania display significant income levels, with the top two areas reporting average household incomes over $450,000 according to Incomebyzipcode.
These high incomes suggest concentrated wealth within specific areas, which could affect local economic policies and community resources.
Pennsylvania Salary Data
| Category | Salary (USD) |
|---|---|
| Average Salary (Full-Time Workers) | $81,697 |
| Median Salary (Full-Time Workers) | $60,943 |
- The average salary for full-time workers in Pennsylvania is $81,697, reflecting the state’s overall earning potential.
- The median salary of $60,943 is significantly lower than the average, indicating that higher-income earners are skewing the average salary upward.
- Salary figures include wages and self-employed earnings, making them a comprehensive measure of income.
Pennsylvania Individual Incomes
| Category | Income (USD) |
|---|---|
| Median Income (Single-Person Households) | $38,359 |
| Average Per Capita Income | $43,104 |
Single-person households in Pennsylvania have a median income of $38,359, suggesting modest earnings for individuals living alone.
The average per capita income of $43,104 accounts for all residents, including non-working individuals, which results in a lower figure than other household-level income statistics.
Pennsylvania Family Income
| Category | Income (USD) |
|---|---|
| Average Family Income | $126,984 |
| Median Family Income | $97,349 |
Analysis:
- The average family income of $126,984 suggests strong earning potential for multi-earner households.
- The median family income of $97,349 is a more accurate representation of a typical Pennsylvania family’s earnings, as it is less influenced by extreme high-income earners.
Pennsylvania Retirement Income
| Category | Income (USD) |
|---|---|
| Total Average Retirement Income | $52,802 |
| Average Income from Retirement Plans (401k, Pensions, etc.) | $28,813 |
| Average Social Security Income | $23,989 |
The total average retirement income in Pennsylvania is $52,802, which consists of both private retirement savings ($28,813) and Social Security benefits ($23,989).
Many retirees rely heavily on Social Security, which may not be enough to sustain a high standard of living without additional savings.
Pennsylvania Household Income Distribution
| Income Bracket | Number of Households | Percentage of Total Households |
|---|---|---|
| Less than $10,000 | 250,575 | 5% |
| $10,000 to $14,999 | 192,652 | 4% |
| $15,000 to $19,999 | 174,192 | 3% |
| $20,000 to $24,999 | 190,699 | 4% |
| $25,000 to $29,999 | 184,663 | 4% |
| $30,000 to $34,999 | 189,613 | 4% |
| $35,000 to $39,999 | 188,011 | 4% |
| $40,000 to $44,999 | 187,968 | 4% |
| $45,000 to $49,999 | 184,855 | 4% |
| $50,000 to $59,999 | 350,808 | 7% |
| $60,000 to $74,999 | 490,569 | 9% |
| $75,000 to $99,999 | 675,902 | 13% |
| $100,000 to $124,999 | 535,540 | 10% |
| $125,000 to $149,999 | 384,588 | 7% |
| $150,000 to $199,999 | 472,270 | 9% |
| $200,000 or more | 582,434 | 11% |
The majority of households (around 48%) earn between $50,000 and $149,999, representing the middle-income population.
11% of households earn over $200,000, indicating a significant high-income segment in Pennsylvania.
A substantial 5% of households earn below $10,000, which suggests an income disparity that could impact economic policies.
Pennsylvania Median Household Income by Age Group (
| Age Group | Median Household Income (USD) |
|---|---|
| Under 25 years | $42,188 |
| 25 to 44 years | $87,985 |
| 45 to 64 years | $93,356 |
| 65 years and over | $53,582 |
- Younger households (under 25 years) have the lowest median income of $42,188, reflecting early-career wages.
- The highest-earning group is households aged 45-64 ($93,356), aligning with peak career years.
- Income declines for those 65 and older ($53,582), emphasizing the role of retirement income and Social Security in senior financial stability.
Housing and Living Arrangements
Metric
Value
Year-over-Year Growth
Median Sale Price
$288,600
+6.8%
Number of Homes Sold
10,353
+6.6%
Median Days on Market
38 days
+3 days
The Pennsylvania housing market is experiencing significant growth, with median sale prices up by nearly 9% year-over-year.
The number of homes sold has also increased, though properties are remaining on the market slightly longer than last year according to data from Redfin.
Migration Patterns and Effects
Metric
Value
Immigrant Share of Population
7.7%
Total Immigrant Residents
995,800
Immigrant Spending Power
$34.2 billion
Total Taxes Paid by Immigrants
$13.1 billion
Data Year
2022
Immigrants constitute a significant part of Pennsylvania’s population and economy, contributing to both state revenue through taxes and community spending according to American Immigration Council.
Their economic influence highlights their vital role in supporting state and local services.
Demographics of Pennsylvania’s Immigrant Population
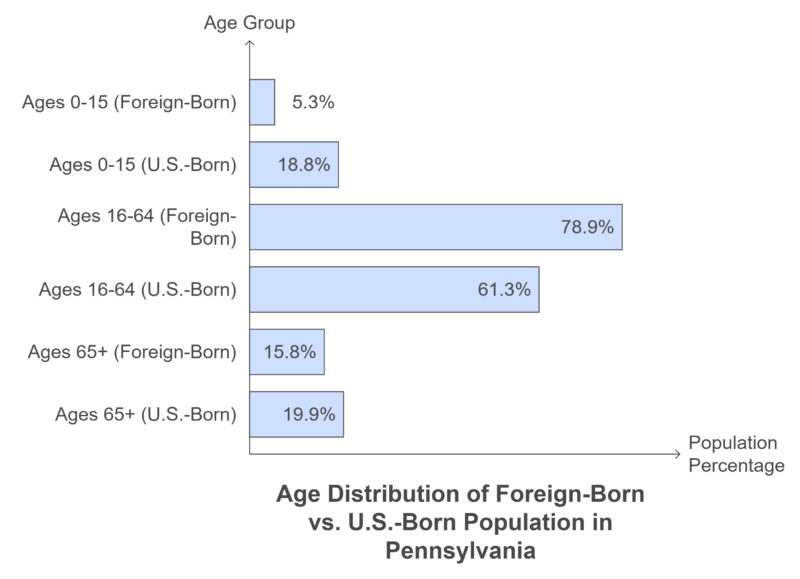
Immigrants in Pennsylvania are primarily working-age adults, with a high percentage being proficient in English.
This demographic structure supports the state’s labor force and contributes to family-based household income.
Metric
Value
U.S.-Born Residents with Immigrant Parent(s)
3.6%
Immigrant Women
51.3%
Immigrant Men
48.7%
Number of Immigrant Children
62,800
U.S.-Born Residents with Immigrant Parent(s)
428,300
Foreign-born proficient in English
78.3%
Top Countries of Origin for Immigrants in Pennsylvania
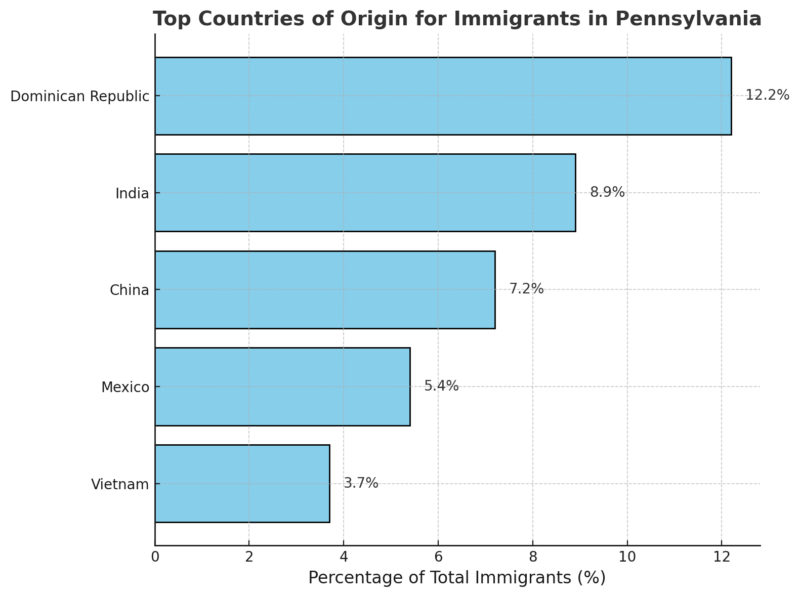
The immigrant population in Pennsylvania is diverse, with the largest groups originating from the Dominican Republic, India, and China.
This multicultural makeup enriches the state’s cultural and economic landscape.
Immigrant Contributions to Entrepreneurship
Metric
Value
Immigrant Share of Entrepreneurs
13.4%
Number of Immigrant Entrepreneurs
70,200
Business Income from Immigrant Entrepreneurs
$2.0 billion
Immigrant entrepreneurship is a substantial force in Pennsylvania, with 13.4% of entrepreneurs being foreign-born.
These business owners generate considerable income, creating jobs and contributing to the state’s economy.
Taxes and Spending Power of Immigrants in Pennsylvania
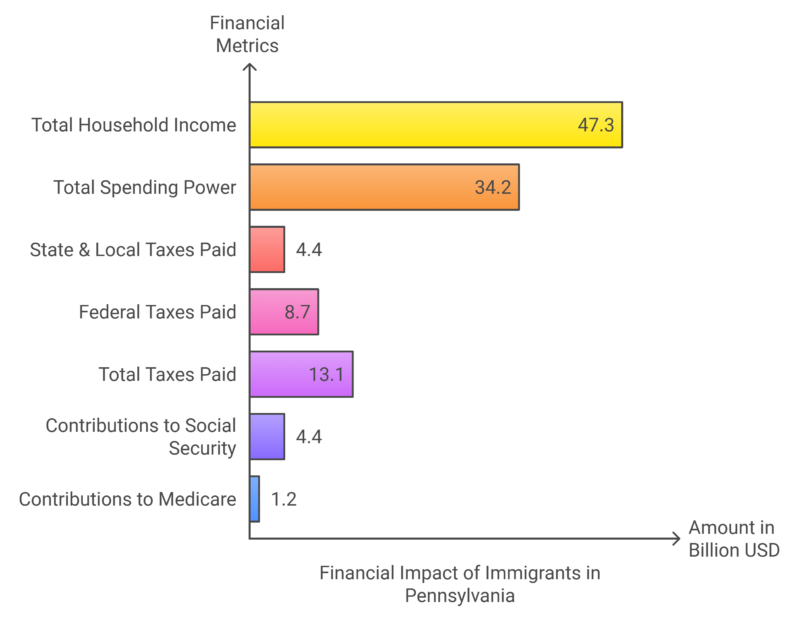
Immigrant households in Pennsylvania contribute significantly to both state and federal tax revenue.
With a combined tax contribution of $13.1 billion, these households have a notable impact on public services, including Social Security and Medicare.
Methodology
To craft this article, we first gathered data from various reliable sources, including the U.S. Census Bureau, American Community Survey, to provide a comprehensive overview of Pennsylvania’s demographics, economy, and environment.
We structured the data in organized sections covering population, income, education, housing, labor, and immigrant impact to highlight key social and economic dynamics.
Analytical summaries and comparisons were created for clarity, focusing on trends and notable shifts in each category.
We synthesized the most relevant data points and metrics to ensure an insightful, concise analysis of Pennsylvania’s demographic and economic profile.
Finally, emphasis was placed on current and future implications for the state’s growth, economy, and environmental objectives.
References
- World Population Review – Pennsylvania Population 2025
- NCH Stats – US Population Map
- US Census Bureau – Pennsylvania Profile
- Neilsberg – Pennsylvania Population by Age
- American Community Survey (ACS) – Educational Attainment for Pennsylvania
- US Census Bureau – Median Household Income in Pennsylvania
- Income by Zip Code – Richest Zip Codes in Pennsylvania
- American Immigration Council – Pennsylvania Immigration Contributions
- Redfin – Pennsylvania Housing Market