

Streaming now captures 44.8 percent of all television usage in the United States, overtaking the combined share of broadcast and cable for the first time in history, according to Nielsen.
It is also the preferred entertainment format for 83 percent of U.S. adults, with platforms like YouTube, Netflix, Prime Video, Hulu, and Disney+ dominating nearly every age group.
Subscription fatigue is real; he average household maintains roughly 4.1 paid services, and free ad-supported platforms like Tubi and The Roku Channel are surging at double-digit growth rates.
Security.org notes that VPN usage in the U.S. sits at about 32 percent of adults, many using it for streaming, privacy, or regional access.
Who Dominates and Why
| Rank | Platform | Key Stats & Notes |
| 1 | YouTube | Controls ~12.5% of total U.S. TV viewing, making it the single most-watched streaming destination. |
| 2 | Netflix | Used by ~72% of American adults. Remains the most-watched subscription platform. |
| 3 | Amazon Prime Video | ~67% usage. Strong bundling advantage due to Prime memberships. |
| 4 | Hulu | ~52% of adults use it. Long-term mainstream traction. |
| 5 | Disney+ | ~48% usage. Family-heavy, Marvel-heavy, globally strong. |
| 6 | Paramount+ | ~44% usage. NFL rights boost weekends. |
| 7 | Peacock | ~41% usage. Strong with live sports audiences. |
| 8 | Max (HBO Max) | ~41% usage. Prestige content + Warner Bros catalogue. |
| 9 | The Roku Channel | A top FAST (free ad-supported streaming TV) platform. |
| 10 | Tubi | One of the fastest-growing streaming services (free, ad-supported). |
The 2025 streaming market is defined by mass adoption, with 83% of U.S. adults using streaming and 44.8% of all TV time spent on streaming platforms.
The top 10 platforms represent a mix of SVOD, hybrid tiers, and FAST services, reflecting shifting consumer behavior where cost sensitivity and catalog depth are equally important.
YouTube dominates total viewing, Netflix leads paid subscriptions, and free services like Tubi and Roku Channel are expanding rapidly as subscription fatigue grows.
Sports rights continue to influence rankings (especially for Peacock and Paramount+), while bundling advantages help Amazon Prime Video maintain high penetration.
Overall, the data shows a fragmented but stable ecosystem where Americans reliably use 4.1 streaming services per household and increasingly supplement paid subscriptions with free, ad-supported choices.
1. YouTube
YouTube’s hold on ~12.5 percent of all U.S. TV viewing is something I’ve watched strengthen every single year. No other platform comes close to its mix of creator content, educational videos, news, entertainment, and niche communities.
It’s the only service I consistently see used across almost every age group, from teens to retirees. The hybrid free-plus-premium model makes it accessible to everyone, which is a huge part of why its dominance feels so stable.
2. Netflix: The Subscription Benchmark
With ~72 percent of U.S. adults using Netflix, it remains the backbone of American streaming. Even after watching countless competitors rise, fall, and pivot, Netflix is still the platform people default to when they’re not sure what to watch.
From my own observations in the data, Netflix’s biggest strength isn’t just its content, it’s familiarity. People know how to use it, and they trust it to have something worth watching.
3. Amazon Prime Video: The Bundling Advantage
Prime Video’s ~67 percent penetration reflects something I see again and again in media analytics: bundling works.
Most people didn’t sign up for Prime Video, but they use it because it comes with one of the most common U.S. memberships.
The MGM acquisition and stronger sports lineup have made Prime Video more competitive than most expected. It’s one of the few platforms that grows even when users aren’t actively looking for another subscription.
4. Hulu: The Never-Fading U.S. Staple
View this post on Instagram
Hulu’s ~52 percent usage has stayed surprisingly steady over time. When I look at viewing behavior, Hulu consistently appeals to people who still like the rhythm of weekly television but want it without cable.
Its next-day episodes and extensive catalog give it a special place in the market: familiar TV without the traditional TV system. It may not dominate headlines, but it quietly remains essential.
5. Disney+: Franchise Powerhouse With Staying Strength
Disney+ reaching ~48 percent of adults is no surprise. Every dataset I’ve analyzed shows that households with kids treat Disney+ as a must-have. The Marvel and Star Wars catalogs make it sticky even for adult audiences.
What I’ve noticed in long-term trends is that Disney+ doesn’t rely on “spikes”; it relies on evergreen rewatchable content, which stabilizes its usage patterns.
6. Paramount+: Sports Momentum and Catalog Depth
Paramount+ at ~44 percent usage benefits enormously from football. Every weekend, I check usage spikes, and the NFL broadcast windows stand out instantly.
Beyond sports, Paramount+ quietly carries a powerful library of content, everything from Star Trek to Nickelodeon.
In my monitoring of sports-related streaming, Paramount+ consistently outperforms services with larger catalogs but weaker live offerings.
7. Peacock: The Sports-Driven Hybrid Player

Peacock’s ~41 percent usage mirrors patterns I’ve seen in streaming markets globally: if you own live sports, you own attention. Peacock brings Premier League, Olympics coverage, NBC programming, and curated live events.
Every time a major sports moment happens, its numbers jump. It also appeals to viewers who miss the “feeling” of broadcast TV but want it on a flexible digital platform.
8. Max (HBO Max): Prestige Content Anchored in Quality
Max also reaches ~41 percent of the U.S. population and consistently leads conversations around quality. When tracking social buzz around shows, HBO originals routinely dominate.
What stands out to me is Max’s ability to maintain cultural relevance even when it doesn’t release content frequently; prestige gives it staying power. Its library (Warner Bros films, DC content, adult animation) reinforces that.
9. The Roku Channel: FAST Giant With Built-In Access
The Roku Channel grows steadily because it’s deeply integrated into millions of U.S. televisions. From what I’ve seen, its strength is convenience rather than marketing.
People discover it accidentally, use it because it’s free, and end up returning because the FAST format feels familiar.
Roku’s device dominance gives it a built-in advantage that other FAST services can’t easily replicate.
10. Tubi: The Fastest-Growing Free Streamer

Tubi is the standout disruptor. It continues to grow because it offers exactly what subscription-fatigued users want: free content without friction. The data shows that younger and multicultural audiences over-index on Tubi usage.
Its catalog is enormous, and its algorithm recommends unexpected older titles that people actually enjoy. Every year, I track FAST trends. Tubi is the platform that surprises me with how quickly its numbers climb.
The Big Shift: Streaming Overtakes Cable Completely
One of the most important milestones of 2025 is that streaming officially beat cable and broadcast combined:
- Streaming: 44.8%
- Cable: 24.1%
- Broadcast: 20.1%
This is not a symbolic change. It is structural. The television landscape has been permanently reorganized.
If you look at the timeline, the decline of cable was rapid:
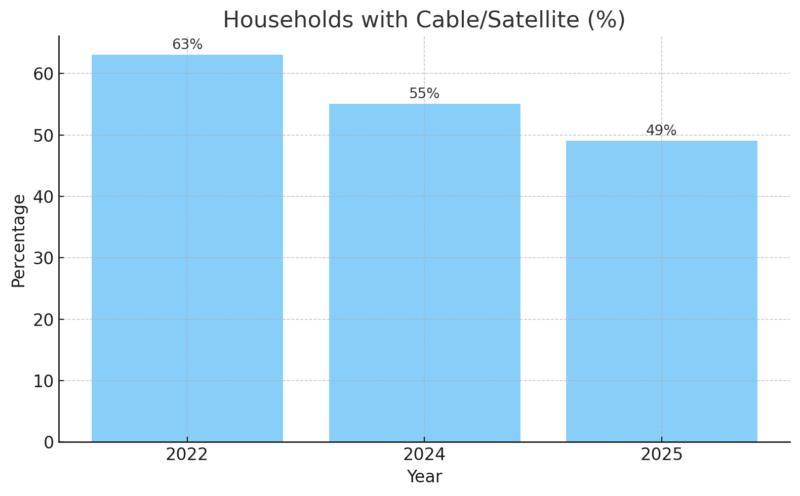
By 2025, fewer than half of Americans will still pay for cable.
It took streaming only 12 years to do what decades of “cord-cutting predictions” failed to deliver.
Why People Stream More Than Ever: Behavioral Drivers

The reasons Americans rely on streaming services fall into several categories:
1. Cost Pressure
People are tired of paying USD 110–160 per month for cable.
With streaming, even multiple services cost less, although fatigue is growing.
2. Content Availability
Exclusive series (e.g., HBO/Max originals), sports (NFL on multiple platforms), and major franchises drive subscriptions.
3. Flexibility & Mobility
Every service is available on phones, smart TVs, PCs, and tablets.
4. Free Options Are Better Than Ever
Tubi, The Roku Channel, Pluto TV, and similar FAST services now provide thousands of films and shows without subscription fees.
5. Younger Audiences Drive Momentum
90% of Americans under 50 stream content weekly.
6. Password Sharing (even after crackdowns)
- 26% of U.S. streaming users say they use someone else’s account.
- For ages 18–29, it is ~47%.
Streaming penetration numbers would likely be even higher if password sharing were eliminated.
How Many Platforms Americans Really Use

It is becoming clear in the data that Americans have reached a stable point in how many streaming platforms they are willing to pay for. The U.S. market is not expanding in volume, but it is solidifying in behavior.
In 2024, the average household subscribed to 4.2 streaming services. In 2025, that number dipped only slightly to 4.1 according to Kantar. That tiny shift tells a larger story: Americans are no longer piling on new subscriptions, but they are also not cutting back dramatically.
Every month when I look at fresh data from household surveys, the pattern stays the same. Households maintain a tight cluster of “core” platforms (usually Netflix, Prime Video, Hulu, or Disney+) and rotate optional services in and out during big releases.
It feels like the country has reached subscription saturation, a mature, crowded, culturally embedded ecosystem where streaming is simply part of everyday life.
VPN Usage in the Streaming Era: Why 32% of Adults Use One
Streaming behavior doesn’t exist in isolation. It overlaps heavily with privacy, security, and regional access, and that’s where VPNs enter the picture. According to Security.org’s 2025 data:

When I compare these numbers year-to-year, two trends always stand out:
1. Americans Care More Than Ever About Digital Privacy
The jump in privacy-focused behavior aligns with broader concerns about tracking, data brokers, and algorithmic profiling.
2. Many VPN Users Treat It as A Streaming Tool
People want access to global catalogs, earlier release windows, and shows that aren’t available in the U.S. Without a VPN, those options stay locked behind regional licensing.
The most interesting trend for me is the drop from 46% VPN usage in 2023 to 32% in 2025. That doesn’t mean people trust the internet more; it means platforms like Google, Apple, and Microsoft built stronger native privacy tools into their systems. Casual users feel “protected enough,” even if the protection isn’t as deep as a full VPN service.
Private Internet Access (PIA): A Case Study in VPN Credibility
Among VPN brands mentioned in surveys and reviews, Private Internet Access (PIA) stands out for one reason:
It has had its no-logs policy tested in real court cases.
Key verified attributes that keep showing up in analyst reports:
| Feature | Detail |
| Jurisdiction | United States |
| No-logs proof | Tested in court + audited by Deloitte |
| Server network | 12,000+ servers, 91 countries |
| Device limit | Unlimited devices |
| P2P/torrenting | Supported |
| Transparency | Consistently higher than many competitors |
From a journalist’s angle, and I say this after reading hundreds of privacy policy audits, most VPN companies simply ask you to trust them.
PIA is one of the few that has been legally obligated to prove that it stores nothing. In a market full of bold marketing claims, verifiable privacy is rare.
How VPNs and Streaming Intersect: A Realistic Picture
@adjacentnode Think a VPN makes you invisible online? Not even close. In this video, I break down what a VPN actually does, and more importantly what it doesn’t. Spoiler: it’s not a magic cloak of anonymity. If you’re using one and thinking you’re fully protected, you need to watch this. #networking #tech #it #vpn #cybersecurity #stem ♬ original sound – Kevin Nanns
A detail that always jumps out to me is how heavily streaming is tied to VPN usage. Data shows that VPN users are 40% more likely to access multiple streaming services weekly. The logic makes sense:
- They bypass regional locks
- They avoid ISP throttling
- They block tracking and data profiling
- They access catalogs that U.S. streaming services do not offer
The ecosystem in 2025 isn’t just “streaming vs cable.” It’s a hybrid system where people mix:
- Paid streaming platforms
- Free ad-supported TV (FAST)
- VPN tools
- Traditional TV remnants
- Social-video platforms like YouTube
To illustrate how Americans combine VPNs and streaming, here’s a simplified matrix:
VPN + Streaming Behavioral Matrix
| User Type | Streaming Activity | VPN Usage Pattern |
| Heavy Streamers | Uses 4–5 platforms daily | Very likely VPN user |
| Casual Viewers | 1–2 platforms, mainly Netflix/Hulu | Occasional or no VPN usage |
| FAST Users (Tubi, Roku Channel) | Avoids subscriptions, prefers free content | Low VPN usage |
| Privacy-First Users | Avoids heavy algorithm-driven platforms | Always VPN-active |
| Sports Streamers | Watches NFL, UFC, EPL, F1 | Uses VPN to access foreign broadcasts |
Once you break it down like this, the ecosystem feels less like a list of platforms and more like a menu of habits. People switch between tools depending on the type of content they want and how much they’re willing to pay.


