
The uninsured rate in the United States has been a central metric of public health policy since the passage of the Affordable Care Act (ACA) in 2010. From a peak of over 46 million uninsured people in 2010, the number dropped dramatically through the early 2010s, reaching historic lows by 2023, according to KFF.
These gains have been driven by multiple factors, including Medicaid expansion, the creation of ACA Marketplaces, pandemic-era protections, and extended federal subsidies.
However, progress has not been linear. Shifts in federal and state policy, the COVID-19 pandemic, and ongoing affordability challenges have shaped year-to-year fluctuations.
As of 2023, despite the end of the Medicaid continuous enrollment policy, the uninsured population among people ages 0–64 remained at 25.3 million, a 1.4 percentage point drop in the uninsured rate compared to 2019.
Rate For Ages 0–64
Year
Number Uninsured (millions)
Uninsured Rate (%)
Major Policy/Event
2010
46.5
~17.8%
ACA signed into law; high pre-ACA baseline
2012
44.8
~17.2%
Medicaid expansion begins in some states
2014
35.9
13.3%
ACA Marketplaces launch; major Medicaid expansions
2016
27.4
10.0%
Continued Marketplace stabilization
2018
28.9
10.7%
Slight uptick; ACA individual mandate penalty weakened
2019
27.9
10.9%
Pre-pandemic baseline
2021
26.7
10.2%
ARPA boosts subsidies; Medicaid continuous enrollment in effect
2022
25.6
9.6%
Coverage gains peak under pandemic policies
2023
25.3
9.5%
Medicaid disenrollments begin; enhanced subsidies continue
Trend 1: Historic Highs in 2010 Before the ACA Took Effect
In 2010, before the Affordable Care Act’s major reforms took effect, the U.S. faced one of the highest uninsured rates in its modern history. Roughly 46.5 million Americans under the age of 65—about 17.8% of this population—lacked health insurance as per NCBI.
The aftermath of the Great Recession left millions without employer-sponsored insurance, which at the time was the dominant source of coverage.
For many families, purchasing insurance directly from the individual market was either unaffordable or impossible due to pre-existing conditions or restrictive underwriting practices. Medicaid eligibility was limited to specific categories of low-income individuals, often excluding childless adults entirely.
Although the ACA was signed into law in March 2010, its most important coverage expansions, including the establishment of Marketplaces and Medicaid expansion, would not begin until 2014. Thus, 2010 represents the high-water mark of uninsurance in the U.S. and provides a critical benchmark for measuring the law’s long-term impact.
Uninsured Status in 2010
Metric
Value
Year
2010
Uninsured (ages 0–64)
46.5 million
Uninsured Rate
17.8%
Major Event
ACA was signed into law
Key Factors
High pre-ACA baseline, recession-driven job loss, no coverage mandate, or Marketplaces
The high baseline made 2010 a critical reference year in measuring ACA success.
Trend 2: Rapid Coverage Gains After ACA Implementation (2014–2016)
View this post on Instagram
CBP notes that by 2014, ACA Marketplaces and Medicaid expansion (in participating states) launched, bringing subsidized coverage options to millions.
The impact was immediate. From 2014 to 2016, the uninsured rate plummeted to 10.0%, with 27.4 million people uninsured by 2016.
ACA Early Implementation Era
Year
Uninsured (millions)
Uninsured Rate
Key Policy Milestone
2014
35.9
13.3%
ACA Marketplaces and Medicaid expansion begin
2016
27.4
10.0%
Marketplace stabilization
Coverage gains were largest among:
The ACA fundamentally shifted how millions accessed health insurance.
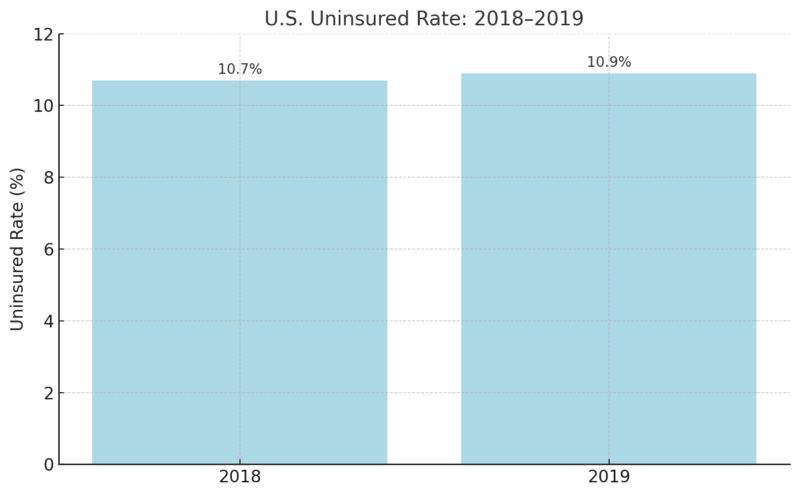
Trend 3: Plateau and Slight Reversal During 2017–2019
Following political changes in Washington, support for the ACA weakened. The individual mandate penalty was effectively eliminated, outreach funding was slashed, and enrollment periods were shortened.
These efforts led to a modest backslide. The uninsured rate rose from 10.0% in 2016 to 10.9% in 2019
ACA Weakening Phase
Disproportionate impacts were seen in non-expansion states and among children, whose uninsured rates rose for the first time in years.
Trend 4: Pandemic Protections Temporarily Boost Coverage (2020–2022)
During the #COVID19 pandemic, large numbers of people have lost their job, but many more have also had their hours cut. Today’s jobs crisis is far worse than the immediate impact of the 2008 financial crisis.
Learn more 👉 https://t.co/q5BkunJSbb #EmploymentOutlook pic.twitter.com/bUd6ddQVey
— OECD Social (@OECD_Social) July 7, 2020
While the COVID-19 pandemic caused historic job losses, it also triggered temporary policy measures that expanded coverage. The Medicaid continuous enrollment provision and enhanced Marketplace subsidies (via ARPA) played key roles.
- ACS did not release 2020 data, but estimates show gains began in 2020
- In 2021: 26.7 million uninsured, 10.2% rate
- In 2022: 25.6 million uninsured, 9.6% rate (lowest ever recorded)
Pandemic Coverage Expansion
Year
Uninsured (millions)
Uninsured Rate
Key Policies
2021
26.7
10.2%
ARPA subsidies + Medicaid freeze on disenrollments
2022
25.6
9.6%
Full effect of ARPA + record Marketplace enrollments
Despite the pandemic’s chaos, public programs served as a strong coverage safety net.
Trend 5: Disenrollment Begins But Coverage Holds in 2023

April 2023 marked a turning point as states resumed Medicaid eligibility redeterminations, ending the continuous enrollment provision that had shielded enrollees from coverage loss during the pandemic.
Despite this shift, the number of uninsured people in 2023 remained relatively stable at 25.3 million, with a rate of 9.5%, only a slight change from 2022. This surprising stability was largely due to the continued availability of enhanced Marketplace subsidies, which remained in place under the Inflation Reduction Act and extended through 2025.
These subsidies made ACA plans more affordable and attractive to those leaving Medicaid.
However, the slight uptick in uninsured children, from 3.8 million in 2022 to 4.0 million in 20, 3 served as a warning sign that the unwinding process could lead to vulnerable groups falling through the cracks.
Although 2023 did not see a dramatic reversal in coverage gains, it raised red flags about what may happen if temporary policies are not replaced with permanent protections.
- 2023 uninsured rate: 9.5%
- Number of uninsured: 25.3 million
- The child uninsured rate rose slightly from 5.1% to 5.3%
Post-Pandemic Coverage Stability
Year
Uninsured (millions)
Uninsured Rate
Key Factors
2023
25.3
9.5%
Medicaid disenrollment starts, subsidies continue
This year marked a potential inflection point: without further policy action, coverage may begin to erode in future years.
Trend 6: Medicaid Expansion Still Matters

State-level Medicaid expansion remains one of the most powerful levers for reducing uninsurance. In 2023:
- Expansion states had a 7.6% uninsured rate
- Non-expansion states had a 14.1% uninsured rate
- Two new states (South Dakota, North Carolina) adopted expansion in 2023
Coverage by Expansion Status (2023)
State Type
Uninsured Rate
Key Notes
Expansion State
7.6%
41 states + DC as of Dec 2024
Non-Expansion
14.1%
10 states, mostly Southern
Non-expansion states hold a disproportionate share of the uninsured population, especially low-income adults.
Trend 7: Racial and Ethnic Disparities Persist
Despite improvements across all demographic groups, deep disparities in health insurance coverage by race and ethnicity continue.
In 2023, Hispanic individuals had an uninsured rate of 17.9%, and American Indian and Alaska Native (AIAN) individuals faced a rate of 18.7%. In contrast, the rate for White individuals was just 6.5%, and for Asian individuals, it was 5.8%.
These gaps reflect systemic issues beyond income, including disparities in employment benefits, immigration-related eligibility restrictions, and geographic clustering in non-expansion states. For instance, many uninsured Hispanic adults are noncitizens who are either excluded from Medicaid entirely or face a five-year waiting period for eligibility.
Although ACA subsidies are available to many lawfully present immigrants, barriers such as language access, digital literacy, and fear of public charge determinations persist.
The uneven progress among racial and ethnic groups shows that broader structural reforms, including immigrant inclusion and outreach investments, are necessary to ensure equitable health coverage.
Uninsured Rate by Race/Ethnicity (2023)
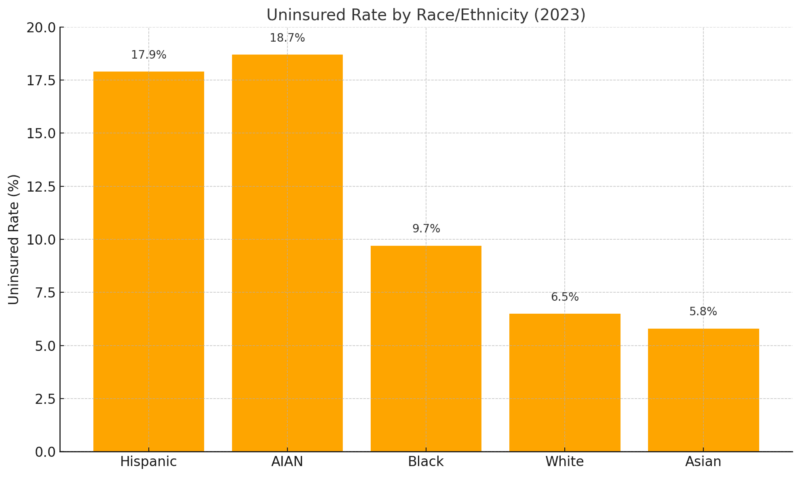
These disparities reflect differences in income, employment, immigration status, and state policy.
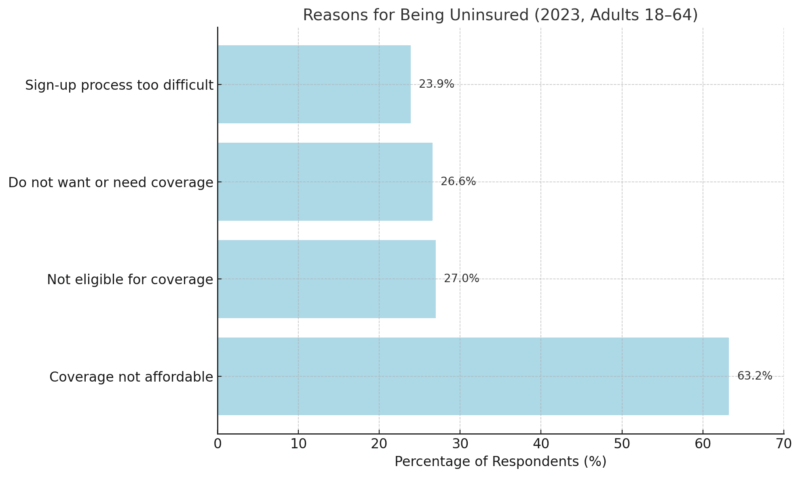
Trend 8: Affordability Is the Top Barrier to Coverage
The most common reason cited for being uninsured in 2023 was cost:
- 63.2% of uninsured adults ages 18–64 cited affordability
- 64.7% worked for an employer that did not offer health insurance
Reasons for Being Uninsured (2023, Adults 18–64)
Premium growth continues to outpace wage growth, especially among small business employees.
In 2023, the average premium for small business health insurance was about $450 per employee per month, totaling $5,400 annually. By comparison, individual health insurance premiums averaged $7,200 per year.
Additionally, the average deductible for small group plans was approximately $3,000, which is more than $1,000 less than the average individual plan deductible. Nearly 70% of small employers covered at least half of the premium, significantly lowering employees’ out-of-pocket costs, more you can find on taylorbenefitsinsurance.com/small-group-health-insurance-plan/.
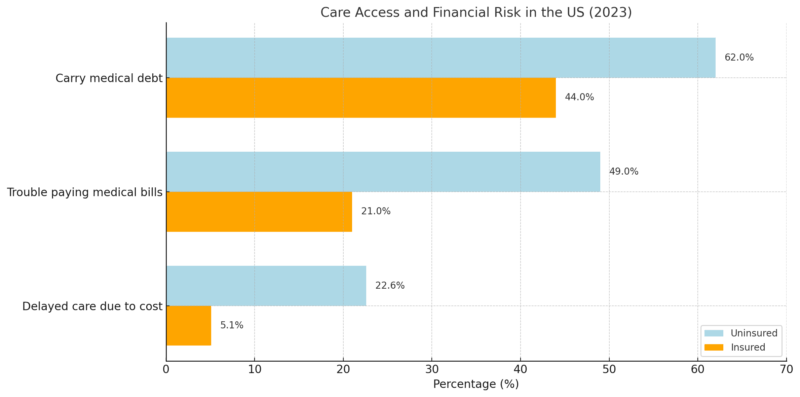
Trend 9: Being Uninsured Means Worse Access and More Financial Risk
The consequences of being uninsured extend far beyond statistics—they are felt in delayed diagnoses, unmanaged chronic conditions, and crushing medical debt.
In 2023, nearly half (46.6%) of uninsured adults ages 18–64 reported not seeing a doctor in the past year, and 22.6% said they skipped needed care because of the cost. Over six in ten (62%) reported carrying health care debt, compared to just 44% of insured adults.
This financial burden often leads to cascading effects such as damaged credit, difficulty paying rent, or deferring other essential expenses like food and utilities.
Uninsured individuals are more likely to be hospitalized for preventable conditions, less likely to receive screenings or follow-up care, and more likely to experience avoidable complications.
Studies consistently show that gaining health insurance, especially through Medicaid, leads to better access to care, improved health outcomes, and greater financial stability. The uninsured are not just at a disadvantage; they are at active risk, both medically and economically.
- 22.6% delayed or skipped needed care due to cost
- 62% of uninsured adults carry health care debt
Care Access and Financial Risk (2023)
Uninsured people are more likely to be hospitalized for avoidable issues and less likely to receive preventive care.


