Virginia population is estimated at 8,626,210, marking a noteworthy increase since the last census according to the World Population Review.
This growth positions Virginia among the top states in the country in terms of population expansion.
Bordered by Maryland, West Virginia, Kentucky, Tennessee, and North Carolina.
Despite these numbers, there are emerging challenges that could influence future demographics.
Interestingly, Virginia has experienced a slight annual growth rate of approximately 1.15% over recent years.
Key Takeaways
Age Distribution
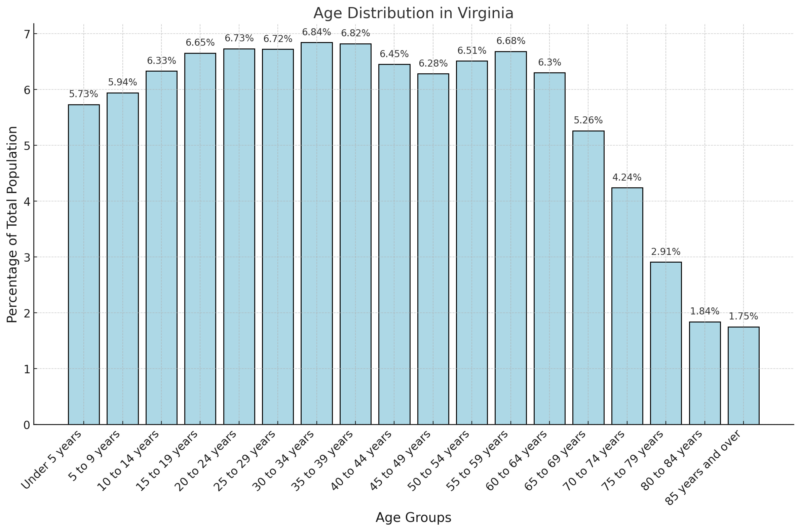
According to the 2018-2022 ACS 5-Year Estimates, the median age in Virginia is 38.7 years. The population is distributed as follows:
Gender Distribution
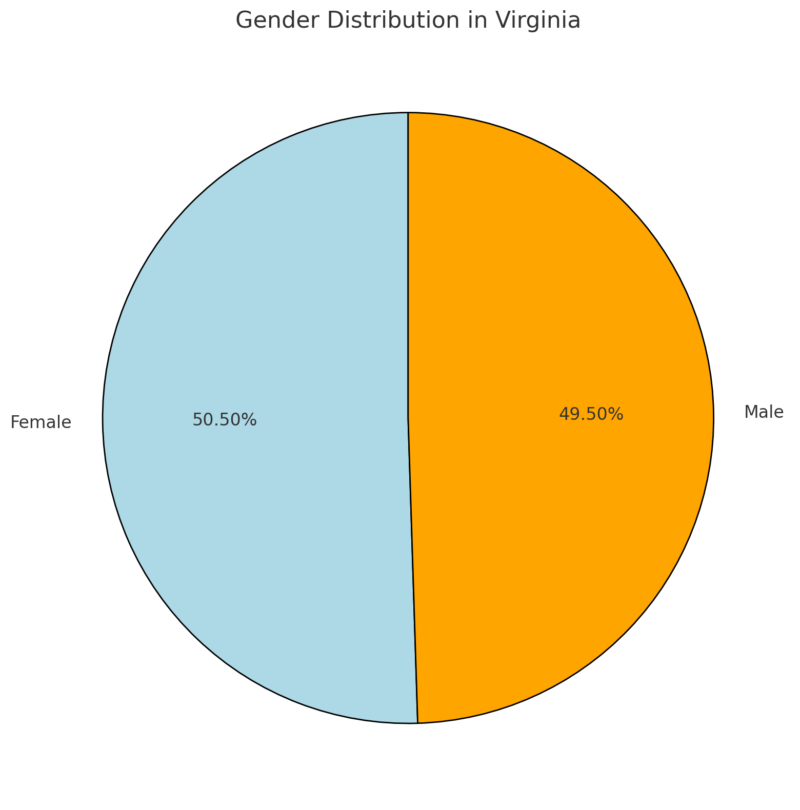
The total population of Virginia is estimated at 8.62 million, comprising 4.27 million males (49.50%) and 4.36 million females (50.50%).
There are 86,961 more females than males in the state.
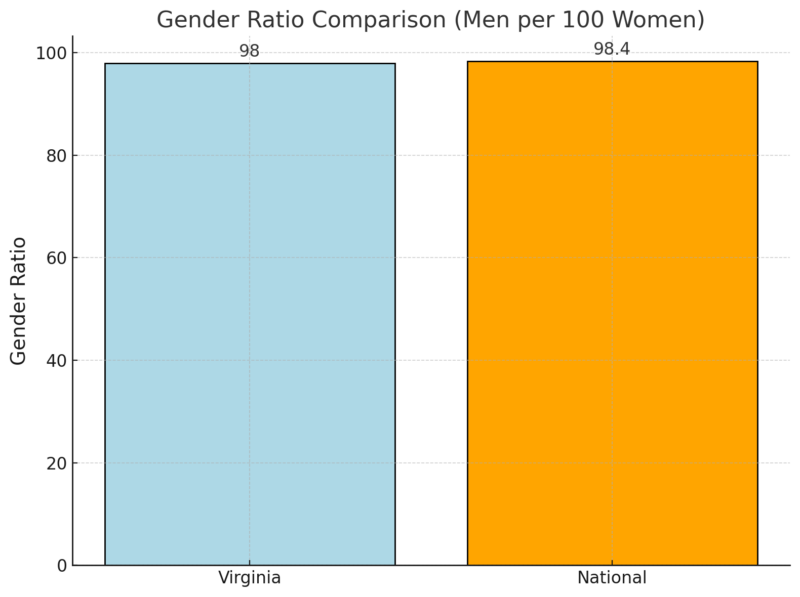
Virginia’s gender ratio shows there are 98 men for every 100 women, slightly lower than the national average of 98.4 men per 100 women according to the Neilsberg article.
Virginia’s population has seen notable growth, with the 2025 population estimated at approximately 8.72 million.
This represents a modest increase from previous years, highlighting a steady growth rate. The state’s population growth is marked by a 0.42% increase from the previous year.
Gender Ratio Comparison
- Population Dynamics: The higher percentage of females in Virginia could influence state-level decisions, including healthcare, education, and market segmentation strategies targeting female consumers.
- Market Research Opportunities: Businesses can tailor services and products to better meet the needs of the female-majority population in Virginia.
- Policy Implications: The gender ratio may affect initiatives related to workforce development, family services, and healthcare targeting specific age or gender groups.
Population by Race
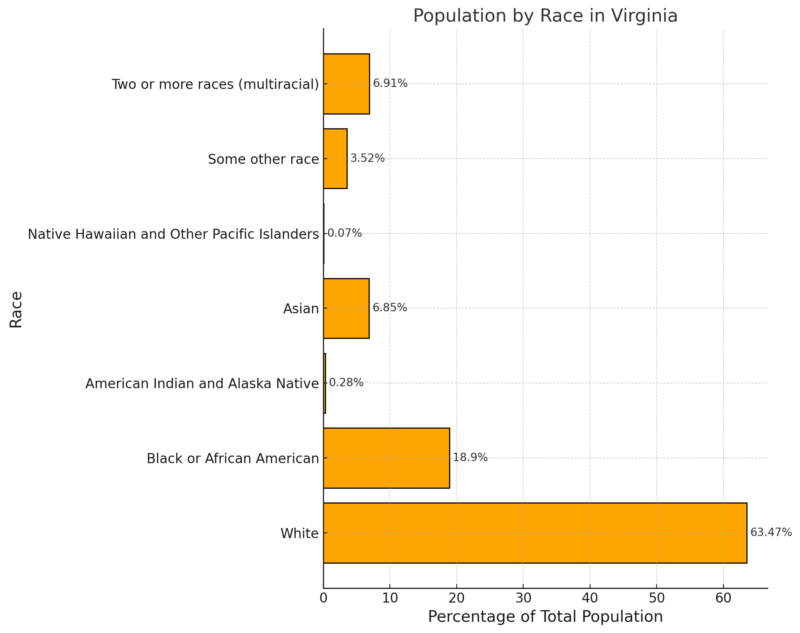
The racial composition of Virginia reveals that the majority of the population identifies as White, making up 63.47% of the total population as per Neilsberg.
This is followed by Black or African American residents, who constitute 18.90% of the population, making them the second-largest racial group in the state.
Asians and multiracial individuals represent 6.85% and 6.91%, respectively, indicating an increasingly diverse population.
Smaller racial groups, such as American Indian and Alaska Native (0.28%), Native Hawaiian and Other Pacific Islander (0.07%), and “Some other race” (3.52%), contribute to the overall racial landscape.
Virginia Population By Counties 2025
County/City
Population
County/City
Population
Fairfax County
1,144,447
Prince William County
492,268
Virginia Beach city
452,229
Loudoun County
439,902
Chesterfield County
389,462
Henrico County
334,967
Chesapeake city
255,313
Arlington County
234,646
Richmond city
230,127
Norfolk city
229,302
Newport News city
182,256
Stafford County
167,687
Alexandria city
155,415
Spotsylvania County
152,348
Hampton city
136,338
Albemarle County
116,507
Hanover County
115,436
Suffolk city
102,892
Montgomery County
98,506
Roanoke County
97,296
Frederick County
97,180
Roanoke city
96,685
Portsmouth city
96,632
Rockingham County
87,722
James City County
83,825
Bedford County
82,309
Lynchburg city
79,842
Augusta County
78,555
Fauquier County
75,653
York County
70,740
Pittsylvania County
59,318
Franklin County
56,019
Culpeper County
55,656
Campbell County
55,475
Washington County
54,245
Harrisonburg city
51,014
Henry County
49,609
Shenandoah County
45,520
Charlottesville city
44,694
Prince George County
42,721
Manassas city
42,719
Warren County
42,282
Louisa County
42,044
Danville city
41,657
Isle of Wight County
41,287
Gloucester County
40,564
Orange County
39,093
Tazewell County
38,677
Wise County
35,021
Botetourt County
34,150
Pulaski County
33,627
Caroline County
33,340
Accomack County
33,255
Halifax County
33,244
Petersburg city
33,156
Powhatan County
32,625
Amherst County
31,320
Mecklenburg County
30,769
Carroll County
29,360
King George County
29,218
Fredericksburg city
29,208
Smyth County
29,024
Fluvanna County
28,807
Dinwiddie County
28,587
Goochland County
28,232
Wythe County
28,093
Winchester city
27,373
New Kent County
27,316
Staunton city
25,890
Fairfax city
25,536
Russell County
25,517
Salem city
25,500
Page County
23,705
Waynesboro city
23,565
Hopewell city
22,714
Prince Edward County
22,199
Rockbridge County
22,148
Lee County
21,643
Greene County
21,587
Scott County
21,386
King William County
19,531
Westmoreland County
19,261
Buchanan County
18,791
Colonial Heights city
18,508
Southampton County
18,051
Patrick County
17,417
Radford city
17,223
Appomattox County
17,025
Buckingham County
16,968
Bristol city
16,674
Giles County
16,482
Manassas Park city
16,029
Williamsburg city
16,009
Floyd County
15,735
Brunswick County
15,667
Clarke County
15,601
Nottoway County
15,577
Grayson County
15,245
Falls Church city
14,881
Nelson County
14,663
Alleghany County
14,475
Madison County
14,248
Martinsville city
13,829
Amelia County
13,592
Dickenson County
13,547
Poquoson city
12,646
Northumberland County
12,504
Lunenburg County
12,074
Northampton County
12,064
Charlotte County
11,272
Greensville County
11,062
Lancaster County
10,912
Middlesex County
10,896
Sussex County
10,874
Essex County
10,566
Cumberland County
10,005
Richmond County
9,242
Mathews County
8,578
Franklin city
8,404
Lexington city
7,550
Rappahannock County
7,375
Galax city
6,732
King and Queen County
6,726
Surry County
6,659
Charles City County
6,652
Buena Vista city
6,563
Bland County
6,220
Covington city
5,457
Emporia city
5,393
Craig County
4,828
Bath County
4,041
Norton city
3,395
Highland County
2,382
WPR notes that Fairfax County is Virginia’s most populous county with 1,148,433 residents in 2019, a 5.68% increase since the last census. Loudoun County, with 398,080 residents, is the fastest-growing, with a 26.13% population surge. Other large counties include Prince William (463,023) and Virginia Beach City (450,435).
The least populous county is Highland County (2,212). Other counties with fewer than 6,000 residents, such as Norton City, Bath County, and Emporia City, have seen population declines, with Emporia losing 10.78%.
Loudoun County, along with Falls Church City (17.21%), New Kent County (16.92%), and Fredericksburg City (16.41%), lead the state in growth rates.
Immigration Virginians 2025
Category
Details
Foreign-born population (2018)
1,065,000 (12.5% of Virginia’s population; 86.8% growth since 2000)
Top regions of origin
Latin America (33%), Asia (41.8%), Africa (10.7%)
Median age
37.1 years
Naturalized citizens
54% of immigrants (575,000 people, 60% increase since 2007)
Primary languages spoken
Spanish, Arabic, Vietnamese, Urdu, Chinese
Top home countries
El Salvador, India, Mexico, Korea, Vietnam
Undocumented population (2016)
269,000; primarily from El Salvador, Mexico, Honduras, Guatemala, Philippines
Labor force participation
72% (compared to 65% of native-born residents)
Economic contributions
$2.7 billion in state/local taxes; $555 million in business income (2014)
K-12 English Learners
12% of Virginia students (67% Spanish speakers)
Challenges
High uninsurance rates (52%), language barriers, poverty (46% below 200% poverty level)
COVID-19 impact
Latinx population disproportionately affected; 64% of cases in Fairfax County
Immigrants in Virginia constitute a significant and growing part of the state’s population, contributing extensively to the economy, workforce, and cultural diversity as per government reports.
With 12.5% of the population being foreign-born, most immigrants hail from Latin America and Asia, with El Salvador and India being leading home countries.
The median age of immigrant Virginians is 37.1 years, and 54% have become naturalized citizens, a significant rise over the past decade.
“The report made several policy recommendations, particularly focusing on improving health care access and educational opportunities for immigrant children.”
— New Virginia Majority (@NewVAMajority) October 16, 2024
Immigrants play a key role in Virginia’s economy, accounting for $2.7 billion in taxes and significant contributions to businesses and labor.
However, undocumented immigrants face challenges such as limited access to healthcare, language barriers, and poverty.
Income Levels
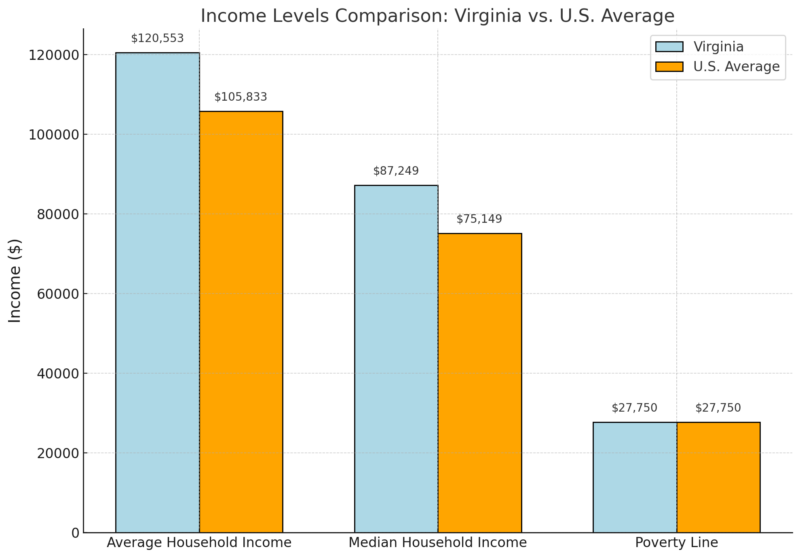
Income By Zip Code notes that Virginia households earn significantly more on average and at the median level than the national figures, with differences of 14% and 16%, respectively.
This highlights Virginia’s relatively higher income levels, which could be attributed to the state’s diverse economy and concentration of high-income areas such as Northern Virginia.
Richest Zip Codes in Virginia
Rank
Zip Code
Population
Mean Income
Median Household Income
1
20129
533
$480,668
$250,001
2
22101
30,729
$360,494
$250,001
3
22066
16,925
$352,284
$250,001
4
22027
1,974
$329,919
$250,001
5
22207
34,647
$311,011
$227,941
6
22039
17,624
$291,438
$250,001
7
22124
18,449
$274,958
$201,541
8
20124
15,117
$265,192
$208,125
9
20197
2,359
$259,097
$224,620
10
22182
26,892
$253,097
$202,411
Virginia’s wealthiest zip codes are predominantly located in Northern Virginia, with 20129 leading the list.
These areas benefit from high-paying jobs in government, technology, and business. The substantial mean and median household incomes indicate concentrated affluence.
Virginia Salary Data
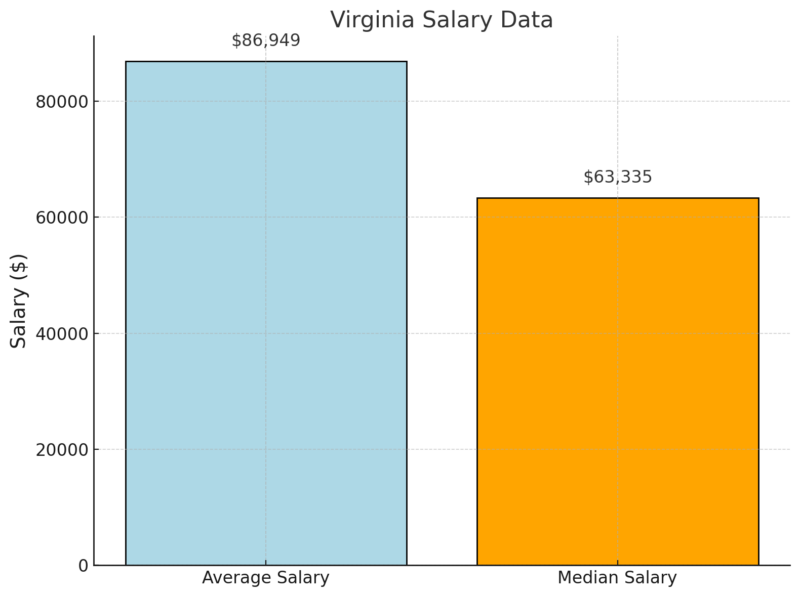
The average salary in Virginia is $86,949, significantly higher than the median salary of $63,335.
This gap suggests that high earners in the state are pulling up the average, likely due to the presence of well-paid professionals in Northern Virginia and other metropolitan areas.
Virginia Individual and Family Income Data
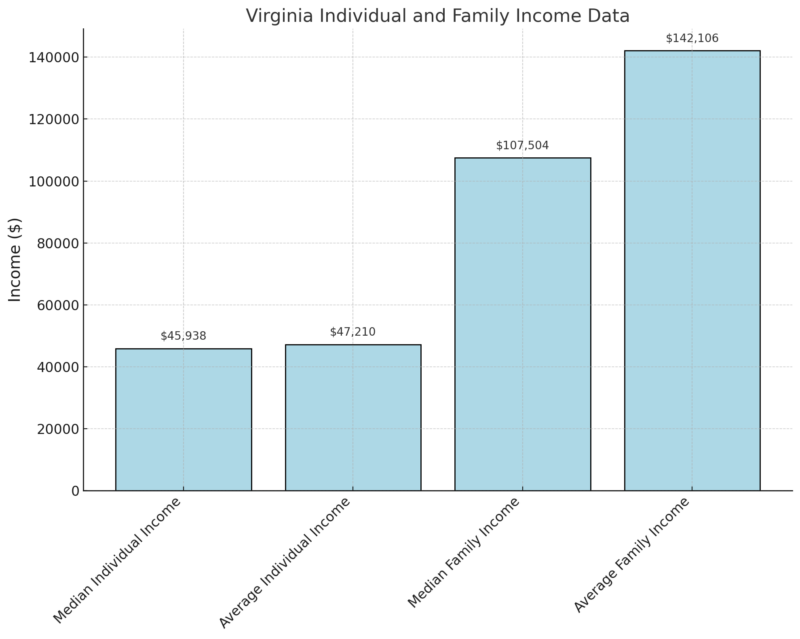
Virginia’s average family income ($142,106) is significantly higher than its median ($107,504), reflecting income disparities driven by high earners.
Individual incomes are notably lower, emphasizing the contribution of multiple earners in families to the state’s overall income levels.
Education Attainment
Educational Attainment in Virginia (Population Aged 25 and Older)
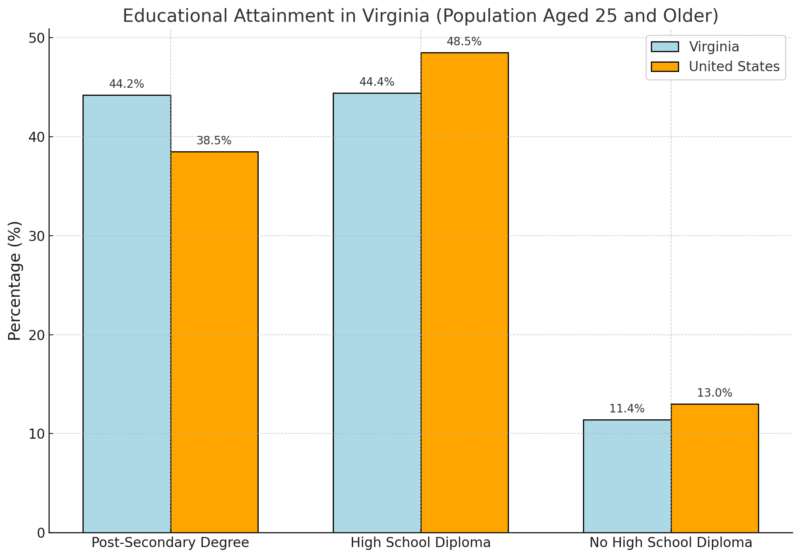
- Higher Degree: Virginia outperforms the national average by 15%, with 44.2% of residents having a post-secondary degree, reflecting the state’s strong educational attainment in higher education as noted by Statistical Atlas.
- High School Diploma: Virginia’s percentage of residents with only a high school diploma is slightly below the national average by 8.5%, indicating a shift toward higher educational levels.
- No High School Diploma: Virginia has fewer residents without a high school diploma (11.4%) compared to the national average (13.0%), a positive indicator of educational attainment.
Health and Wellness Statistics
Indicator
Value
Fertility Rate
55.6 (births per 1,000 women aged 15-44)
Teen Birth Rate
11.2 (births per 1,000 females aged 15-19)
Infant Mortality Rate
6.21 (infant deaths per 1,000 live births)
Life Expectancy at Birth
76.8 years (2020)
Marriage Rate
6.0 (marriages per 1,000)
Divorce Rate
2.9 (divorces per 1,000)
Leading Cause of Death
Heart Disease
Drug Overdose Death Rate
28.8 (per 100,000)
Firearm Injury Death Rate
14.9 (per 100,000)
Homicide Rate
7.8 (per 100,000)
CDC notes that the fertility rate of 55.6 and teen birth rate of 11.2 suggest declining birth trends, aligning with national patterns of lower fertility.
At 76.8 years, life expectancy is slightly lower than recent U.S. averages, likely impacted by drug overdose rates and chronic diseases.
Heart disease remains the leading cause of death, emphasizing the need for preventive healthcare. Drug overdose and firearm injury death rates are also significant public health concerns.
Additional Birth Data in Virginia (2022)
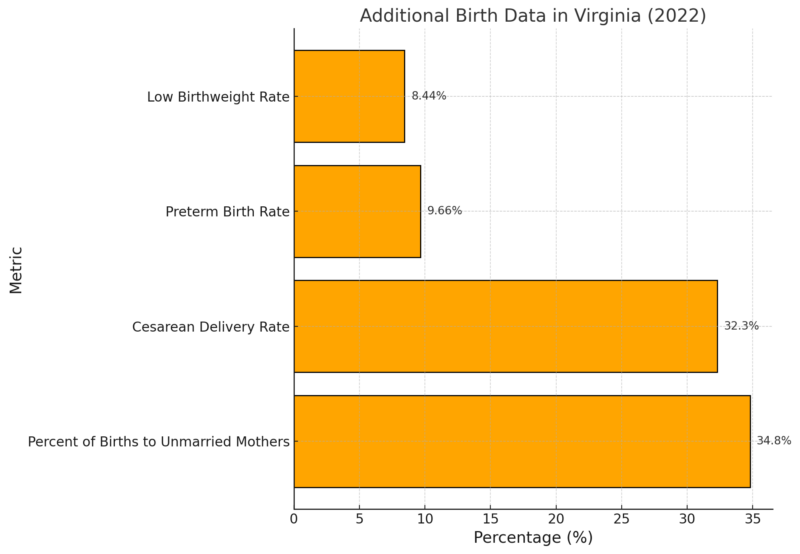
One-third of births in Virginia are to unmarried mothers, a statistic that may reflect changing family structures or socioeconomic factors.
With a rate of 32.3%, cesarean deliveries are common and above the World Health Organization’s recommended rate of 10-15%.
Preterm (9.66%) and low birthweight (8.44%) rates highlight ongoing challenges in maternal and child health, requiring enhanced prenatal care and early intervention programs.
Job Openings and Labor Turnover
Metric
August 2024
September 2024
Change
Job Openings
268,000
244,000
-24,000
Job Openings Rate
5.9%
5.4%
-0.5%
Hires
157,000
165,000
+8,000
Separations
136,000
147,000
+11,000
Quits
88,000
94,000
+6,000
Layoffs & Discharges
36,000
44,000
+8,000
Virginia’s job openings declined in September while hiring and separations increased.
BLS notes that the job openings rate dropped from 5.9% to 5.4%, reflecting a tighter labor market.
Quits rose slightly, signaling continued worker confidence, while layoffs increased modestly.
Job Openings Rate Comparison
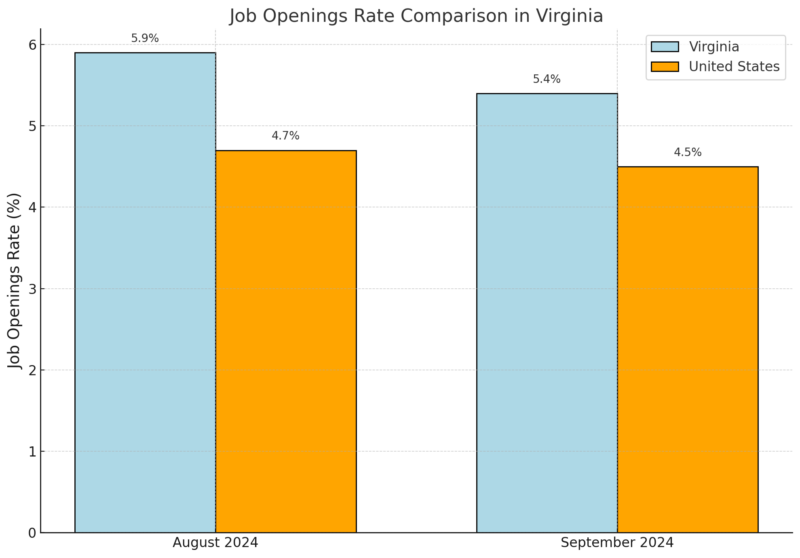
Virginia maintained a higher job openings rate than the national average, indicating robust labor demand despite a slight decline from the previous month.
Unemployed Persons Per Job Opening (September 2024)
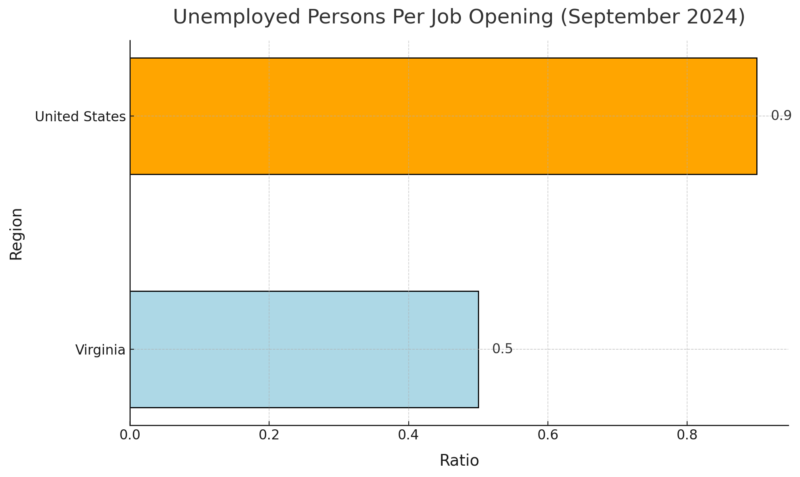
Virginia’s tight labor market is evident in its low ratio of unemployed persons per job opening, significantly outperforming the national average of 0.9.
Average Hires and Separations (Last 12 Months)
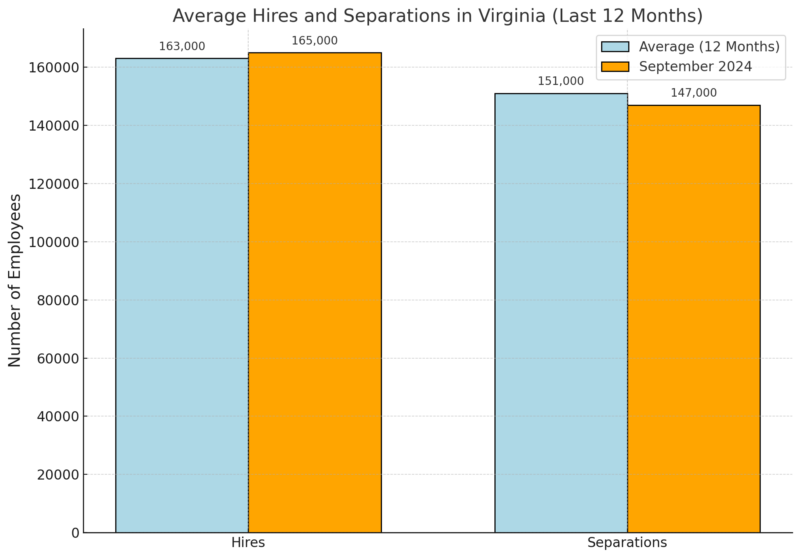
Hires in September were slightly above the 12-month average, while separations were below average, indicating relative stability in the labor market dynamics.
Employment and Unemployment
Metric
May 2024
June 2024
July 2024
August 2024
September 2024
October 2024 (p)
Civilian Labor Force (1)
4,579.0
4,574.7
4,570.7
4,568.8
4,571.6
4,575.3
Employment (1)
4,454.2
4,452.2
4,446.0
4,440.5
4,440.3
4,441.7
Unemployment (1)
124.8
122.5
124.7
128.3
131.4
133.6
Unemployment Rate (2)
2.7%
2.7%
2.7%
2.8%
2.9%
2.9%
The data shows that Virginia’s civilian labor force remained relatively stable between May and October 2024, with a slight increase from 4,579.0 in May to 4,575.3 in October.
Employment figures showed a small decline, dropping from 4,454.2 in May to 4,441.7 in October, while unemployment increased from 124.8 in May to 133.6 in October.
View this post on Instagram
The unemployment rate also rose slightly, from 2.7% in May to 2.9% in both September and October, reflecting modest changes in labor market dynamics during this period.
Housing Market Trends 2025
Metric
Value
YoY Change
Median Sale Price
$447,600
+6.7%
Number of Homes Sold
9,204
+9.7%
Median Days on Market
32 days
+5 days
Home prices in Virginia continue to rise, with a 6.7% increase year-over-year, reflecting strong demand.
The number of homes sold also grew by 9.7%, indicating robust buyer activity.
However, homes are taking slightly longer to sell, with a median of 32 days on the market, up 5 days from last year according to Redfin.
Top 10 Metros in Virginia with the Fastest Growing Sale Prices (October 2024)
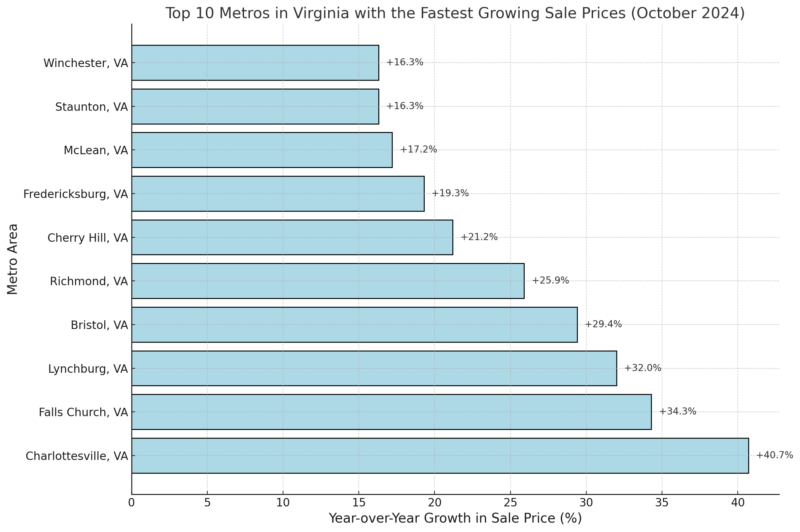
Charlottesville leads the state with an impressive 40.7% increase in sale prices, followed by Falls Church at 34.3%.
These increases indicate localized hotspots of demand, driven possibly by economic growth or migration patterns.
Other metros like Lynchburg and Richmond also show significant price surges.
Virginia Housing Supply
Metric
Value
YoY Change
Number of Homes for Sale
29,649
+11.9%
Number of Newly Listed Homes
10,505
+7.9%
Months of Supply
2
0
The housing supply in Virginia has grown, with an 11.9% increase in homes for sale year-over-year, and newly listed homes also rising by 7.9%.
Despite this, the months of supply remain unchanged at 2 months, signaling ongoing high demand relative to supply.
Virginia Housing Demand
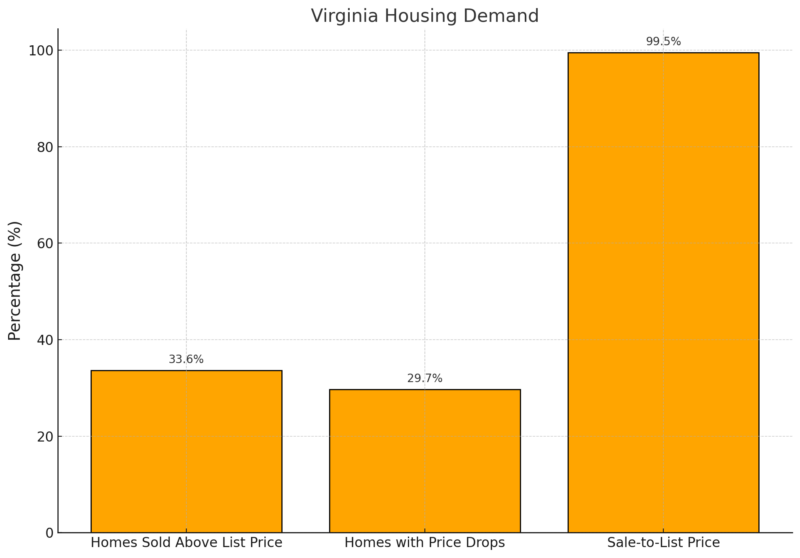
The market is showing signs of reduced competition, with a smaller percentage of homes selling above the list price (-4.7 points).
However, nearly 30% of homes experienced price drops, and the sale-to-list price ratio dipped slightly to 99.5%, suggesting that sellers may be adjusting expectations as demand softens slightly.
Methodology
- Data was sourced from reliable government reports, including U.S. Census and Bureau of Labor Statistics.
- Population trends and demographics were derived from 2025 estimates and ACS 5-Year Estimates.
- Housing market data was analyzed using metrics from MLS and Redfin reports.
- Employment and labor data were extracted from BLS JOLTS and labor force summaries.
- Economic and educational statistics were compiled from Statistical Atlas and Neilsberg studies.
- Data comparisons were made with national averages to highlight Virginia’s unique dynamics.