In 1800, the federal government officially moved to its new capital, initially called the “City of Washington” and later known as the District of Columbia.
On November 17, 1800, Congress held its first session in this new location.
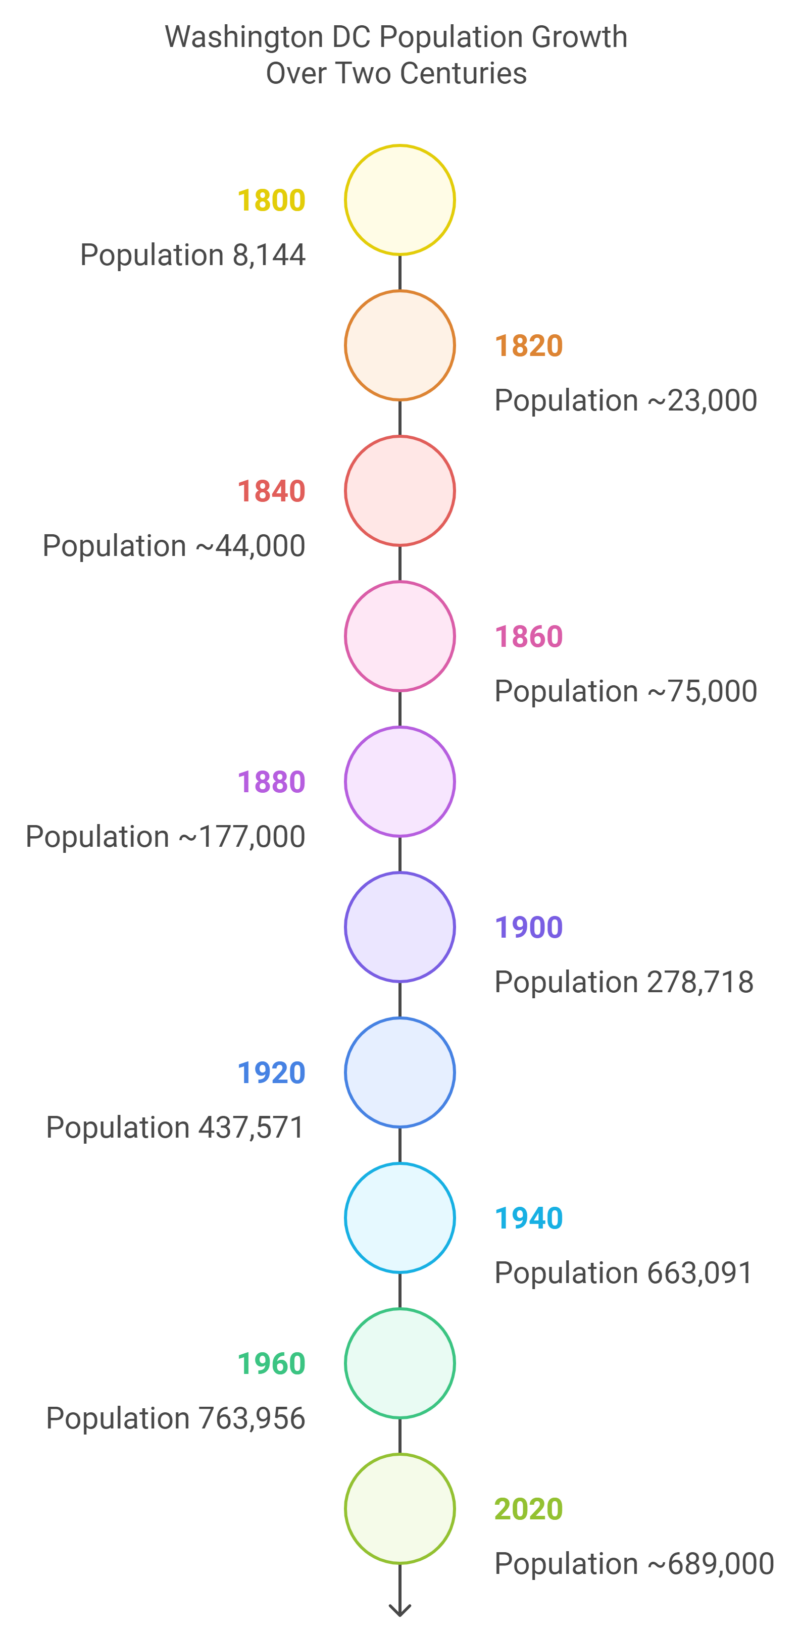
At that time, the population of the District was just 8,144. By 1900, this number had risen to 278,718.
Washington DC population according to the 2010 Census, reached 601,723.
The District of Columbia saw significant changes in its population over the 210 years from 1800 to 2010.
From 1800 to 1900, it grew by over 3,000%, from 8,144 to 278,718 people. Over the next 50 years, the population continued to rise, peaking in 1950 at 802,178.
However, between 1950 and 2000, the population dropped by approximately 230,000, with the census in 2000 recording 572,059 residents.
District of Columbia Population 2024
As of 2024, Washington DC population is 686,995 according to World Population Review.
Over the centuries, the population of the District has fluctuated dramatically:
Growth Chart of Washington D.C. (1800-2024)
Washington DC population (District of Columbia), often referred to simply as D.C., is the capital of the United States and a federal district. It is not part of any U.S. state and falls under the jurisdiction of Congress in 2024.
The District was established with land contributions from Virginia and Maryland and was named in honor of George Washington.
If Washington, D.C. were a state, it would be ranked as the 49th most populous, surpassing Wyoming and Vermont in size.
- Size: Washington, D.C. spans a total of 68 square miles, but only 61 square miles of that island.
- Density: With a population density of 11,535 people per square mile, D.C. holds the title for the highest population density in the United States.
- Weekday Surge: On workdays, the population increases to over 1 million as commuters travel from neighboring Virginia and Maryland.
The Washington metropolitan area, which includes surrounding suburbs, has a population of over 5,545,000 as per Macrotrends, making it the 7th largest metro area in the United States in 2024.
When combined with Baltimore and its suburbs, the Baltimore-Washington Metropolitan Area houses over 9 million people, ranking it as the 4th largest CSA in the country.
District of Columbia Population by Race and Hispanic Origin
Year
Total
White
Black (Any Race)
Asian
Other Races
Hispanic Origin
2010
601,723
231,471
305,125
21,056
41,992
209,464
2000
572,059
176,101
343,312
15,189
35,744
161,260
1990
606,900
179,667
399,604
11,214
32,710
166,131
1980
638,333
171,768
448,906
6,636
17,679
164,244
1970
756,510
209,272
537,712
5,372
15,671
200,656
1960
763,956
345,263
411,737
4,690
1,679
(NA)
Early 20th Century Demographics
At the dawn of the 20th century, Washington DC population was a growing hub, marked by gradual increases in population. By 1900, it was already an important federal center with a diverse community.
Significant growth occurred during World War I, as the war effort brought more people to the city. This period was characterized by a rising demand for labor in both government and supporting industries. In particular, the federal government’s expansion during this time contributed to a larger workforce residing in the area.
The city continued to expand into the 1920s and 1930s, attracting a variety of populations, including a notable increase in African American residents, who played integral roles in various sectors of the workforce.
Mid-Century Migration and Growth
The post-World War II era marked a notable period of migration and urban development. The city saw a population boom due to economic opportunities and federal job growth.
In the 1950s, many new residents were attracted by the promise of stable employment in governmental roles. This influx helped establish the city’s reputation as a vibrant and economically robust metropolis. At the same time, the urban development resulted in significant changes to city infrastructure and housing.
Suburbanization began to take hold as well, with many individuals and families relocating to surrounding areas, impacting demographic patterns not only in the city but also in the broader Washington, DC metropolitan region.
Age Range in Washington D.C.
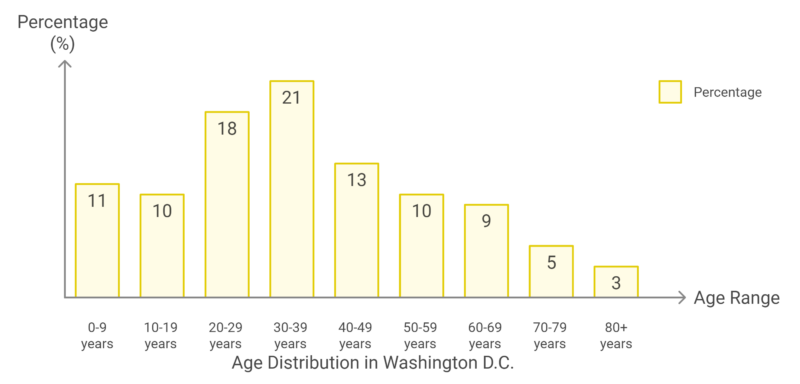
The population in Washington, D.C. skews relatively young, with the largest portion of residents falling in the 20-39 year age range (39% combined) according to Census reporter.
This reflects the presence of young professionals, students, and early-career individuals, likely influenced by the city’s status as a political, educational, and cultural hub.
A smaller percentage of the population is above the age of 60, comprising 17%, which indicates that D.C. may have fewer retirees compared to other regions.
Age Category
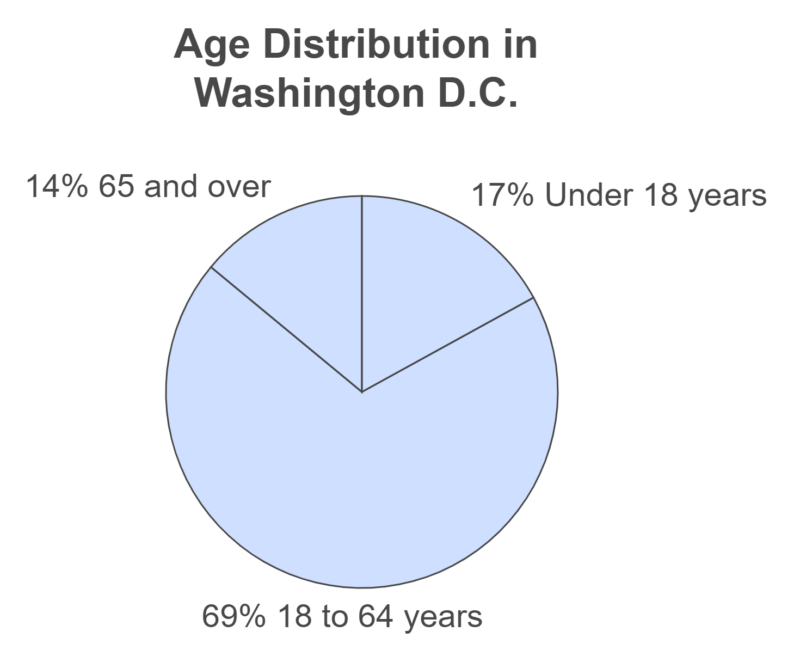
Most of the population (69%) falls within the working-age group of 18 to 64, reflecting a city with a vibrant and active workforce.
17% is under 18 years old, highlighting a sizable younger demographic.
The 65 and over category constitutes 14%, showing a moderately sized senior population.
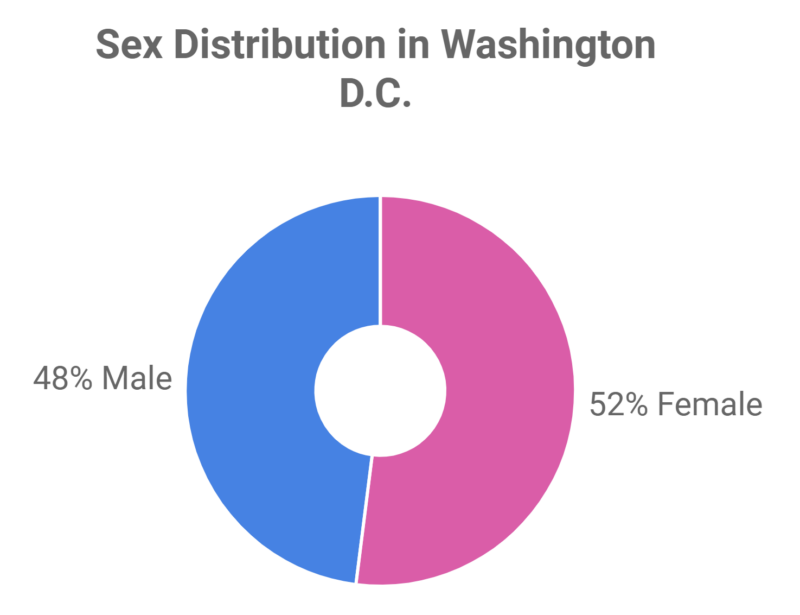
Sex Distribution
Race and Ethnicity in Washington D.C.
- Black or African American residents form the largest racial group in the city, accounting for 42% of the population, making Washington, D.C. a majority-minority city.
- White residents make up 37% of the population, followed by Asian residents at 4% and those identifying as Two or More Races at 5%.
- The Hispanic population, at 12%, is smaller than the national average but slightly higher than in surrounding regions like Virginia.
Socioeconomic Influences on Population Dynamics
Various socioeconomic factors significantly impact the Washington DC population dynamics. Economic shifts, housing trends, and policy changes have all played crucial roles in shaping the city’s demographics.
1. Economic Booms and Busts
The economy of Washington, D.C. has experienced significant shifts over the past century. These shifts directly impacted the city’s population growth and decline.
Employment and Population Growth Over Time
Period
Key Event
Population Impact
Employment Trends
World War II (1940s)
Economic boom
The population surged, peaking at 802,178 in 1950
Government jobs increased sharply
Early 1990s
Recession and job losses
Declined by 100,000
Decline in public sector jobs; crime rates increased
2000s Recovery
Economic recovery and tech growth
Started to increase again, reaching 601,723 by 2010
Growth in professional services and tech industries
- The population of Washington, D.C. peaked in 1950 at 802,178 due to the influx of workers during World War II and the post-war boom.
- In the early 1990s, D.C. experienced a significant decline, losing over 100,000 residents. This was driven by an economic recession, high crime rates, and a reduction in job availability.
- By the 2000s, the economy rebounded, with growth in the tech and professional services sectors. This recovery helped increase the population to 601,723 in 2010 according to HUDSER.
2. Housing Market Trends
View this post on Instagram
Housing affordability and availability have played a central role in shaping the dynamics of Washington, D.C. The rising cost of living and gentrification have driven both in-migration and out-migration patterns.
Washington, D.C. Housing Market (2020–2024)
Year
Median Home Price ($)
Change (%)
Median Rent (1BR, $)
Rent Change (%)
Affordable Housing Gap (Units)
2020
649,000
+5%
2,090
+3.5%
350,000
2021
678,000
+4.5%
2,150
+2.8%
357,948
2022
693,000
+2.2%
2,175
+1.2%
360,000
2024
714,833
+1.1%
2,200
+1.5%
365,000
- The median home price in Washington, D.C. is now $714,833 as of 2024, representing a 1.1% increase from 2023as per the Zillow report.
- The median rent for a one-bedroom apartment in the city is $2,200, a 1.5% increase from the previous year(
- D.C. faces a shortage of affordable housing, with a gap of approximately 365,000 affordable units in 2024, a number that has grown from 350,000 in 2020(
- Gentrification in neighborhoods like Navy Yard and Shaw has contributed to higher housing prices, attracting wealthier residents but displacing long-time, lower-income families(
3. Policy Impacts on Demographics
Government policies related to housing, education, and social services have had a profound impact on the population and demographic makeup of Washington, D.C.
Policy Area
Example Policy/Initiative
Population Impact
Affordable Housing
Mayor Bowser’s Initiative to build 36,000 new homes by 2025
Aims to close the affordable housing gap by providing 12,000 affordable units
Infrastructure and Urban Planning
Urban revitalization projects like Navy Yard redevelopment
Attracted younger professionals and higher-income residents, contributing to gentrification
Immigration Policy
National policy changes affecting visa programs
12% of D.C.’s population is Hispanic, partially driven by relaxed immigration policies
Unemployment Rate in Washington D.C. (2023)
November 2023 Unemployment Rate: 5.0%
This was higher than the national average, positioning Washington, D.C. with the second-highest unemployment rate in the U.S., after Nevada (5.4%)
Unemployment Rate by Year in Washington D.C.
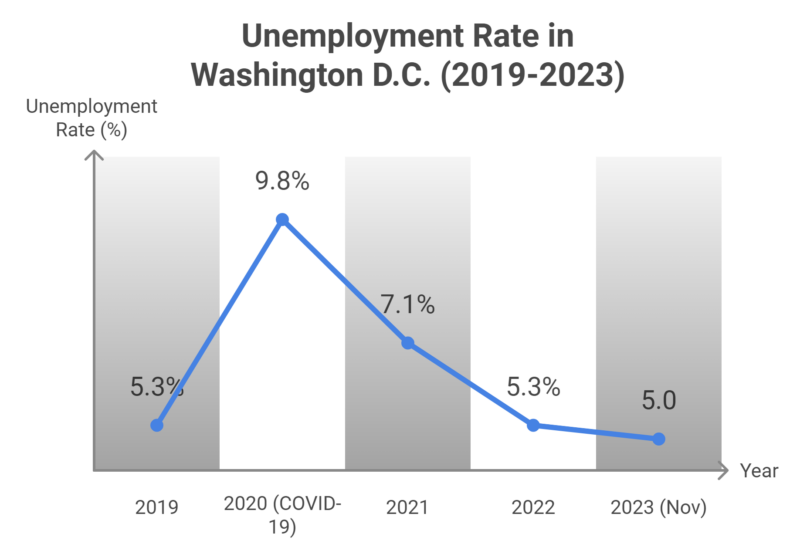
The unemployment rate in D.C. peaked in 2020 during the COVID-19 pandemic but has been steadily decreasing since, though it remains higher than the national average according to USA FACTS.
Real Gross Domestic Product (GDP) in Washington D.C. (2023)
3rd Quarter 2023 GDP: $179.2 billion
Washington, D.C. accounted for 0.7% of the total U.S. economy in the 3rd quarter of 2023, ranking 34th among states and territories in economic size(
Real GDP Growth by Year
Year
Real GDP ($ Billion)
GDP Growth Rate (%)
2018
$158.2
1.7%
2019
$162.7
2.3%
2020 (Pandemic)
$153.1
-5.9%
2021
$166.4
3.9%
2022
$172.3
1.8%
3rd Quarter 2023
$179.2
2.4% (annualized)
2023 GDP Growth: In the 3rd quarter of 2023, the real GDP growth rate for Washington, D.C. was 2.4%, marking a recovery from the pandemic and positioning D.C. close to the national GDP growth rate.
Educational Attainment of Adults in Washington D.C. 2024
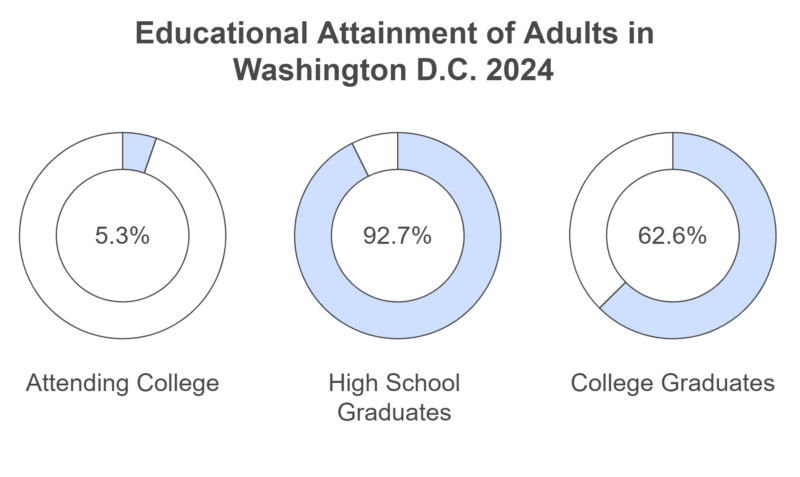
High School Graduates (92.7%)
A very high percentage of Washington, D.C. adults have completed high school, which is above the national average (around 89%). This indicates strong access to basic education in the city.
College Graduates (62.6%)
The percentage of college graduates is significantly higher than the U.S. national average of around 38%, highlighting the city’s educated population, likely due to its concentration of government jobs, think tanks, and universities.
Attending College (5.3%)
A smaller proportion of residents are currently attending college, likely reflecting that many have already attained a degree.
Income in Washington D.C. vs. USA
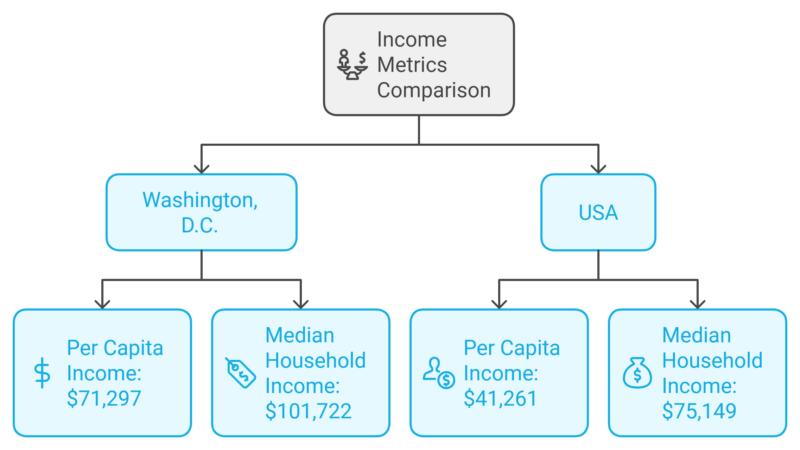
- Per Capita Income ($71,297): D.C.’s per capita income is significantly higher than the U.S. average, reflecting its concentration of high-paying jobs in government, law, and consulting according to Neighborhood Scout.
- Median Household Income ($101,722): Similarly, the median household income in D.C. is much higher than the national median, indicating a wealthier population on average.
Individuals Below Poverty Level in Washington D.C.
Despite the high average income, 15.1% of D.C.’s residents live below the poverty level, higher than the national average of around 11%. This disparity reflects the economic inequality in the city, where a wealthy professional class coexists with a substantial low income.
Employment Industries in Washington, D.C.
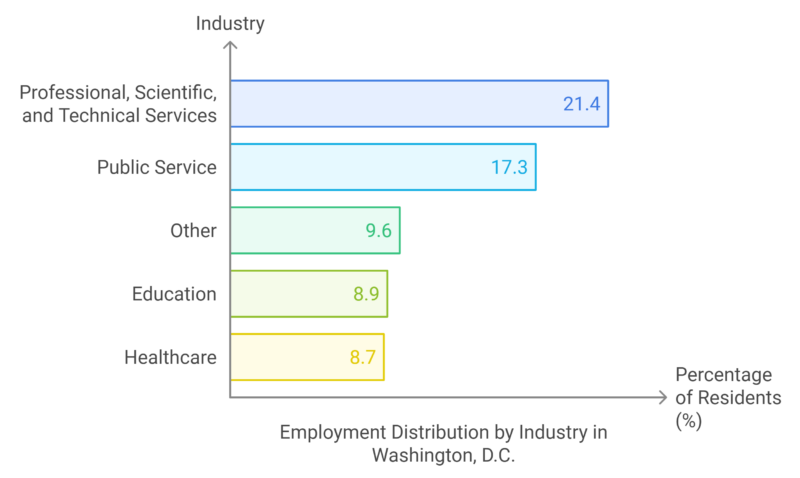
The largest employment sector in D.C. reflects the city’s role as a center for federal contracting, law firms, think tanks, and consulting.
Unsurprisingly, many residents work in government jobs, given D.C.’s status as the nation’s capital.
Education (8.9%) and healthcare (8.7%) are also significant employers, representing the city’s universities, hospitals, and research institutions.
Statistical Analysis and Projections
The Washington DC population has been slowing in growth in recent years.
Population growth over the past few years has primarily been driven by international migration and natural population growth (births minus deaths).
Different sources have varying projections for D.C.’s population growth over the next decade:
Projections for Washington D.C. (2020-2030)
Source
2020 Population
2030 Population
Expected Growth (2020-2030)
IHS Markit
~
744,390
57,395
Moody’s Analytics
~
781,000
94,005
Metropolitan Washington Council of Governments (COG)
~
842,200
155,205
- IHS Markit predicts slower growth, with a projected population of 744,390 by 2030.
- Moody’s Analytics forecasts moderate growth, estimating the population will reach 781,000 by 2030.
- COG offers the most optimistic outlook, projecting the population to hit 842,200 by 2030, assuming a steady annual net migration of 7,000 people.
All projections agree that population growth will continue, albeit at a slower pace than seen in the previous decade. The primary driver of growth is expected to be international migration, with natural growth playing a steady role.
Migration Trends in Washington D.C. (2024)
Washington, D.C.’s population dynamics in recent years have been influenced by both international in-migration and domestic out-migration.
While international migration has surged, domestic migration continues to be negative, but the rate of out-migration has slowed since the pandemic.
Migration Type
Net Change (People)
Notes
Domestic Migration
-1,509
While domestic out-migration continues, it has slowed compared to previous years(
International Migration
+6,969
International migration has rebounded strongly post-pandemic, exceeding pre-COVID levels
Net Migration
+5,460
Overall net migration was positive due to international inflows, marking a recovery
1,509 residents left Washington, D.C. for other parts of the U.S. in the latest data period.
This out-migration is largely driven by the high cost of living in the city, especially in terms of housing.
International migration has been a key driver of population growth in Washington, D.C.
In 2023, 6,969 people moved to the city from abroad, marking a robust recovery after the pandemic.
Overall, Washington, D.C. experienced a net gain of 5,460 residents from migration.
Washington D.C. 2024 Year-to-Date Crime Comparison (As of October 8, 2024)
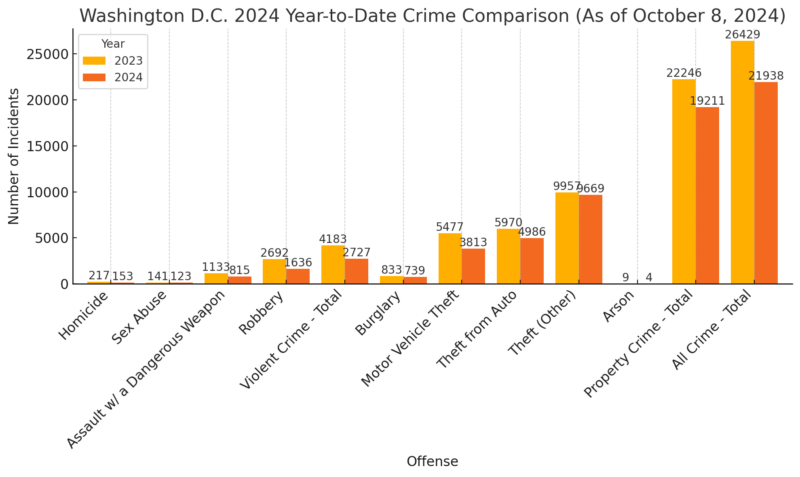
Washington, D.C.’s crime statistics for 2024 show a significant reduction in several key crime categories compared to 2023.
These statistics, while preliminary, indicate a notable decrease in both violent and property crimes according to MPDC.
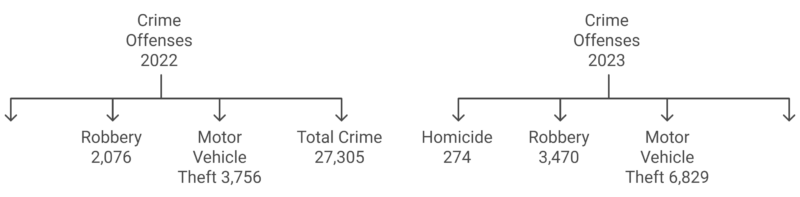
2023 Year-End Crime Data
For comparison, the 2023 year-end data highlighted an increase in crime from the previous year (2022), with significant increases in homicides, robberies, and motor vehicle theft:
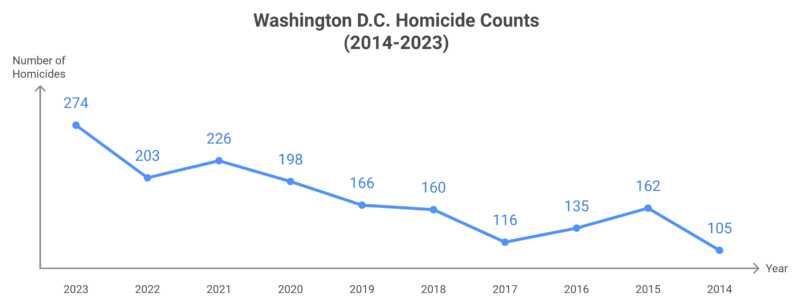
10-Year Homicide Trend
D.C. has seen fluctuations in homicide rates over the past two decades, with a peak of 274 homicides in 2023, compared to just 104 in 2013.
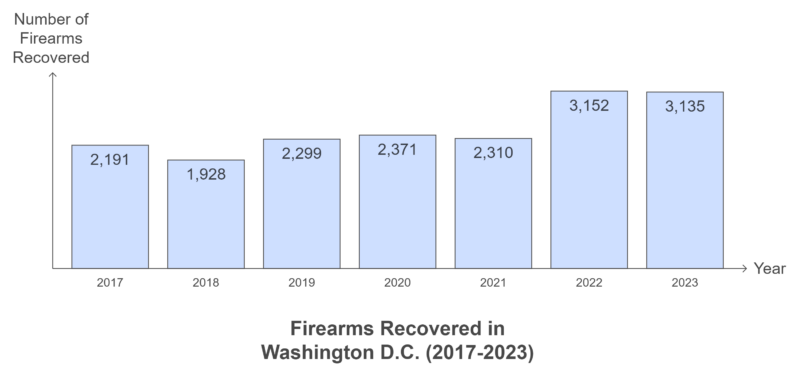
Firearms Recovery
Recovered firearms have also seen a steady increase over the years, with 3,135 firearms recovered in 2023, marking a significant rise compared to earlier years.
Methodology
This analysis was compiled using a combination of historical data, official census reports, and research from trusted institutions such as the U.S. Census Bureau, D.C. Policy Center, and World Population Review.
Migration and demographic patterns were evaluated through data gathered from recent reports, with comparisons drawn between different periods to highlight long-term trends.
The research also incorporated socioeconomic studies to assess the impact of housing, employment, and policy on D.C.’s population.
Conclusion
Washington DC population has undergone significant demographic changes over the past century. The city’s population dynamics have been shaped by various social, economic, and political factors.
From 1920 to 2020, the city has seen periods of both growth and decline. The mid-20th century marked a population peak, which was followed by declines in the 1970s and 1980s. Migration patterns and economic opportunities played crucial roles.
Migration patterns and economic opportunities played crucial roles, as seen in other major cities like New York, where similar trends of population fluctuation and migration shaped urban development.
Recent decades have shown renewed growth. Between 2010 and 2020, the population increased significantly, reflecting DC’s vibrant economy and status as a desirable place to live.
The diversity of DC’s population has also evolved, with shifts in racial and ethnic compositions. This has influenced the cultural and social fabric of the city, making it a more dynamic urban environment.
Further influences on population trends include policies affecting housing, employment, and transportation. These factors continue to shape the evolving landscape of Washington, DC.
Looking ahead, the city’s population trends will likely be influenced by broader national and global patterns. Adaptation and policy adjustments will be key in responding to these changes effectively.
Sources
- Census.gov – District of Columbia
- Macrotrends – Washington DC Metro Area Population 1950-2024
- University Of Michigan – Washington DC-Baltimore, Metropolitan Downtown Area, USA
- Census Reporter – Washington, DC
- DC.gov – Economic Indicators
- DC Office Of Planning – Housing Equity Report | op – DC Office of Planning
- HUDSER.gov – Employment Growth and High Housing Costs in Washington, DC
- Zillow – Washington, DC Housing Market
- Executive Office of The Mayor – 36000 New Homes by 2025
- USA FACTS – ECONOMY OF WASHINGTON DC
- Neighborhood Scout – Washington DC Demographics
- Urban Turf – 740,000 or 840,000? DC’s Varying Ten-Year Population Projections
- Sfuller Institute – Population Change in the Washington Region
- MPDC – District Crime Data at a Glance