
US employers added only 29,000 jobs in September 2026, according to the latest Bureau of Labor Statistics report released on October 2. Hiring was much weaker than the revised 133,000 gain in August and below the average monthly increase of 45,000 over the previous 12 months.
The unemployment rate was 4.2%. It had been 4.1% in August, so the rate technically increased by one tenth of a percentage point, although BLS described the monthly change as small. About 7.1 million people were unemployed in September.
The weak payroll number is only part of the report. Labor force participation increased, household employment rose, wage growth slowed to 3% over the year and earlier payroll estimates were revised lower again.
| September 2026 Measure | Result | August 2026 |
| Nonfarm payroll change | +29,000 | +133,000 revised |
| Unemployment rate | 4.2% | 4.1% |
| Unemployed people | 7.109 million | 7.031 million |
| Labor force participation | 61.8% | 61.6% |
| Employment-population ratio | 59.2% | 59.1% |
| Average hourly earnings | $37.81 | $37.76 |
| Annual wage growth | 3.0% | Not the main monthly measure |
| Average weekly hours | 34.4 | 34.4 |
Methodology
We based the September analysis on two federal labor market surveys. Payroll growth came from employers, while unemployment and labor force measures came from households, so the two sets of figures answer different questions.
- Payroll employment comes from the Current Employment Statistics survey, which covered about 119,000 businesses and government agencies representing roughly 622,000 worksites.
- Unemployment and participation come from the Current Population Survey, conducted by the Census Bureau for BLS across about 60,000 eligible households.
- The 29,000 September job gain is the preliminary nonfarm payroll estimate. BLS will revise it as additional employer reports arrive.
- The 4.2% unemployment rate comes from the household survey and should not be treated as another version of the payroll number.
- Earlier months were checked against revised data. We compared September with updated July and August estimates rather than relying on figures from their first release.
- Our earlier July 2026 jobs analysis provided additional context for how the hiring picture changed through the third quarter.
- Sampling uncertainty also matters. The monthly payroll estimate has a 90% confidence interval of roughly plus or minus 122,000 jobs, which is large relative to the reported September increase.
- We also used the chart bar maker to make some insights easier to understand.
September Hiring Was Far Below The Recent Pace

Payroll employment increased by 29,000 after a revised gain of 133,000 in August and a revised decline of 10,000 in July.
The September number was also below the average monthly increase of 45,000 recorded during the previous 12 months. Looking only at July through September, payrolls increased by an average of about 51,000 jobs per month.
| Month | Payroll Change |
| July 2026 | -10,000 revised |
| August 2026 | +133,000 revised |
| September 2026 | +29,000 preliminary |
| Three-month average | About +51,000 per month |
| Prior 12-month average | +45,000 per month |
August now looks much stronger than the months on either side of it. July moved into negative territory after revision, while September produced little net change.
The labor market therefore does not show a clean month-by-month decline. What it does show is a much slower hiring environment than the one Americans became used to earlier in the post-pandemic expansion.
July Was Revised Into A Job Loss And August Was Cut Again
The September report also made the previous two months look weaker than they did at first.
July was initially reported as a gain of 21,000 jobs. BLS now estimates that employers actually cut 10,000 jobs that month. That is a downward revision of 31,000.
August was also reduced, from an earlier estimate of 162,000 jobs to 133,000. Another 29,000 jobs disappeared from the previous estimate.
- July changed from +21,000 to -10,000.
- August changed from +162,000 to +133,000.
- Total revision removed 60,000 jobs from the two earlier estimates.
The July change is the more important one because it altered the direction of the month entirely. What first looked like weak job growth is now recorded as a small payroll decline.
Revisions are a normal part of the monthly jobs report because more employer responses arrive after the first release. In 2026, however, repeated downward revisions have made the recent hiring slowdown look clearer with each update.
Health Care Added 17,000 Jobs But Growth Slowed
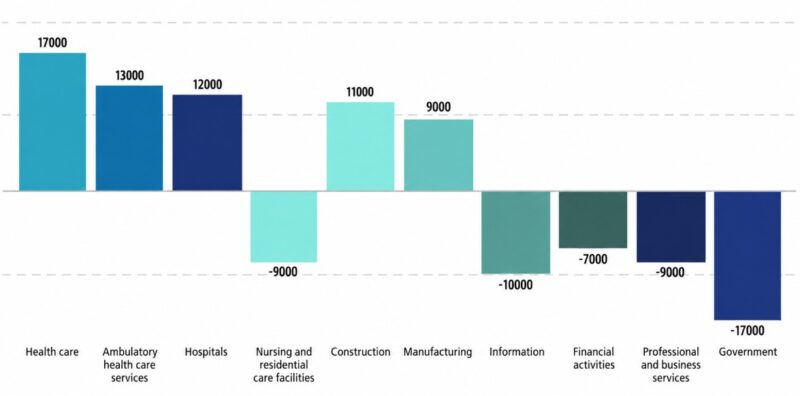
Health care remained one of the few areas with a clear upward trend, adding about 17,000 jobs in September.
Even there, hiring slowed. Health care had added an average of 33,000 jobs per month during the previous 12 months, roughly twice the September increase.
Ambulatory health care services added about 13,000 positions and hospitals added 12,000. Nursing and residential care facilities moved the other way, losing about 9,000 jobs.
| Industry | September Job Change |
| Health care | +17,000 |
| Ambulatory health care services | +13,000 |
| Hospitals | +12,000 |
| Nursing and residential care facilities | -9,000 |
| Construction | +11,000 |
| Manufacturing | +9,000 |
| Information | -10,000 |
| Financial activities | -7,000 |
| Professional and business services | -9,000 |
| Government | -17,000 |
The BLS industry table shows how narrow the month was. Construction and manufacturing posted modest gains, but information, financial activities, professional and business services and government all lost jobs.
Temporary help services fell by about 10,900 jobs. That category can be useful to watch because companies sometimes reduce temporary staffing before making larger changes to permanent payrolls.

The Unemployment Rate Rose To 4.2%
The unemployment rate moved from 4.1% in August to 4.2% in September.
The increase was small, but the underlying household numbers are worth reading together. The number of unemployed people increased by 78,000 to 7.109 million. At the same time, household employment rose by 406,000 and the civilian labor force expanded by 485,000.
| Household Measure | August 2026 | September 2026 | Monthly Change |
| Civilian labor force | 169.777 million | 170.262 million | +485,000 |
| Employed | 162.746 million | 163.152 million | +406,000 |
| Unemployed | 7.031 million | 7.109 million | +78,000 |
| Participation rate | 61.6% | 61.8% | +0.2 points |
| Employment-population ratio | 59.1% | 59.2% | +0.1 points |
A higher unemployment rate alongside higher employment is not contradictory. More people entered or returned to the labor force during the month. Some found work, while others were still looking when the survey was conducted.
The participation rate rose from 61.6% to 61.8%, although it remained below the 62.5% recorded in September 2025.
For readers following local conditions, we also maintain our unemployment rates by state tracker. The national rate can remain fairly steady even when job seekers in individual states face very different labor markets.
Black Unemployment Rose To 7.0% In September

The national 4.2% rate hides large differences among demographic groups.
Unemployment among Black workers increased from 6.0% in August to 7.0% in September. Teen unemployment rose from 14.1% to 14.5%.
Rates for adult men, White workers, Asian workers and Hispanic workers were lower in September than in August, although monthly subgroup estimates can move sharply because they come from smaller samples.
| Group | August 2026 | September 2026 |
| All workers age 16+ | 4.1% | 4.2% |
| Adult men | 4.0% | 3.9% |
| Adult women | 3.5% | 3.6% |
| Teenagers | 14.1% | 14.5% |
| White workers | 3.7% | 3.6% |
| Black workers | 6.0% | 7.0% |
| Asian workers | 3.2% | 2.9% |
| Hispanic or Latino workers | 4.8% | 4.7% |
The figures come from the BLS household survey tables. Month-to-month changes for smaller demographic groups should be treated cautiously because sampling error is larger than it is for the national total.
Long-Term Unemployment Remained At About 1.9 Million
About 1.9 million people had been unemployed for 27 weeks or longer in September.
They accounted for 27.1% of all unemployed people. In other words, more than one in four unemployed workers had already been looking for work for at least half a year.
Another 4.5 million people were working part time for economic reasons. They wanted full-time work but had reduced hours or could find only part-time employment.
| Measure | September 2026 |
| Long-term unemployed | 1.9 million |
| Share of all unemployed | 27.1% |
| Part time for economic reasons | 4.5 million |
| People outside labor force who wanted a job | 5.63 million |
| Marginally attached workers | 1.49 million |
| Discouraged workers | 394,000 |
Those numbers help explain why a 4.2% unemployment rate does not describe every form of labor market weakness. The headline rate counts only people who are actively looking for work and available to take a job.
Wage Growth Slowed To 3.0%

Average hourly earnings for private nonfarm workers increased by five cents in September to $37.81.
That was an increase of only 0.1% for the month. Over the previous 12 months, average hourly earnings rose 3.0%.
Production and nonsupervisory employees earned an average of $32.60 per hour, up seven cents from August.
| Earnings Measure | September 2026 |
| Average hourly earnings | $37.81 |
| Monthly wage increase | 0.1% |
| 12-month wage increase | 3.0% |
| Production and nonsupervisory hourly earnings | $32.60 |
| Average weekly hours | 34.4 |
| Average weekly earnings | $1,300.66 |
The average workweek held at 34.4 hours. Manufacturing employees averaged 40.6 hours, including 3.0 hours of overtime.
Wage growth has slowed from the rates seen during the tighter labor market of earlier years. That reduces one source of inflation pressure, but it also means paychecks are growing more slowly at a time when household costs remain elevated.
Private Employers Added More Jobs Than The Headline Suggests
The overall 29,000 payroll increase includes both private employers and government.
Private payrolls actually increased by 46,000 in September. Government employment fell by 17,000, bringing total nonfarm growth down to 29,000.
| Payroll Category | September Change |
| Total nonfarm | +29,000 |
| Total private | +46,000 |
| Goods-producing | +18,000 |
| Private service-providing | +28,000 |
| Government | -17,000 |
Private hiring was still weak by historical standards, but the split explains why the headline number was lower than the private-sector gain.
The employment diffusion index also fell below 50. BLS reported a reading of 49.0 across 250 private industries. A reading of 50 represents an equal balance between industries adding and losing jobs, so September was slightly tilted toward contraction.
The Bottom Line
The next BLS Employment Situation report is scheduled for November 6, 2026.
- October payroll growth will help confirm if hiring remained weak after September.
- Labor force participation is worth watching after rising to 61.8%.
- Health care hiring will indicate if the recent slowdown continues.
- Wage growth could move below the current 3.0% annual pace.
- Long-term unemployment remains important as more workers spend six months or longer without a job.
For now, the labor market looks less like one experiencing mass job losses and more like one where companies have become increasingly reluctant to hire.