
As of 2025, Florida’s population is estimated to have reached about 22,975,900, reflecting a decade of steady growth that aligns with recent projections according to World Population Review.
But according to some other sources it already surpassed 23 mil.
1. Age Distribution
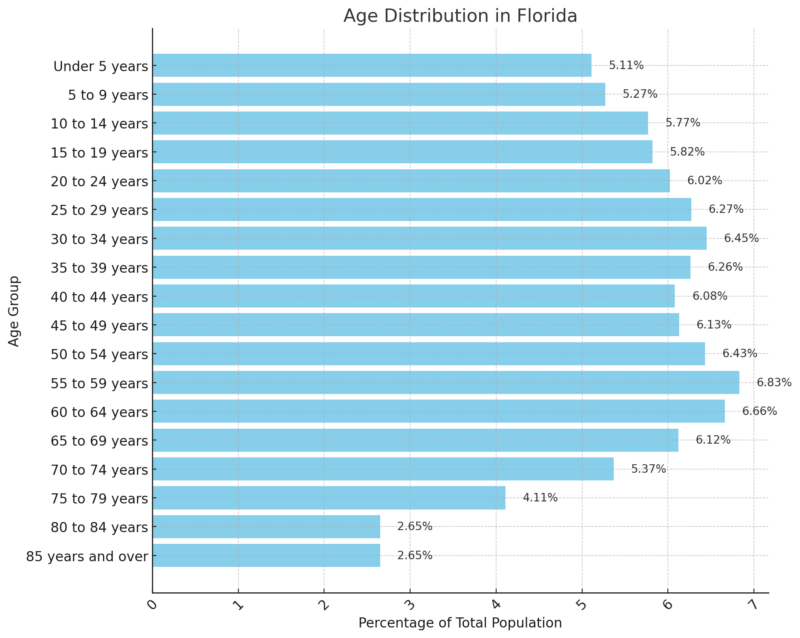
The age distribution in Florida reveals a median age of 42.4 years, highlighting an older-than-average population compared to many other U.S. states according to Neilsberg.
Younger residents (under 15) make up 16.15% of the population, showing a smaller youth base.
The 15 to 29 age group accounts for 18.11%, while a large portion, 44.84%, falls within the 30 to 64 age range, indicating a strong representation in the workforce and middle-aged adults.
Notably, Florida’s population aged 65 and older is substantial, comprising 20.9% (18.25% for ages 65 to 84 and 2.65% for those 85 and older).
This demographic concentration aligns with Florida’s status as a popular retirement destination, underscoring the state’s appeal to older adults and retirees.
2. Dependency Ratios
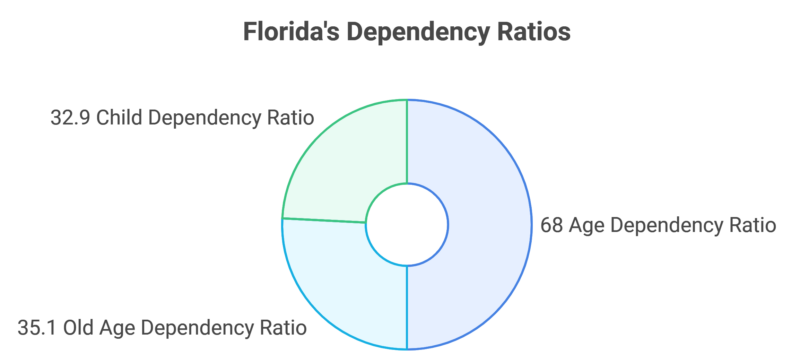
The age dependency ratio of 68 highlights a high proportion of dependents relative to the working-age population, driven in part by an old-age dependency ratio of 35.1.
This means a substantial number of older adults depend on the working-age population, putting a strain on economic resources.
The child dependency ratio of 32.9 suggests a lower, but still notable, proportion of youth dependents.
3. Gender Distribution
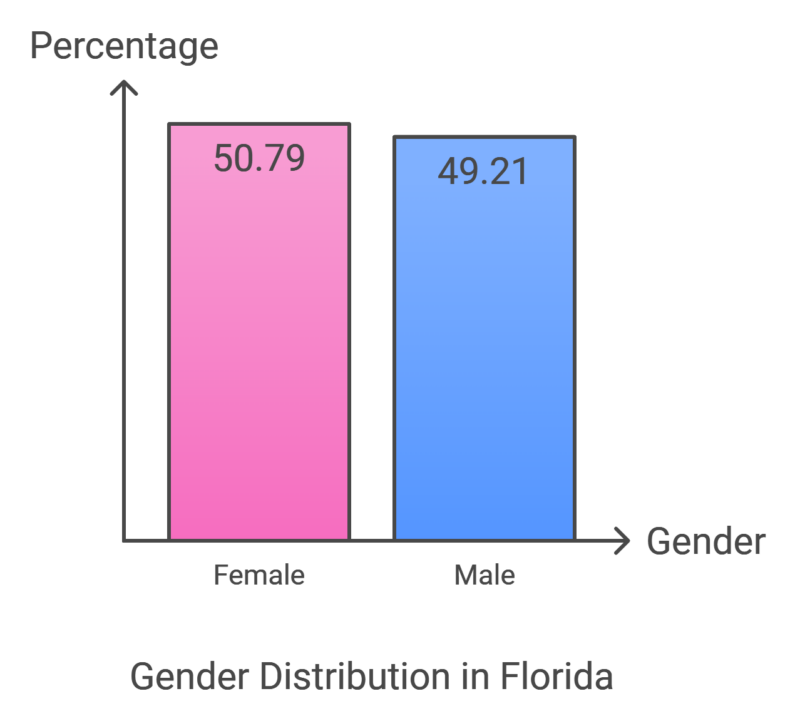
Florida’s population is almost evenly split by gender, with a slight majority of females (50.79%).
This minor gender imbalance is common in aging populations, as females tend to have a higher life expectancy, which likely contributes to the higher median age among females compared to males.
This distribution may influence healthcare and social services, given the unique needs of an aging female population.
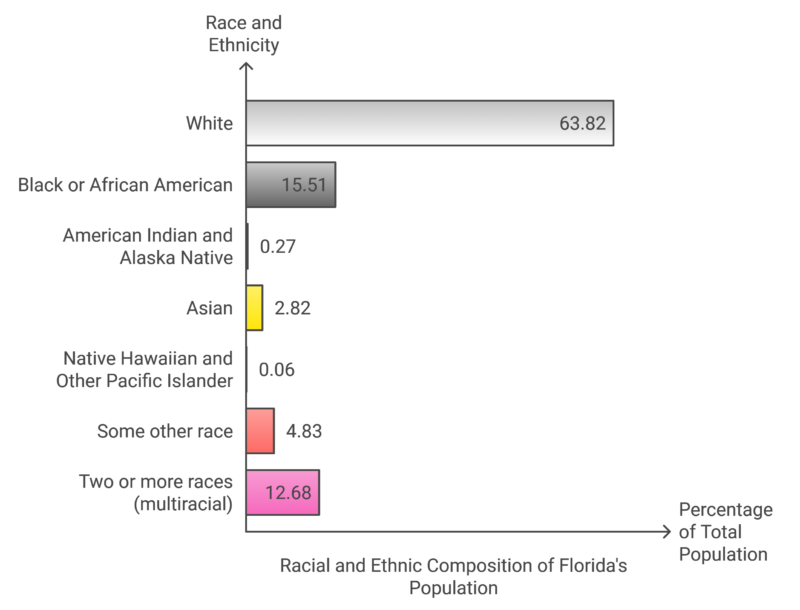
4. Ethnic and Racial Composition
6. Employment Rates

Job Openings and Labor Turnover for Florida (Seasonally Adjusted, in Thousands)
Estimate
July 2023
April 2024
May 2024
June 2024
July 2024 (p)
Change from June 2024 to July 2024 (p)
Job Openings
572
508
498
504
513
+9
Hires
399
404
372
369
354
-15
Total Separations
367
384
358
298
372
+74
Quits
271
290
206
205
268
+63
Layoffs & Discharges
80
74
134
80
94
+14
In July 2024, job openings in Florida rose by 9,000 from the previous month, indicating steady labor demand. However, hires decreased by 15,000, potentially reflecting hiring slowdowns or challenges in finding qualified candidates according to BLS.
In July 2024, Florida boasted the lowest statewide unemployment rate of the top 10 largest states in the nation. We added over 200,000 private sector jobs over-the-year in Florida, far outpacing the national rate of job creation. And, for the 45th month in a row, Florida’s… pic.twitter.com/IybET0FtQm
— Ron DeSantis (@GovRonDeSantis) August 16, 2024
Separations saw a significant increase (+74,000), driven primarily by an increase in quits (+63,000), which may suggest rising voluntary turnover as workers seek better opportunities or conditions. Layoffs and discharges also increased by 14,000, signaling potential instability in certain industries.
Job Openings and Labor Turnover Rates for Florida (Seasonally Adjusted, in Percent)
Estimate
July 2023
April 2024
May 2024
June 2024
July 2024 (p)
Change from June 2024 to July 2024 (p)
Job Openings Rate
5.5%
4.9%
4.8%
4.8%
4.9%
+0.1%
Hires Rate
4.1%
4.1%
3.7%
3.7%
3.5%
-0.2%
Total Separations Rate
3.8%
3.9%
3.6%
3.0%
3.7%
+0.7%
Quits Rate
2.8%
2.9%
2.1%
2.1%
2.7%
+0.6%
Layoffs & Discharges Rate
0.8%
0.7%
1.3%
0.8%
0.9%
+0.1%
The job openings rate in Florida slightly increased from 4.8% to 4.9% in July, indicating continued demand for workers.
The hires rate dropped by 0.2%, aligning with the observed decline in hires, while the total separations rate rose by 0.7%, with significant increases in both the quits and layoffs/discharges rates.
The rise in the quits rate to 2.7% suggests greater confidence among workers to voluntarily leave positions, while the increase in layoffs and discharges rate may signal restructuring or economic adjustments in some sectors.
7. Florida Income Statistics (Households and Individuals)
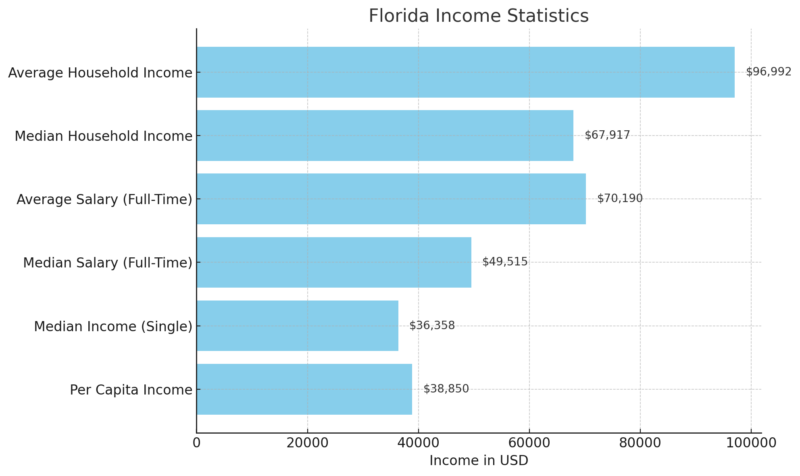
Florida’s average household income and median household income are slightly lower than the national averages, reflecting economic conditions that may vary from other parts of the U.S.
While full-time workers in Florida have a relatively high average salary of $70,190, individual incomes for single households are generally lower, aligning with a slightly lower cost of living in some parts of the state according to incomebyzipcode.
Richest Zip Codes in Florida (2025)
Rank
Zip Code
Population
Mean Income
Median Household Income
1
33109
792
$900,203
$250,001
2
33480
10,853
$333,795
$163,929
3
33158
6,536
$284,824
$177,917
4
33149
14,639
$264,439
$169,792
5
32963
15,117
$248,440
$143,438
6
34102
10,767
$243,094
$111,742
7
33156
32,582
$231,573
$133,862
8
34228
7,479
$226,348
$141,250
9
33629
26,625
$223,527
$152,044
10
34103
11,214
$223,130
$99,615
The wealthiest zip codes in Florida, led by 33109, showcase significant income levels with mean incomes above $200,000 across the top ten.
This reflects concentrated wealth, often in coastal or high-demand urban areas, where luxury housing and exclusive communities contribute to high average and median incomes.
Florida Family and Retirement Income
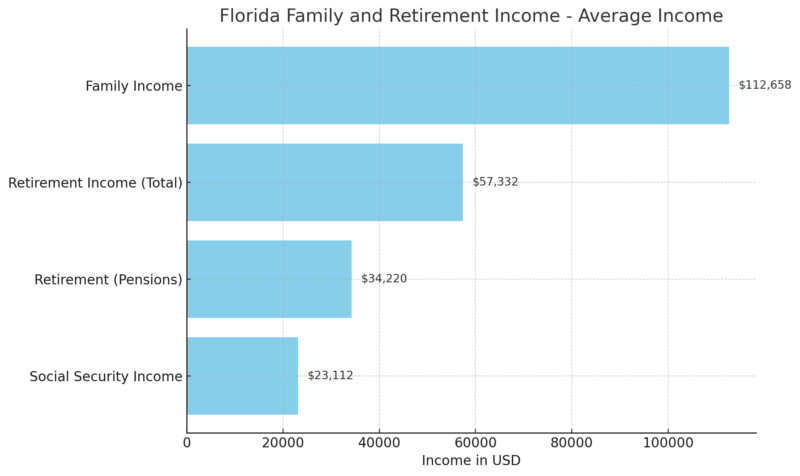
Family incomes are generally higher than individual or single-person incomes, with family households averaging $112,658. Retirement income averages $57,332, showing reliance on both pensions and Social Security for retired individuals. This dual income is essential to meet cost-of-living demands in Florida, especially in areas with rising housing costs.
Florida Income Distribution (by Household Income Level)
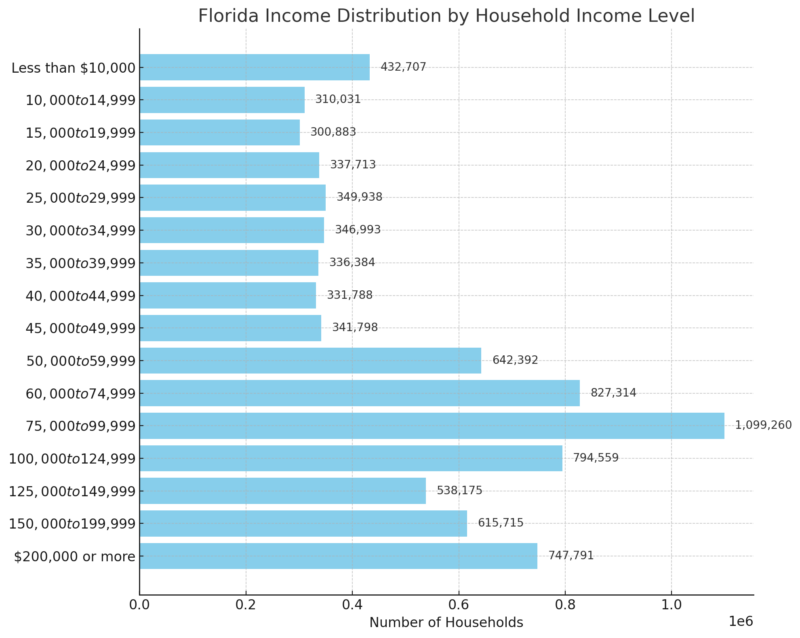
Florida’s income distribution is relatively spread out, with the largest share (13%) of households earning between $75,000 and $99,999.
Higher income brackets (over $200,000) represent 9% of households, showing that a substantial portion of Floridians fall into middle-income ranges.
This distribution suggests economic diversity, with a mix of low-, middle-, and high-income households across the state.
Median Income by Age of Householder in Florida
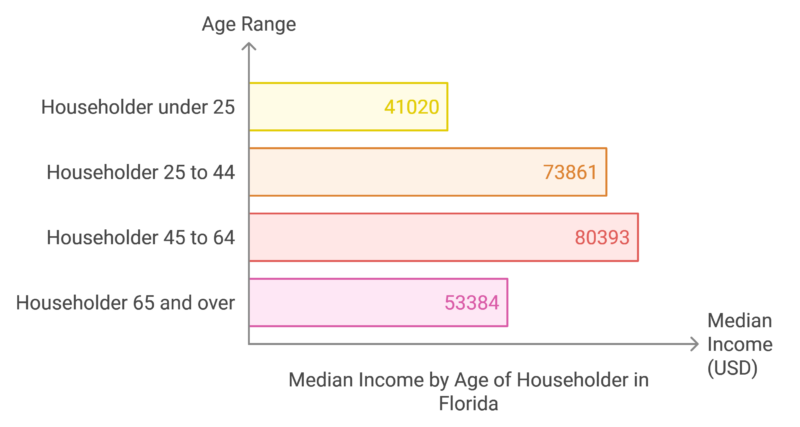
Median incomes in Florida vary significantly by age, with younger householders (under 25) earning less on average, likely due to entry-level jobs. Income peaks for householders aged 45 to 64, aligning with career advancement and higher earning potential.
For those aged 65 and over, the median income decreases to $53,384, reflecting retirement income and the shift away from active employment. This income trend by age is typical, as earnings tend to peak in mid-career and decline in retirement.
8. Education Levels
Metric
2023
2024
Change
Schools earning “A” or “B”
57% (1,961 schools)
64% (2,196 schools)
+7 percentage points
Schools earning “D” or “F”
6% (211 schools)
Less than 4% (113 schools)
-2 percentage points
Schools increasing grade or maintaining an “A”
N/A
1,761 schools (53%)
N/A
Elementary schools earning an “A”
N/A
Increased by 4%
+4 percentage points
Middle schools earning an “A”
N/A
Increased by 7%
+7 percentage points
High schools earning an “A”
N/A
Increased by 10%
+10 percentage points
Combination schools earning an “A”
N/A
Increased by 7%
+7 percentage points
Charter schools earning “A” or “B”
N/A
69% of 602 schools
N/A
FLDOE notes that The 2024 school grades reflect notable improvements across Florida schools, with a 7% increase in schools achieving top grades (“A” or “B”) and a reduction in schools with lower grades (“D” or “F”).
The performance improvements span elementary, middle, and high schools, with high schools showing the most substantial increase in “A” grades (+10 percentage points). Charter schools also saw strong performance, with 69% earning “A” or “B” grades. This trend suggests positive responses to the state’s educational policies and grading adjustments.
2024 School Grading Scale by School Type
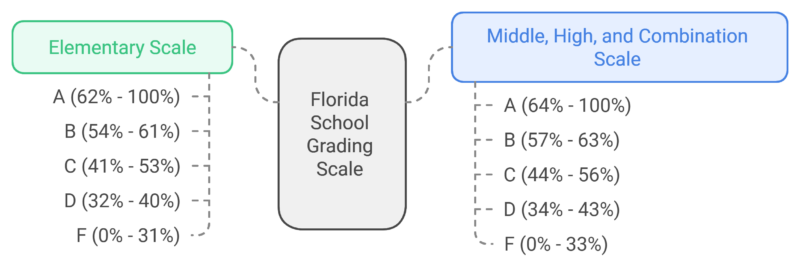
The updated grading scale considers variations across school types, using a slightly higher threshold for middle, high, and combination schools to achieve each grade level.
This nuanced approach aims to provide a more accurate reflection of school performance based on the specific components assessed in different school types, ensuring that grade assignments are appropriate for the educational context of each school.
9. Health Statistics
Population, Income, and Health Coverage in Florida
Category
Florida Value
U.S. Average
Population (2023)
22,975,900
–
Below 200% FPL (2023)
29.5%
28.2%
Uninsured Population (2023)
2,357,500 (10.7%)
8.0%
Immigrant Share of Population
22.3%
14.5%
Noncitizen Immigrants
9.6%
6.9%
Adults with Medical Debt (2019-21)
1,500,000 (8.7%)
8.6%
Florida has a relatively high uninsured rate of 10.7%, surpassing the national average of 8.0%, which reflects coverage challenges for lower-income residents. Florida also has a significant immigrant population (22.3%), influencing healthcare accessibility and needs as per KFF.
Medical debt affects 8.7% of adults in Florida, mirroring national levels but highlighting ongoing financial strain related to healthcare expenses.
Tracking deaths and death rates is essential for understanding trends and identifying prevention strategies for those most at risk.
In 2022, Alachua County had an age-adjusted death rate from all causes of 767.4 per 100,000 people, slightly higher than the state average of 738.1 per 100,000 in Florida.
The data includes all ages, using an upper age limit of 999 to capture the oldest individuals.
The accompanying map uses quartiles to display county data visually, a method applied when there is data available for at least 51 counties.
Medicaid and CHIP in Florida
Metric
Florida
U.S. Average
Medicaid & CHIP Enrollment (Jun 2024)
3.8 million
–
Medicaid Spending (2022)
$34.6 billion
–
Federal Share of Medicaid Costs
65.2%
–
Medicaid & CHIP Eligibility Limits (% FPL)
– Parents (Family of 3)
27.0%
138.0%
– Other Adults
0.0%
138.0%
– Pregnant Women
N/A
214.0%
– Children
215.0%
255.0%
Florida’s Medicaid eligibility thresholds are significantly lower than national averages, especially for adults, with no coverage for non-disabled, non-elderly adults.
Despite having 3.8 million enrollees, these strict eligibility limits leave many low-income individuals without access to Medicaid, increasing uninsured rates.
The federal government’s contribution to Medicaid costs in Florida (65.2%) alleviates some state expenses, but the gap in coverage due to limited eligibility remains a concern.
ACA Marketplace Coverage in Florida (2025)
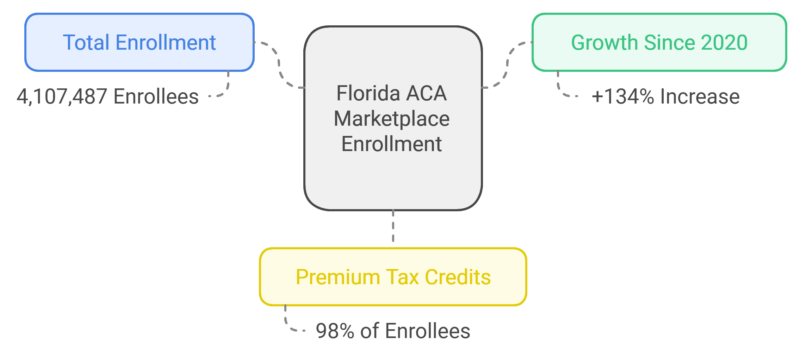
The ACA Marketplace has become a vital source of coverage in Florida, with enrollment growing by 134% since 2020.
Nearly all enrollees benefit from premium tax credits, underscoring the importance of financial assistance for affordability.
This high level of enrollment demonstrates Florida’s reliance on the ACA Marketplace for bridging gaps in coverage, especially given the state’s lower Medicaid eligibility.
Employer-Sponsored Insurance in Florida
Metric
Florida
U.S. Average
Average Annual Premium (Family Coverage, 2023)
$23,597
–
Average Deductible (Family Coverage, 2023)
$3,751
$3,811
Employer-sponsored insurance is a significant source of coverage in Florida, yet the average premium for family coverage is high at $23,597, potentially straining household budgets. Florida’s average deductible of $3,751 is slightly below the national average but still substantial.
These costs highlight the financial burden of private insurance, especially for families who may face additional healthcare-related expenses.
Medicare and Part D in Florida
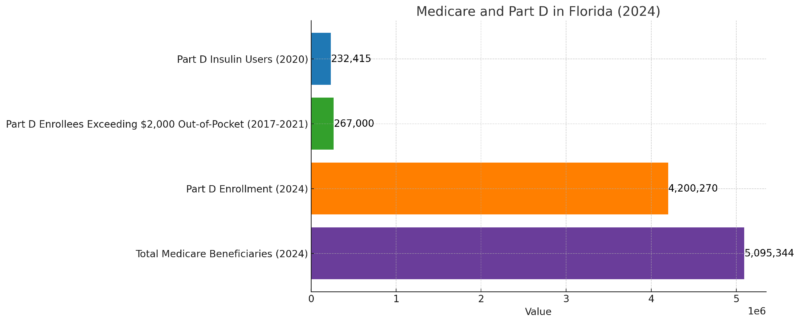
Florida has one of the largest Medicare populations in the U.S., with over 5 million beneficiaries. Part D enrollment is high, with significant out-of-pocket expenses for prescription drugs, as seen in the 267,000 enrollees who exceeded $2,000 annually.
The $35 monthly cap on insulin under the Inflation Reduction Act provides important cost relief for the 232,415 insulin users in Florida, addressing one of the most common medication expenses for Medicare beneficiaries.
10. Migration Patterns

According to the Florida Chamber Foundation, the state expects an influx of 225,000 to 275,000 new residents in 2024. This is largely due to its desirable climate, no state income tax, and favorable job market.
Major metropolitan areas in Florida, including Lakeland-Winter Haven and Port St. Lucie, rank among the fastest-growing in the country. People relocating from other states seek a better quality of life and lower living costs, prompting urban expansion. This migration drives the demand for housing and infrastructure, presenting both opportunities and challenges for urban planning.
Methodology
This article was crafted by analyzing and synthesizing data from multiple reputable sources, including census reports, healthcare surveys, economic analyses, and demographic projections. Primary sources included the U.S. Census Bureau for population and demographic insights, the Kaiser Family Foundation (KFF) for health coverage and Medicaid data, and the Bureau of Labor Statistics (BLS) for employment rates. Education statistics and affordability metrics were referenced from U.S. News rankings and the Florida Department of Education.
We aimed to present Florida’s current population, health, economic, and social data in a balanced, fact-based manner. Data points were selected based on their relevance to recent trends and projections, focusing on population growth, healthcare coverage, employment, and income distribution.
Where available, the latest data from 2023-2025 was prioritized to provide a current perspective. The article is organized to offer insights by theme, with summaries and key takeaways to assist readers in navigating complex demographic and socioeconomic information.
References
- World Population Review – Florida Population 2024
- Census.gov – Florida
- Neilsberg – Median Age Florida, Population By Race
- BLS – Florida Job Openings
- Inomebyzipcode – Florida Income Statistics for 2024
- Fldoe.org – Florida Department of Education Announces 2024 School Grades Under New School Grading Scale
- US News – Yes, Florida Is No. 1 in the Country for Education. Here’s Why.
- KFF – Health Care in Florida
- Flchamber – Breaking Down Migration In and Out of Florida