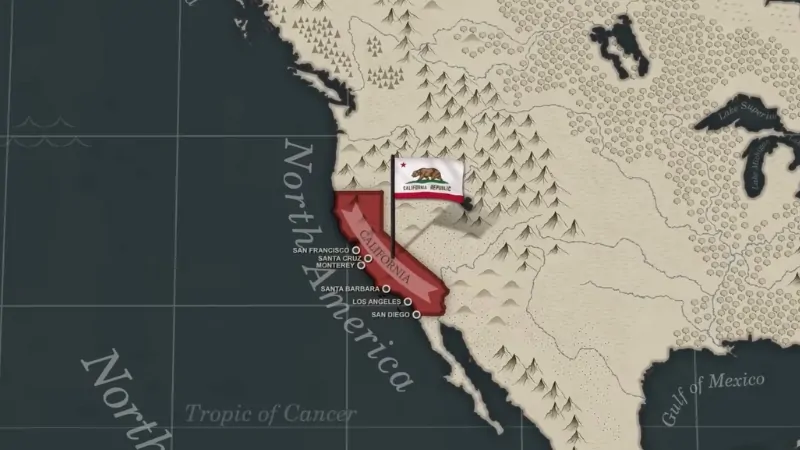
California, the third-largest state in the U.S., is located on the West Coast, with the Pacific Ocean to the west and neighboring Oregon, Nevada, and Arizona.
To the south, it shares a border with Mexico.
The U.S. acquired the region from Mexico in 1848, and its boundaries have largely remained the same since then.
Unlike many other states, California was never officially organized as a U.S. territory. Instead, it was governed by a federal military authority from 1848 until it achieved statehood.
On September 9, 1850, California was admitted to the Union as the 31st state with the capital city of Sacramento and the biggest city of Los Angeles.
Table of Contents
ToggleCalifornia State Map and Satelite View
California, the third-largest U.S. state, spans approximately 155,858 square miles along the country’s western edge.
It is bordered by the Pacific Ocean to the west, Oregon to the north, Nevada and Arizona to the east, and Mexico to the south.
Known for its diverse geography, California features over 840 miles of coastline, fertile valleys, rugged mountains, and arid deserts.
The Sierra Nevada range in the east is home to Mount Whitney, the highest peak in the contiguous U.S. at 14,505 feet.
In contrast, Death Valley, one of the hottest places on Earth, lies 282 feet below sea level.
The Central Valley is a global agricultural powerhouse, while the state’s varied climate supports ecosystems ranging from Mediterranean to alpine.
Geography Map
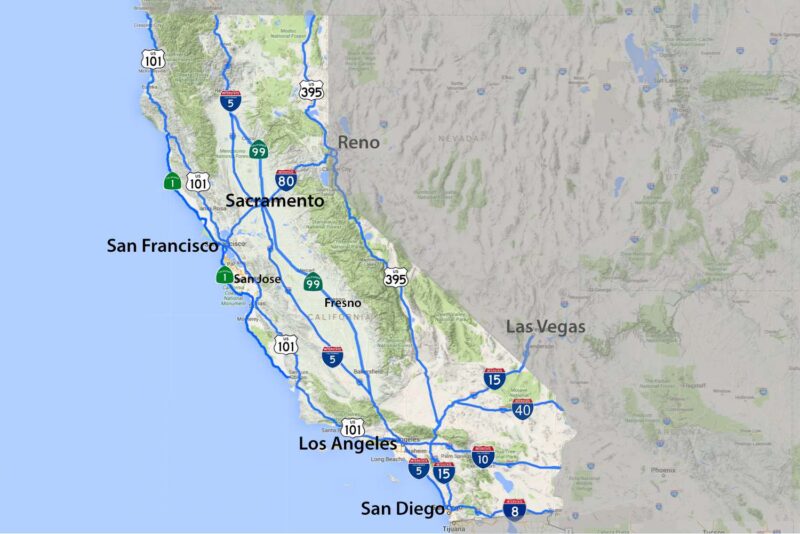
California, covering 163,696 square miles (423,970 km²), is the third-largest U.S. state, following Alaska and Texas.
It is geographically diverse and typically divided into two main regions: Northern California (48 counties) and Southern California (10 counties).
The state is bordered by Oregon to the north, Nevada and Arizona to the east, the Pacific Ocean to the west, and Mexico’s Baja California to the south.
California Central Valley
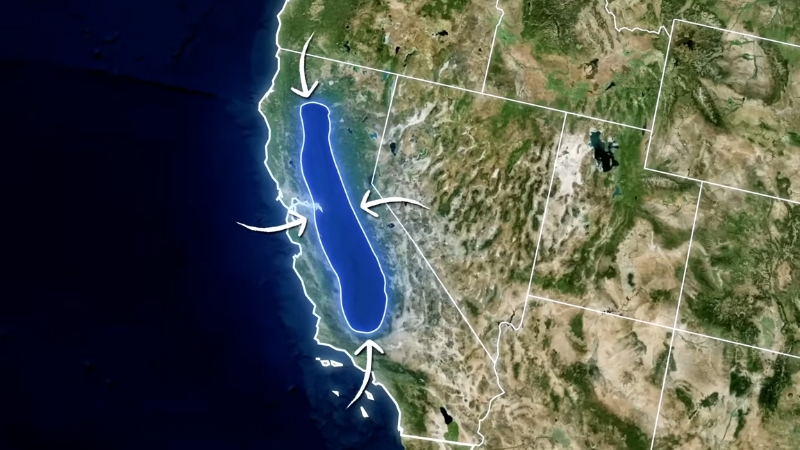
The Central Valley, located in the heart of California, is flanked by the Sierra Nevada to the east, coastal mountain ranges to the west, the Cascade Range to the north, and the Tehachapi Mountains to the south.
It is divided into the Sacramento Valley (north) and San Joaquin Valley (south), named after their respective rivers.
The valley is vital for agriculture, and water is diverted through the Sacramento-San Joaquin Delta to supply nearly 23 million people.
Major Mountain Ranges and Peaks
The Sierra Nevada range contains Mount Whitney, the tallest peak in the contiguous U.S. at 14,505 feet. It is also home to Yosemite Valley and Sequoia National Park, which boasts the largest living trees, the giant sequoias.
Glaciers and alpine features dominate its higher elevations. In the west, Clear Lake is the largest entirely California-based freshwater lake, while Lake Tahoe, shared with Nevada, is the largest by volume.
Deserts and Valleys
The Mojave Desert in the south includes Death Valley, the hottest and lowest place in North America, with Badwater Basin sitting 279 feet below sea level.
Owens Valley and Mono Lake in the eastern Sierra Nevada serve as critical habitats.
The Salton Sea, a large inland saltwater lake, lies in the Colorado Desert.
Forests and Ecology
About 45% of California is covered by forests, with unmatched diversity in pine species.
The White Mountains host ancient bristlecone pines over 5,000 years old. Diverse ecosystems range from desert plants like Joshua trees to alpine flora in the Arctic zones of high elevations.
Volcanic Activity and Earthquakes
California is part of the Pacific Ring of Fire and experiences frequent earthquakes, with over 37,000 recorded annually.
Notable fault lines include the San Andreas Fault. Volcanoes, such as Mount Shasta, pose potential risks. Natural disasters like wildfires, landslides, and droughts are also common.
Regions of California
Region
Sub-Regions
Shasta Cascade
Klamath Basin, Modoc Plateau
North Coast
Lost Coast
Bay Area
North Bay, San Francisco Peninsula, South Bay (Santa Clara Valley), East Bay
Central Valley
Sacramento Valley, Greater Sacramento, San Joaquin Valley, Metropolitan Fresno, California Delta
Sierra Nevada
Gold Country, Eastern Sierra
Central Coast
Monterey Bay Area, Big Sur, Gaviota Coast
Southern California
Greater Los Angeles (Antelope Valley, Los Angeles Basin, San Fernando Valley, San Gabriel Valley, Santa Clarita Valley), Channel Islands, Orange Coast, Inland Empire, San Diego–Tijuana
California Deserts
Mojave Desert, Great Basin Desert, Colorado Desert (Sonoran Desert), Calexico–Mexicali
Climate of California
California has a Mediterranean climate where the state sees little to no rain for several months in the summer. Completely normal. pic.twitter.com/tizx7xy2bO
— Colin McCarthy (@US_Stormwatch) August 27, 2024
California has a Mediterranean climate, with cool, foggy coastal summers and hot inland regions. Northern areas receive more rain, while southern areas are arid. The Sierra Nevada creates alpine climates, with snowfall in winter.
Coastal areas, such as San Francisco and San Diego, are cooler in summer compared to inland cities like Fresno and Sacramento. Death Valley holds the world’s record for the highest temperature, at 134 °F (56.7 °C), while the state’s lowest was −45 °F (−43 °C) in Boca.
Location
August (°F)
August (°C)
January (°F)
January (°C)
Annual Precipitation (mm/in)
Los Angeles
83/64
29/18
66/48
20/8
377/15
LAX/LA Beaches
75/64
23/18
65/49
18/9
326/13
San Diego
76/67
24/19
65/49
18/9
262/10
San Jose
82/58
27/14
58/42
14/5
401/16
San Francisco
67/54
20/12
56/46
14/8
538/21
Fresno
97/66
34/19
55/38
12/3
292/11
Sacramento
91/58
33/14
54/39
12/3
469/18
Oakland
73/58
23/14
58/44
14/7
588/23
Bakersfield
96/69
36/21
56/39
13/3
165/7
Riverside
94/60
35/18
67/39
19/4
260/10
Eureka
62/53
16/11
54/41
12/5
960/38
Death Valley
115/86
46/30
67/40
19/4
60/2
Mammoth Lakes
77/45
25/7
40/15
4/-9
583/23
Ecology and Wildlife
California’s ecological diversity supports endemic species, including the giant sequoia and Catalina ironwood.
Six life zones, ranging from deserts to alpine regions, host unique plant and animal species. Wildlife includes black bears, cougars, California condors, and aquatic species such as salmon.
However, urbanization and invasive species threaten many habitats, with over 300 plant and animal species listed as endangered or threatened.
Rivers and Water Systems
The Sacramento and San Joaquin Rivers form California’s largest river system, vital for agriculture and water supply.
The delta they form flows into San Francisco Bay and the Pacific Ocean.
Other key rivers include the Colorado River along the southeast border and the Klamath and Trinity Rivers in the north. Many rivers are dammed to support water projects that distribute resources across the state.
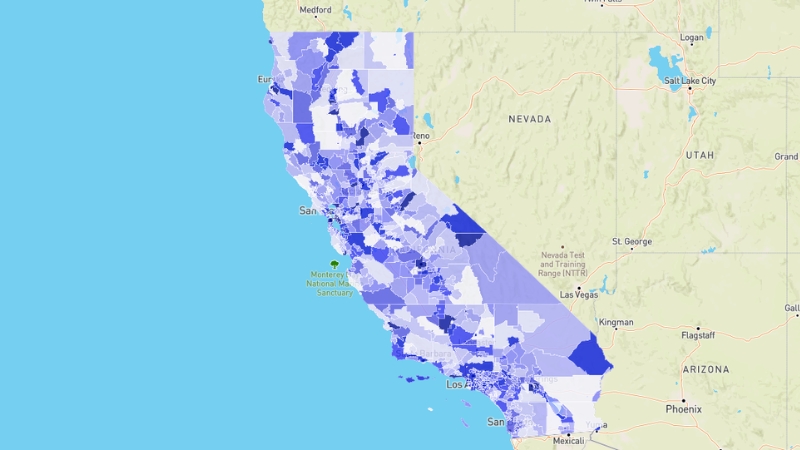
Population Heat Map
California, a vast and diverse state on the U.S. West Coast, is home to one of the most varied populations in the world.
According to the 2020 U.S. Census, California’s population stood at 39,538,223, making it the most populous state by a significant margin over Texas, which has about 29 million people.
But in 2024 it slightly decreased to 39,431,263 according to the official Census.
A large portion of California’s population resides in major cities.
The state is home to the country’s second-largest city, Los Angeles, and three of the nation’s ten largest cities (Los Angeles, San Diego, and San Jose). It also contains the most populous county, Los Angeles County.
By 2030, California’s population is expected to exceed 42 million, although recent declines in growth may affect this projection.
California is the third-largest state by area, resulting in a population density of 251.3 people per square mile, placing it 11th among U.S. states in terms of density.
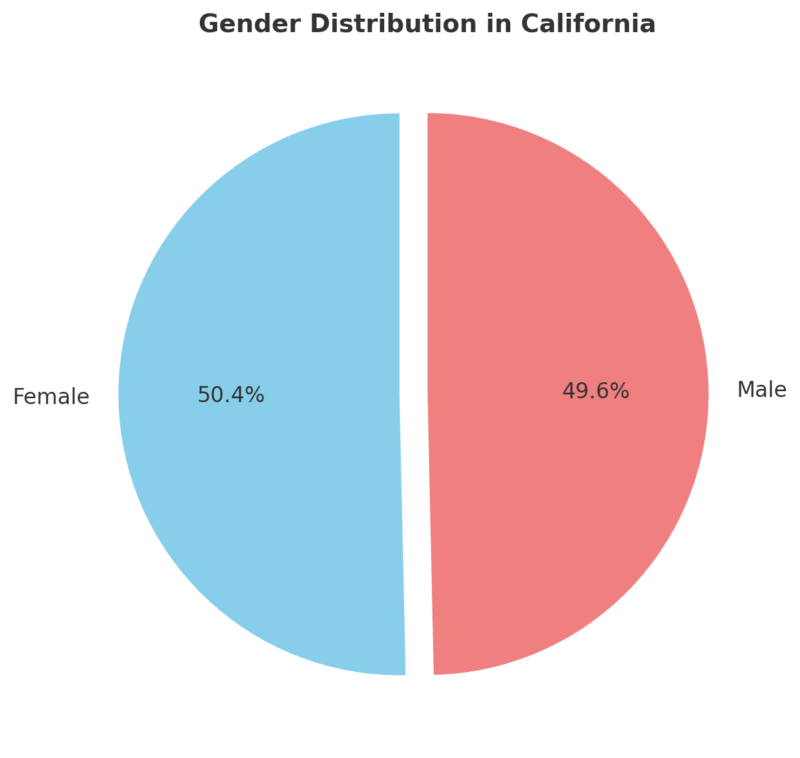
The median age in California is 36 years, with a nearly even gender split: 50.3% female and 49.6% male.
Religiously, 63% of Californians identify with a Christian faith, 9% with non-Christian religions, and 27% are unaffiliated.
California has a robust natural growth rate, with births significantly outnumbering deaths. Between 2000 and 2009, the state recorded 5,058,440 births and 2,179,958 deaths, leading to a natural increase of 3,090,016 people. Immigration also plays a significant role in California’s population, with the state attracting people since the Gold Rush.
From 2000 to 2009, California experienced a net migration gain of 306,925. It is estimated that around 6.3% of California’s residents are undocumented immigrants.
California is not only larger than all but 35 countries globally but is also the second most populous subnational entity in the world, following only Sao Paulo in Brazil.
Largest Cities in CA
City
Rank
2020 Population
2023 Population
Density (per sq mi)
Area (sq mi)
Growth Rate
Type
Los Angeles
1
3,795,936
3,822,782
8,068
470.5
-0.65%
City
San Diego
2
1,388,996
1,387,378
4,260
326.1
0.05%
City
San Jose
3
956,433
972,082
5,375
177.9
-1.36%
City
San Francisco
4
788,478
807,774
16,884
46.7
-2.54%
City
Fresno
5
546,718
545,253
4,720
115.8
0.18%
City
Sacramento
6
526,669
525,297
5,339
98.6
0.05%
City
Long Beach
7
444,095
452,931
8,764
50.7
-1.2%
City
Oakland
8
435,024
434,568
7,773
56.0
-0.34%
City
Bakersfield
9
416,081
412,269
2,769
150.3
0.65%
City
Anaheim
10
338,463
342,777
6,731
50.3
-0.6%
City
California’s ten most populous cities reflect the state’s urban diversity and population density.
Los Angeles leads with a population of over 3,795,936, though it has seen a slight decline in recent years. San Diego and San Jose follow, with densities of 4,260 and 5,375 people per square mile, respectively.
While some cities like Bakersfield and Fresno show modest growth, others, including San Francisco and Long Beach, have experienced population declines.
California Counties
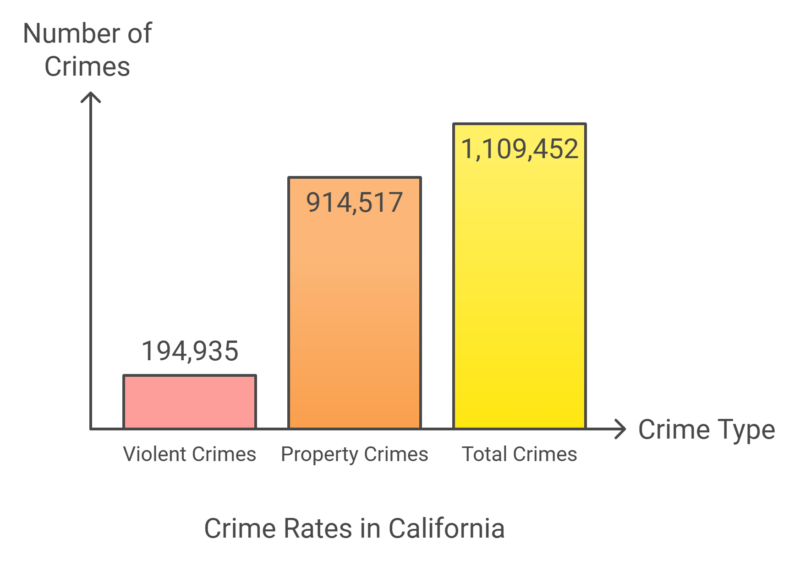
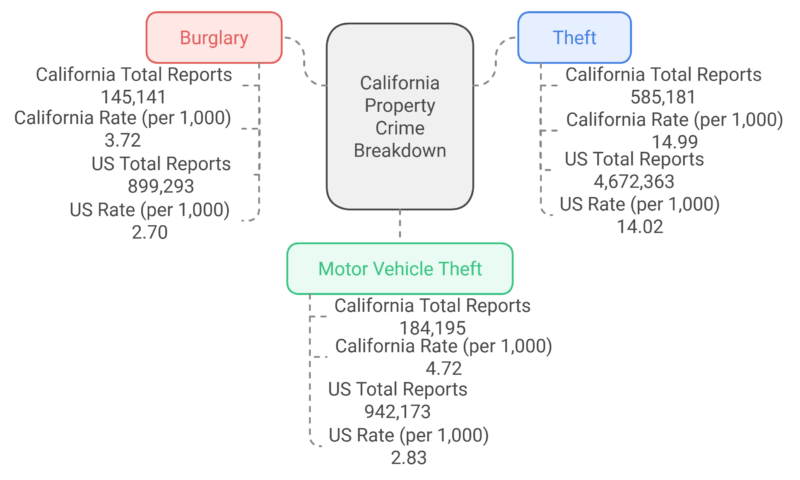
California’s largest county, Los Angeles County, leads the state and nation with a population of 10.15 million, growing by 3.32% since the last census. Other large counties include San Diego (3.34 million, 7.8% growth) and Orange (3.19 million, 6% growth). At the opposite end, Alpine County is the smallest with 1,120 residents, having declined by 4.7%. Small counties like Sierra, Modoc, and Trinity also show negative growth, though San Benito County stands out with a 6.85% increase. Alameda County saw the highest growth rate at 10.1%, likely due to its location near San Francisco, which also grew by 8.73%. Conversely, Lassen County experienced the steepest decline, dropping 10.7% in population. Los Angeles County has the highest number of major airports in California, including Los Angeles International Airport (LAX), Hollywood Burbank Airport (BUR), Long Beach Airport (LGB), and Ontario International Airport (ONT). These airports collectively serve millions of passengers each year, making Los Angeles County a central hub for both domestic and international flights in the state. California has a total crime rate of 28.43 crimes per 1,000 residents, with property crimes accounting for the majority at 23.43 per 1,000 according to Neighborhood Scout. Violent crimes are less frequent, with a rate of 4.99 per 1,000 residents. This suggests a higher likelihood of being a victim of property crimes compared to violent crimes in the state. While California’s murder rate aligns with the national average (0.06 per 1,000), its robbery and assault rates are higher than the national average, suggesting a greater prevalence of certain violent crimes. However, the state’s rape rate is slightly lower than the national figure. California experiences higher rates of burglary and motor vehicle theft compared to the national average. The state’s theft rate is slightly above the national average, indicating property crimes are a significant issue in the state. Crimes per square mile in California are higher than the national average due to its dense urban centers like Los Angeles, San Francisco, and San Diego, which experience higher crime rates compared to rural areas.
County
Population
% Change
Area (sq mi)
Population Density
Los Angeles County
9,606,925
-3.86%
1,600
2,366
San Diego County
3,262,770
-0.99%
1,600
775
Orange County
3,121,138
-2.03%
306
3,936
Riverside County
2,510,643
3.62%
2,800
348
San Bernardino County
2,196,314
0.59%
7,700
109
Santa Clara County
1,876,849
-2.81%
498
1,454
Alameda County
1,616,117
-3.83%
284
2,193
Sacramento County
1,584,196
-0.15%
372
1,642
Contra Costa County
1,153,031
-1.12%
277
1,608
Fresno County
1,018,965
0.93%
2,300
171
Kern County
910,889
0.55%
3,100
112
Ventura County
826,309
-2.02%
711
449
San Francisco County
810,202
-6.93%
18
17,238
San Joaquin County
807,637
3.46%
537
580
San Mateo County
723,777
-5.08%
173
1,612
Stanislaus County
551,634
-0.29%
577
369
Tulare County
481,052
1.51%
1,900
100
Sonoma County
480,955
-1.5%
608
305
Solano County
449,551
-0.7%
317
547
Santa Barbara County
438,599
-2.19%
1,100
160
Placer County
429,048
5.7%
543
305
Monterey County
428,562
-2.23%
1,300
131
Merced County
293,630
4.19%
748
152
San Luis Obispo County
281,232
-0.23%
1,300
85
Santa Cruz County
258,854
-4.3%
172
582
Marin County
252,660
-3.31%
201
486
Yolo County
219,070
1.28%
391
216
Butte County
206,975
-1.51%
631
127
El Dorado County
191,643
0.21%
659
112
Shasta County
179,795
-1.21%
1,500
48
Imperial County
179,174
-0.24%
1,600
43
Madera County
165,387
5.78%
825
77
Kings County
152,377
-0.31%
537
110
Humboldt County
133,026
-2.37%
1,400
37
Napa County
132,062
-3.93%
290
176
Nevada County
101,673
-0.58%
370
106
Sutter County
97,327
-2.16%
233
161
Mendocino County
88,209
-3.46%
1,400
25
Yuba County
87,091
6.26%
244
138
San Benito County
68,707
6.47%
536
49
Lake County
67,584
-0.9%
484
54
Tehama County
64,493
-1.82%
1,100
22
Tuolumne County
53,821
-2.81%
857
24
Calaveras County
46,574
2.7%
394
46
Amador County
42,129
3.96%
230
71
Siskiyou County
42,024
-4.48%
2,400
7
Glenn County
27,898
-3.48%
507
21
Lassen County
27,702
-14.28%
1,800
6
Del Norte County
26,066
-5.57%
388
26
Colusa County
22,165
1.38%
444
19
Plumas County
18,819
-4.69%
985
7
Inyo County
18,312
-3.56%
3,900
2
Mariposa County
16,785
-1.95%
559
12
Trinity County
15,562
-3.29%
1,200
5
Mono County
13,130
-0.74%
1,200
4
Modoc County
8,381
-3.46%
1,500
2
Sierra County
3,178
-1.46%
368
3
Alpine County
1,092
-9.38%
285
1
Major Airports in California
Airport Name
Location
IATA Code
Los Angeles International Airport
Los Angeles
LAX
San Francisco International Airport
San Francisco
SFO
San Diego International Airport
San Diego
SAN
Oakland International Airport
Oakland
OAK
San Jose International Airport
San Jose
SJC
Sacramento International Airport
Sacramento
SMF
John Wayne Airport
Santa Ana (Orange County)
SNA
Hollywood Burbank Airport
Burbank
BUR
Ontario International Airport
Ontario
ONT
Long Beach Airport
Long Beach
LGB
Palm Springs International Airport
Palm Springs
PSP
Fresno Yosemite International Airport
Fresno
FAT
Santa Barbara Municipal Airport
Santa Barbara
SBA
Monterey Regional Airport
Monterey
MRY
Redding Municipal Airport
Redding
RDD
San Luis Obispo County Regional Airport
San Luis Obispo
SBP
Stockton Metropolitan Airport
Stockton
SCK
Charles M. Schulz–Sonoma County Airport
Santa Rosa
STS
Meadows Field Airport
Bakersfield
BFL
Imperial County Airport
Imperial
IPL
Crime Map of CA
Violent Crime Breakdown
Crime Type
California Total Reports
California Rate (per 1,000)
US Total Reports
US Rate (per 1,000)
Murder
2,231
0.06
21,156
0.06
Rape
14,613
0.37
133,294
0.40
Robbery
48,192
1.23
220,450
0.66
Assault
129,899
3.33
893,980
2.68
Property Crime Breakdown
Crimes Per Square Mile
Related Posts:


