As of 2025, Oregon’s population is estimated at 4,227,340, reflecting a steady growth rate of 0.89%, which ranks it as the 22nd fastest-growing state in the country according to the World Population Review.
This places Oregon among the states experiencing moderate population increases, aligning with its reputation as an attractive destination for residents.
Oregon, known as the Beaver State, has seen consistent growth over the years. Its population in 2013 surpassed 4 million, making it the 27th most populous state in the United States.
Oregon is situated in the Pacific Northwest, bordered by California to the south, Washington to the north, Nevada to the southeast, and Idaho to the east.
Key Takeaways
Age Structure
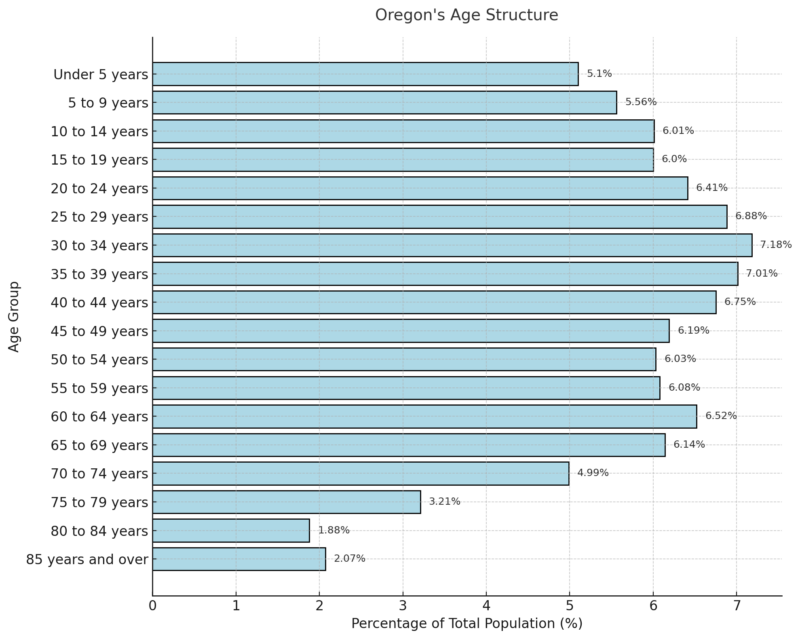
According to the 2018-2022 ACS 5-Year Estimates, Oregon’s median age is 39.9 years. The population distribution by age group is as follows: 16.67% are under the age of 15, 19.29% are between 15 and 29 years old, and the largest segment, 45.76%, falls within the 30 to 64 age range. Additionally, 16.22% are aged 65 to 84, while 2.07% are 85 years or older.
The largest age group in Oregon is 30 to 34 years, making up 7.18% of the total population.
This highlights a relatively young working-age demographic in the state, which could indicate strong workforce participation. Conversely, the smallest group is 80 to 84 years old, comprising only 1.88% of the population.
This distribution suggests that while Oregon has a significant aging population, the bulk of residents are still within their prime working and family-building years.
Oregon Population by Age Cohort
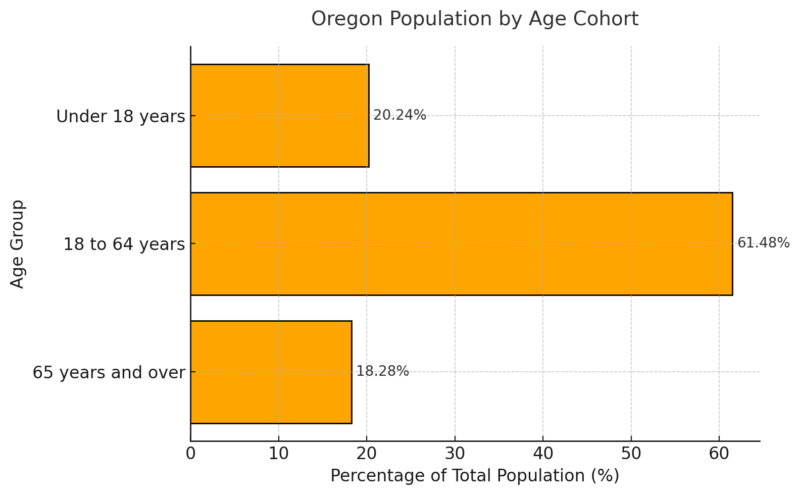
The majority of Oregon’s population (61.48%) falls within the 18 to 64-year-old age cohort, representing the primary workforce. Children under 18 account for 20.24%, while seniors 65 and older make up 18.28%.
Compared to national averages, Oregon has a slightly smaller proportion of children and a higher proportion of seniors, reflecting a population that may be aging faster than the national rate.
Dependency Ratios in Oregon
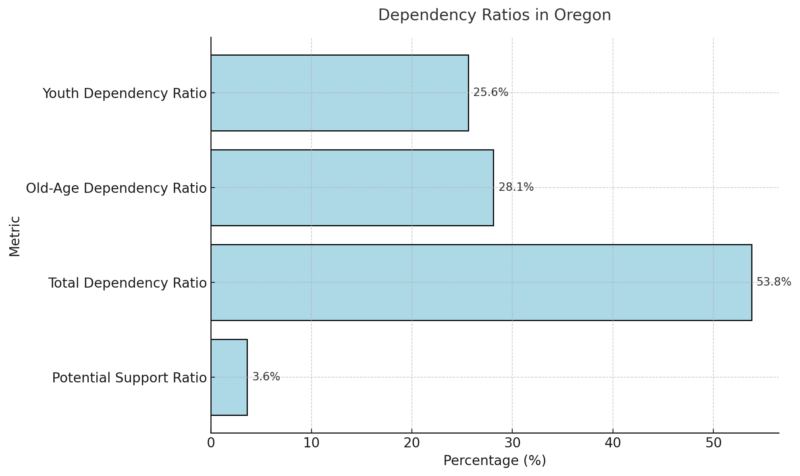
Oregon’s old-age dependency ratio (28.1%) is slightly higher than its youth dependency ratio (25.6%), indicating a growing need for healthcare, social services, and retirement support.
The total dependency ratio of 53.8% suggests that every 100 working-age individuals are supporting 53.8 dependents (children and seniors).
The potential support ratio of 3.6 reflects that there are about 3.6 working-age individuals for every senior, underscoring the need to balance economic policies to address both aging and youth populations.
Birth & Pregnancy Statistics
Statistic
Value
Ratio/Rate
Total Births
38,295
8.9 per 1,000 population
General Fertility Rate
—
44.4 births per 1,000 women (ages 15-44)
Total Fertility Rate
—
1304.1 estimated lifetime births per 1,000 women (ages 15-44)
Low Birthweight Births
2,743
71.6 per 1,000 births
Births with No Prenatal Care
550
14.5 per 1,000 births
Oregon reported 38,295 births in 2023, with a general fertility rate of 44.4 births per 1,000 women aged 15-44. The total fertility rate, an estimate of the average number of lifetime births per woman, was 1304.1.
Concerning indicators include the 2,743 low birthweight births (71.6 per 1,000 births) and 550 births with no prenatal care (14.5 per 1,000 births). These metrics highlight areas for improvement in maternal and prenatal healthcare access according to Oregon.gov.
Oregon Mortality Statistics
| Statistic | Value | Ratio/Rate |
|---|---|---|
| Total Deaths | 44,681 | 10.5 per 1,000 population |
| Maternal Deaths | 16 | 40.5 per 100,000 live births |
| Infant Deaths | 177 | 4.3 per 1,000 live births |
| Neonatal Deaths (first 27 days) | 120 | 2.9 per 1,000 live births |
| Fetal Deaths | 160 | 3.9 per 1,000 live births |
In 2022, Oregon recorded 44,681 deaths, with a rate of 10.5 deaths per 1,000 population. Maternal deaths were notably high, with 16 reported cases translating to a rate of 40.5 per 100,000 live births, signaling the need for enhanced maternal health policies.
Infant mortality stood at 4.3 per 1,000 live births, while neonatal deaths (within the first 27 days) were 2.9 per 1,000. Fetal deaths were reported at a ratio of 3.9 per 1,000 live births, emphasizing the importance of prenatal and early-life healthcare interventions.
Population by Race
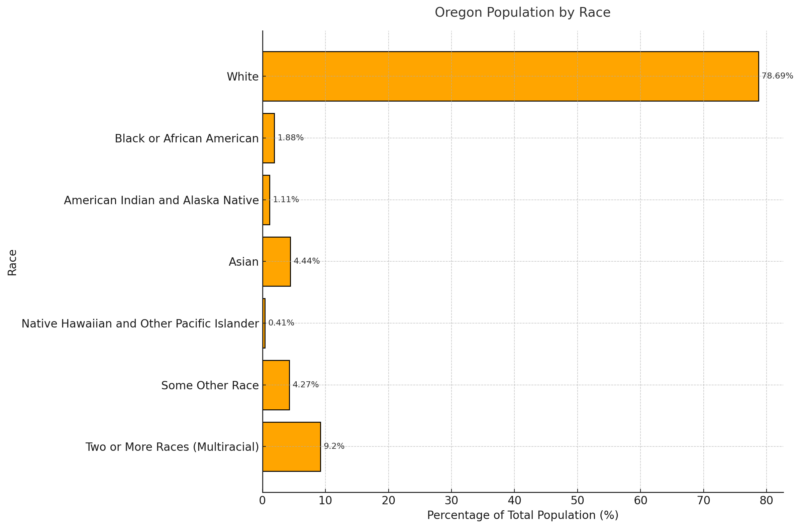
White residents dominate the population, making up 78.69%, which is higher than the national average for this demographic according to Neilsberg.
Multiracial individuals, or those identifying as Two or More Races, comprise 9.20% of the population, showcasing a growing trend toward racial diversity within the state. Asians represent the largest non-White racial group at 4.44%, reflecting Oregon’s deepening connections with Asian communities.
Smaller minority groups, such as Black or African Americans (1.88%), American Indians and Alaska Natives (1.11%), and Native Hawaiians and Pacific Islanders (0.41%), contribute to the state’s cultural and demographic richness.
Additionally, 4.27% of the population identifies as belonging to ‘Some Other Race,’ which likely reflects immigrant or non-categorized ethnic groups.
Oregon Counties 2025
County
Population
Growth Rate (%)
Area (sq mi)
Density (per sq mi)
Multnomah County
784,833
-3.88%
166
1,821
Washington County
597,644
-0.58%
279
825
Clackamas County
423,228
0.18%
722
226
Lane County
380,181
-0.82%
1,800
83
Marion County
346,763
0.12%
456
294
Jackson County
219,867
-1.68%
1,100
79
Deschutes County
210,543
5.55%
1,200
70
Linn County
132,370
2.63%
884
58
Douglas County
112,580
1.15%
1,900
22
Yamhill County
108,926
0.91%
276
152
Benton County
97,765
2.68%
261
145
Polk County
90,017
2.34%
286
121
Josephine County
87,842
-0.45%
633
54
Umatilla County
79,845
-0.33%
1,200
25
Klamath County
69,816
0.38%
2,300
12
Coos County
63,501
-2.27%
616
40
Columbia County
54,153
2.71%
254
82
Lincoln County
50,890
0.75%
379
52
Clatsop County
40,552
-1.48%
320
49
Malheur County
32,230
1.86%
3,800
3
Crook County
27,527
10.42%
1,100
9
Tillamook County
27,313
-0.54%
426
25
Wasco County
26,111
-1.99%
919
11
Union County
25,723
-1.72%
786
13
Jefferson County
25,584
4.08%
688
14
Hood River County
23,455
-2.12%
201
45
Curry County
22,979
-2.30%
628
14
Baker County
16,887
0.93%
1,200
6
Morrow County
12,312
0.74%
784
6
Lake County
8,213
0.50%
3,100
1
Wallowa County
7,698
3.94%
1,200
2
Harney County
7,348
-2.12%
3,900
1
Grant County
7,205
-0.48%
1,700
2
Gilliam County
2,044
1.39%
465
2
Sherman County
1,955
4.49%
318
2
Wheeler County
1,437
-1.17%
662
1
WPR notes that Oregon has 36 counties, with Multnomah County (811,880 residents in 2019) as the most populous, growing 10.12% since 2010. Other counties with over 200,000 residents include Washington County (597,695), Clackamas County (416,075), and Lane County (379,611), with Washington County leading growth at 12.42%.
The least populous county, Wheeler County, has 1,366 residents, declining 5.60% since 2010. Seven counties have fewer than 10,000 residents, with most showing stagnant or negative growth.
Deschutes County experienced the fastest growth, increasing 21.71% to 191,996 residents, followed by Crook (14.28%) and Polk (12.83%) counties. Six counties saw population declines, led by Wheeler (-5.60%) and Sherman (-3.99%).
Immigrants Stats
Metric
Value
Immigrant Share of Population
10.0%
Immigrant Residents
425,600
U.S.-Born Residents with Immigrant Parents
220,100
Immigrant Men
50.7%
Immigrant Women
49.3%
Immigrant Children
21,000
Immigrants Proficient in English
77.4%
AIC notes that immigrants account for 10% of Oregon’s population, with an additional 5.8% of U.S.-born residents living with at least one immigrant parent. This shows the deep integration of immigrants into family structures and communities.
The near-equal gender split reflects a balanced demographic profile, while the 77.4% English proficiency rate highlights their ability to engage effectively in local society and the workforce.
Age Distribution
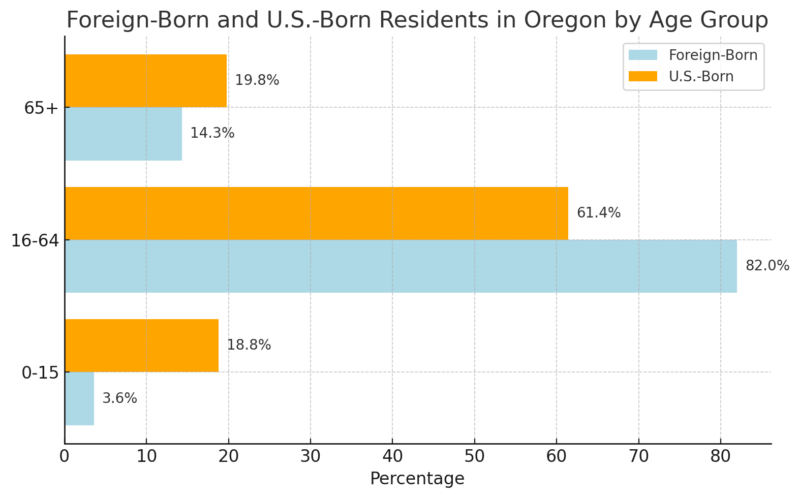
Foreign-born residents in Oregon are predominantly working-age (82%), compared to 61.4% of U.S.-born residents.
This concentration in the economically active age range highlights the significant role immigrants play in supporting the workforce and economic productivity.
Top Countries of Origin
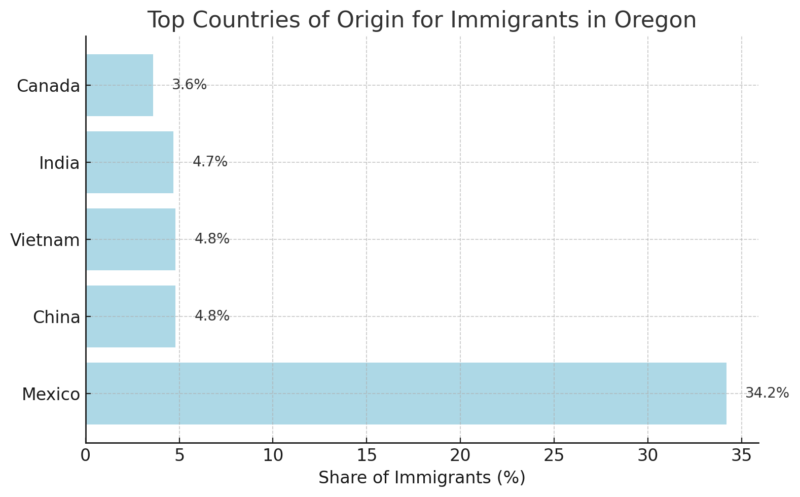
Over a third of immigrants in Oregon come from Mexico, reflecting historical and economic ties.
Significant populations from China, Vietnam, and India highlight the state’s increasing global connections, particularly with Asian nations.
Entrepreneurship
Metric
Value
Immigrant Entrepreneurs
29,800
Share of Entrepreneurs
12.7%
Total Business Income
$1.3 billion
Immigrants in Oregon are key drivers of entrepreneurship, comprising 12.7% of all entrepreneurs despite representing just 10% of the population.
Their businesses generate $1.3 billion in income, underscoring their contributions to job creation and economic innovation.
Taxes & Spending Power
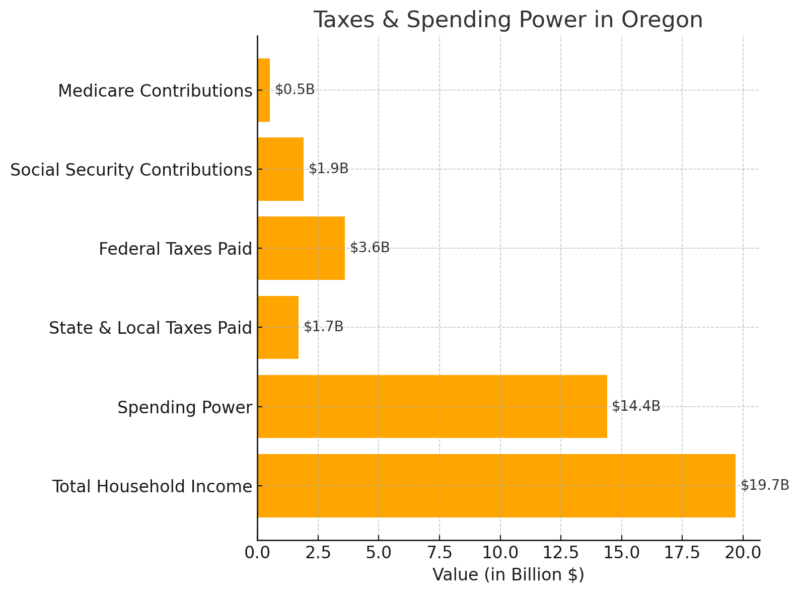
They contribute significantly to the state and federal tax base, paying $5.3 billion in taxes annually. Their spending power of $14.4 billion bolsters local economies and supports businesses across sectors.
Contributions to programs like Social Security ($1.9 billion) and Medicare ($512.9 million) further highlight their role in sustaining critical social systems that benefit all residents.
Education Levels
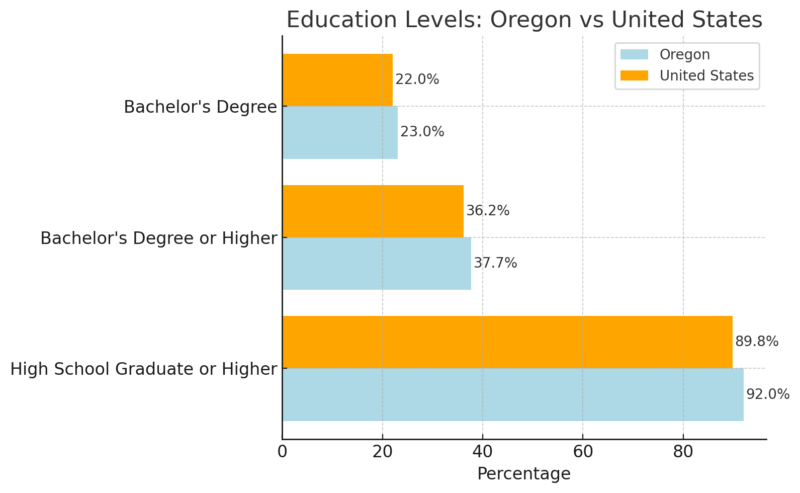
Oregon has a slightly higher percentage of residents with a bachelor’s degree or higher (37.7%) compared to the national average (36.2%) as noted by Census reporter.
Additionally, 92% of the state’s population aged 25 and older have at least a high school diploma, aligning closely with the national rate of 89.8%.
Population by Highest Level of Education
The majority of Oregon’s population has achieved education beyond high school, with 32% completing some college and 23% earning a bachelor’s degree.
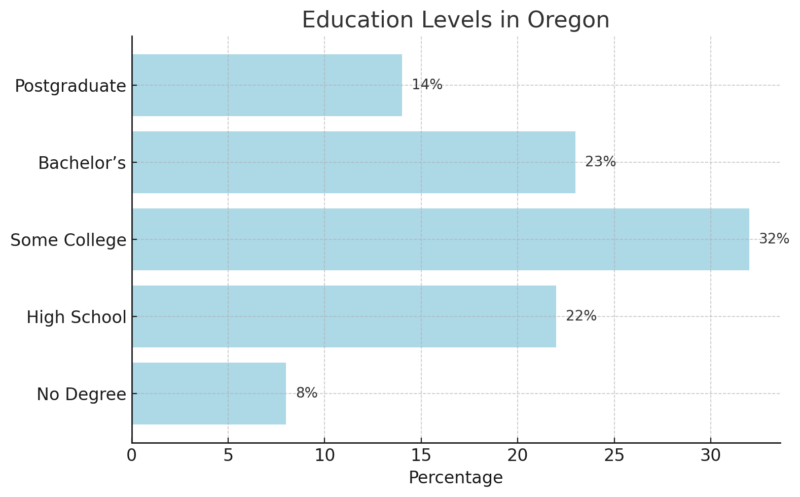
About 14% of residents hold postgraduate degrees, reflecting advanced specialization in their fields.
The 8% without any degree demonstrates a relatively low percentage of the population lacking formal education, further underscoring the state’s strong educational standing.
Income & Poverty in Oregon
Metric
Value
Median Household Income
$76,632
Per Capita Income (Past 12 Months)
$41,805
Persons in Poverty (Percent)
12.2%
Oregon’s median household income stands at $76,632, reflecting a stable and moderately prosperous economic environment. The per capita income of $41,805 aligns well with national standards for similar states.
However, 12.2% of the population lives below the poverty line, suggesting ongoing challenges in ensuring equitable economic benefits across all demographics. Targeted social policies and employment opportunities can address this income disparity according to Census.gov.
Business Landscape in Oregon
Metric
Value
Total Employer Establishments (2022)
122,397
Total Employment (2022)
1,666,806
Total Annual Payroll (2022)
$104,057,684,000
Employment Change (2021–2022)
+5.8%
Total Nonemployer Establishments (2021)
313,845
Men-Owned Employer Firms (2017)
48,639
Women-Owned Employer Firms (2017)
18,447
Minority-Owned Employer Firms (2017)
9,559
Nonminority-Owned Employer Firms (2017)
73,384
Veteran-Owned Employer Firms (2017)
5,759
Nonveteran-Owned Employer Firms (2017)
75,859
Oregon’s business ecosystem is robust, with 122,397 employer establishments and a total employment figure of 1.67 million in 2022.
A notable employment growth of 5.8% from 2021 to 2022 highlights the state’s dynamic economy. Women and minority-owned businesses comprise a smaller portion of the total employer firms, at 18,447 and 9,559 respectively, indicating areas for growth in diversity and inclusion in entrepreneurship.
The large number of nonemployer establishments (313,845) underscores the prevalence of self-employed individuals, which is significant for fostering innovation and local economic contributions.
Housing and Living Standards
Metric
Value
Change (YoY)
Median Sale Price
$508,000
+3.3%
Number of Homes Sold
4,356
+17.2%
Median Days on Market
41 days
+8 days
The Oregon housing market continues to grow, with home prices increasing by 3.3% year-over-year to a median sale price of $508,000 according to Redfin.
This price growth indicates a relatively stable market, although it may still challenge affordability for some buyers.
BREAKING: US new home sales dropped 17.3% in October from September, the biggest decline in 13 YEARS.
610,000 new homes were sold, well below expectations of 725,000.
Median sale price rose 4.7% to $437,300, the highest since August 2023.
Is the US housing market crashing? pic.twitter.com/pQ0povN1Xx
— Global Markets Investor (@GlobalMktObserv) November 26, 2024
The number of homes sold rose sharply by 17.2%, reflecting strong demand. However, homes are staying on the market slightly longer, with an 8-day increase in the median days on the market compared to last year.
Top 10 Metros in Oregon with the Fastest-Growing Sales Prices
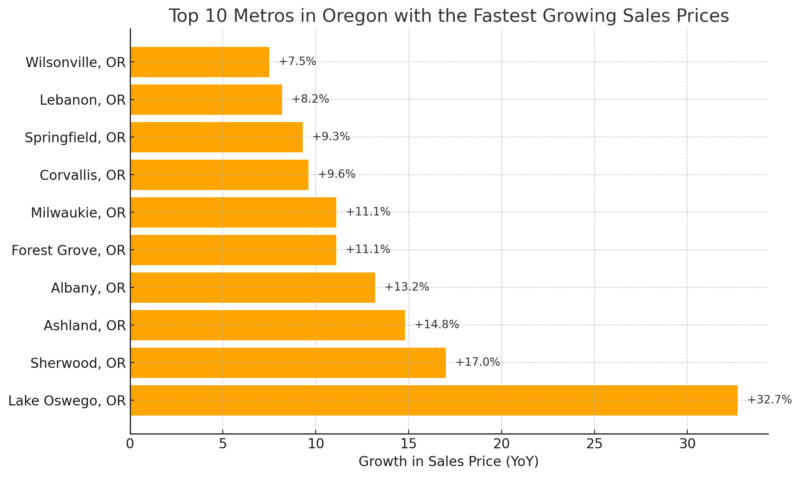
The metro areas of Lake Oswego (+32.7%) and Sherwood (+17.0%) show exceptional growth in sales prices, driven by strong local demand and possibly high-income buyers.
Cities like Albany and Ashland also exhibit notable double-digit increases, indicating regional hotspots for housing activity.
Oregon Housing Supply
Metric
Value
Change (YoY)
Number of Homes for Sale
18,123
+13.0%
Number of Newly Listed Homes
4,370
+7.1%
Months of Supply
3 months
No change
Oregon’s housing supply is increasing, with 18,123 homes available for sale (+13.0% YoY) and 4,370 newly listed homes (+7.1% YoY).
While the inventory growth is a positive sign for buyers, the market still holds steady at three months of supply, indicating balanced conditions rather than an oversupply.
Methodology
This article was developed using verified data from trusted sources like U.S. Census Bureau, ACS reports, and Redfin.
We analyzed population trends, housing metrics, and economic contributions using a combination of statistical tools and comparative insights.
Data was cross-referenced to ensure accuracy and clarity for diverse audiences. We presented visual breakdowns, charts, and summaries for accessibility and understanding.
Contextual analysis was included to align Oregon’s data with national averages and trends.
References
- World Population Review – Oregon Population 2024
- Neilsberg Insights – Oregon Population by Age
- Neilsberg Insights – Oregon Population by Race
- Oregon.gov – Annual Birth Statistics
- Census Reporter – Oregon Profile
- American Immigration Council – Immigrants in Oregon
- World Population Review – Oregon Counties
- Redfin – Oregon Housing Market Trends
- U.S. Census Bureau – QuickFacts: Oregon


