Seattle, located in King County, Washington, is a vibrant city with a 2024 population of 759,915 according to World Population Review.
As the county seat of King County, Seattle continues to experience growth, with an annual increase rate of 0.64%.
Since the most recent census in 2020, which reported a population of 740,565, the city has seen a population growth of 2.61%.
Macrotrends notes that in 2025, Seattle’s metro area population is projected to reach 3,581,000, marking a 0.9% increase from the previous year.
This growth cements its position as one of the fastest-growing major cities in the United States.
Table of ContentsKey Takeaways
Population Growth and Historical Evolution
Seattle has experienced significant population growth over the past decade, with a notable increase of over 12,600 residents between 2011 and 2012, ranking 14th in the country for population growth during that time.
Urban planners project an additional growth of 200,000 residents in Seattle proper by 2040, with the larger Seattle area expected to increase by 1.7 million people.
Efforts to accommodate this growth have included constructing apartment buildings, with downtown Seattle experiencing a 77% growth since 2009.
Historically, the Seattle area was home to Native Americans for approximately 4,000 years before European settlers arrived.
George Vancouver was the first European to chart the area in 1792, and the Denny Party established the village of Dewamps in 1851, later renamed Seattle in honor of Chief Sealth.
Incorporated in 1865, Seattle’s early development saw boom-and-bust cycles tied to industries like lumber, gold, and shipbuilding, with significant events including the Klondike Gold Rush and the founding of UPS.
Median Age Comparison

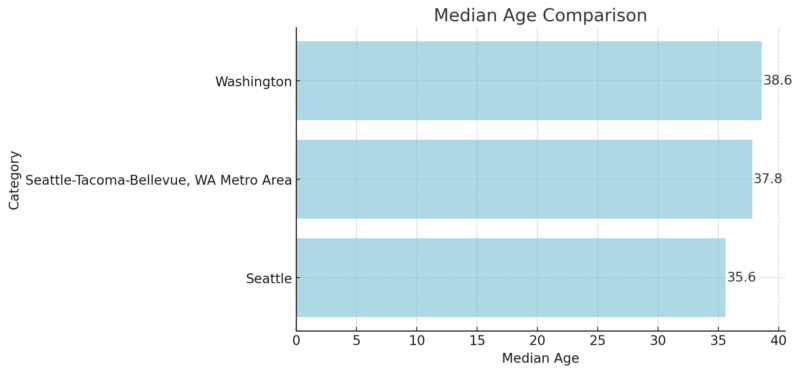
Seattle’s median age is 35.6, making it younger compared to the Seattle-Tacoma-Bellevue Metro Area (37.8) and the state of Washington (38.6) as noted by Census Reporter.
This suggests a relatively youthful demographic, potentially due to an influx of younger professionals and students attracted to the city’s tech, cultural, and educational opportunities.
Population by Age Range
Age Range
Seattle (%)
Metro Area (%)
Washington (%)
0-9
8%
11%
11%
10-19
9%
11%
11%
20-29
19%
–
–
30-39
23%
–
–
40-49
13%
–
–
50-59
10%
–
–
60-69
8%
–
–
70-79
6%
–
–
80+
3%†
–
–
The population of Seattle skews toward younger adults, with 42% of residents in the 20-39 age range.
This aligns with the city’s reputation as a hub for young professionals, particularly in tech and creative industries.
The lower percentage of children and teenagers (0-19 years) compared to the Metro Area and state indicates a potential focus on adult-centric urban lifestyles and possibly fewer family households.
Population by Age Category
Age Category
Seattle (%)
Under 18
–
18 to 64
73%
65 and over
–
The working-age population (18-64 years) comprises a dominant 73% of Seattle’s residents, reinforcing the city’s role as a thriving economic and employment center.
The absence of specific data for younger and older demographics in this table suggests the focus is primarily on the workforce composition.
Sex Distribution

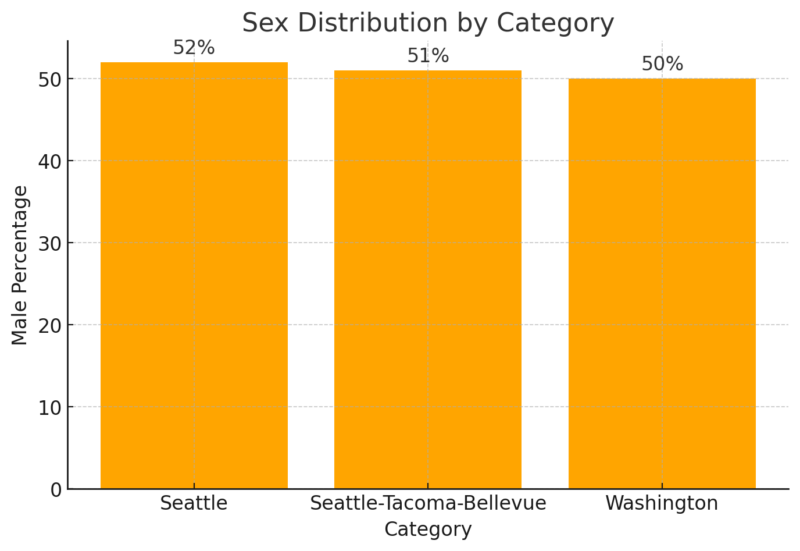
Males represent a slightly higher percentage (52%) of Seattle’s population compared to the Metro Area (51%) and Washington state (50%).
This marginally higher male demographic might reflect a gender distribution common in cities with strong tech and industrial sectors, which historically attract a higher proportion of male workers.
Seattle Neighborhoods 2025
Rank
Neighborhood
Population (in thousands)
1
Capitol Hill
29.34
2
Univ Dist
27.01
3
Magnolia
18.54
4
Wallingford
15.83
5
Greenwood
15.27
6
Beacon Hill
13.39
7
Fremont
11.73
8
First Hill
11.72
9
Ravenna
11.31
10
Admiral
11.20
11
N Beacon Hl
11.09
12
Belltown
11.07
13
Maple Leaf
10.94
14
N Queen Anne
10.63
15
Ballard
10.12
16
Phinney Ridge
9.77
17
Green Lake
8.58
18
Haller Lake
8.20
19
Broadview
8.19
20
Minor
8.15
21
Olympic Hills
8.06
22
Bitter Lake
8.00
23
Downtown
7.99
24
Columbia City
7.99
25
Loyal Heights
7.96
26
Wedgwood
7.79
27
Brighton
7.50
28
Alki
7.44
29
E Queen Anne
7.17
30
West Woodland
6.88
31
Arbor Heights
6.33
32
Montlake
5.43
33
Madison Vly
5.10
34
Hillman City
4.45
35
Denny Trngl
3.99
36
Olympic Manor
3.60
37
Jackson Place
3.08
38
Broadmoor
2.28
39
Ind Dist
1.09
40
Waterfront
0.74
41
Sand Point
0.37
42
Little Saigon
0.31
43
Matthews Bch
0.28
44
S Beacon Hl
0.27
Capitol Hill leads with the highest population of 29.34K, reflecting its role as a central, densely populated area with significant residential and commercial activity.
University District (27.01K) follows closely, likely due to its large student population and proximity to the University of Washington.
Neighborhoods like Magnolia (18.54K), Wallingford (15.83K), and Greenwood (15.27K) represent balanced residential hubs with strong community and family-friendly environments.
Ballard (10.12K) and Fremont (11.73K) are notable for their vibrant cultural scenes and appeal to younger demographics.
Current Seattle Housing Market Overview
Metric
Value
Change YoY (%/Days)
Median Sale Price
$850,000
0.0%
# of Homes Sold
633
+15.1%
Median Days on Market
26
+11 days
The Seattle housing market in November 2024 remains stable in terms of pricing, with the median sale price holding steady at $850,000, showing no year-over-year change.
However, the number of homes sold increased significantly by 15.1%, rising from 550 homes sold in November 2023 to 633 in 2024.
This uptick in sales volume suggests stronger buyer activity despite unchanged prices as noted by Redfin.
The median days on the market increased from 15 days to 26 days year-over-year, indicating a slower pace of sales. This could reflect buyers taking more time to finalize decisions, or a market shift toward a more balanced dynamic between buyers and sellers.
View this post on Instagram
A post shared by Sharlane Chase – Seattle Real Estate Agent (@sharlaneinseattle)
Income Distribution in Seattle (2023)
Income Bracket
Number of Households
Notes
$50,000–$99,999
75,000
Traditional middle-class range
$200,000+
106,000
High-income households dominate
Seattle had 106,000 households earning $200,000 or more in 2023, significantly outpacing the 75,000 households in the $50,000–$99,999 bracket as noted by the Seattle Times.
This trend indicates a wealthier population overall, driven by the city’s high-paying industries like technology, healthcare, and professional services.
Nationally, the $50,000–$99,999 range is considered middle class. However, in Seattle, this bracket represents a shrinking portion of households due to the rising cost of living and income growth in certain sectors.
Income levels required to be considered middle-class varied significantly depending on where a person lived, according to the new study. https://t.co/ITNOKJfCtH
— FOX 13 Seattle (@fox13seattle) October 8, 2024
Middle-class status in Seattle likely starts at a higher income threshold, reflecting local economic realities.
Among the top 50 U.S. cities, only four others (Boston, San Francisco, San Jose, and Washington, D.C.) share the characteristic of having more $200,000+ households than those earning $50,000–$99,999.
For households in the $50,000–$99,999 range, affording housing, education, and other necessities may be increasingly difficult in a city where high incomes drive up overall costs.
The growing gap between middle and high-income earners highlights potential challenges for economic equity and diversity in the city.
Overview of Seattle Public Schools
Metric
Value
Total Schools
109
Preschools
39
Elementary Schools
77
Middle Schools
29
High Schools
21
Total Students Enrolled
51,238
Minority Enrollment
60%
Economically Disadvantaged
24.4%
Seattle Public Schools is a large and diverse district, serving over 51,000 students across 109 schools, including preschools, elementary, middle, and high schools. The district has a significant minority enrollment of 60%, reflecting the city’s diverse demographics as noted by U.S. News.
Additionally, nearly one-quarter of students face economic disadvantages, highlighting a need for equitable resource allocation to support all learners.
Student Demographics

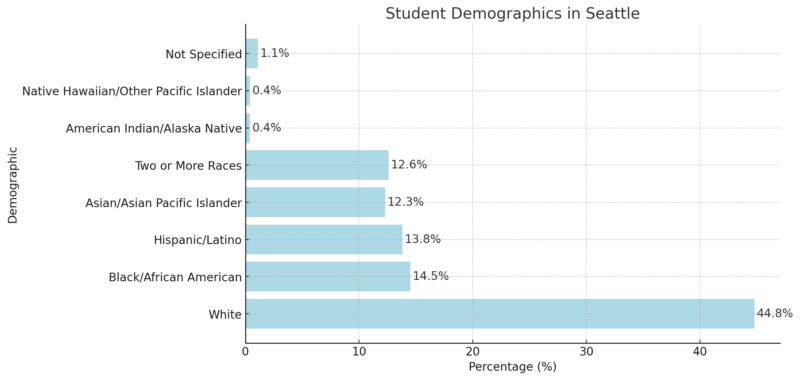
The student body of Seattle Public Schools is diverse, with White students making up 44.8%, followed by Black/African American students at 14.5%, and Hispanic/Latino students at 13.8%. Asian and multiracial students also constitute significant portions of the population.
This variety underscores the cultural richness of the district and the importance of culturally responsive education. However, smaller representation from Native groups and others may require targeted efforts to ensure inclusivity.
Academic Performance

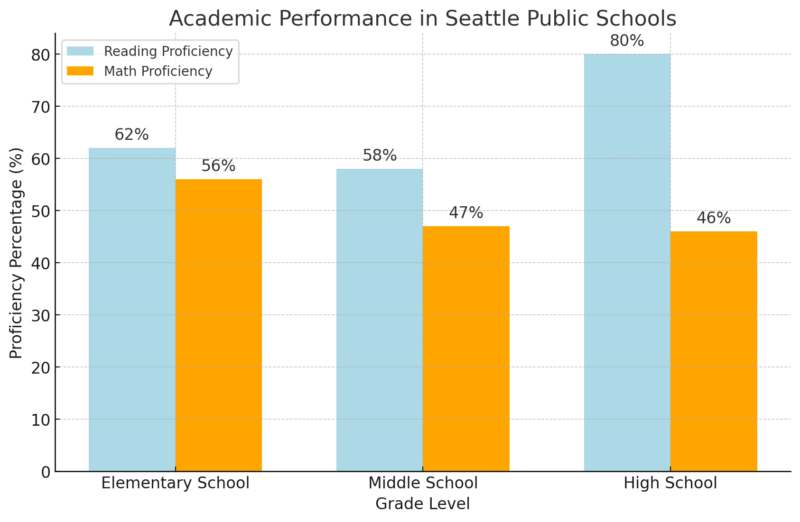
Academic performance in Seattle Public Schools shows strong reading proficiency, particularly in high schools, where 80% of students achieve or surpass the proficient level.
However, math proficiency lags, especially at the middle and high school levels, indicating areas where additional resources and support may be necessary.
This gap could affect college and career readiness for students in STEM-related fields.
Teacher and Staffing Data
Metric
Value
Certified Teachers
97.4%
Student-Teacher Ratio
16:1
State Average for Student-Teacher Ratio
17:1
Full-Time Counselors
52
Seattle Public Schools employs a well-certified teaching staff, with 97.4% of teachers holding appropriate certifications.
The district also benefits from a favorable student-teacher ratio of 16:1, below the state average of 17:1, which supports more personalized instruction.
Additionally, 52 full-time counselors provide essential guidance services, though this number may still be insufficient given the size of the district.
Financial Overview
Metric
Value
Revenue Per Student
$24,141
Expenses Per Student
$18,945
Total Revenue
$1,302,978,000
Instructional Spending
$10,949.8 million
Support Services Spending
$6,724.3 million
Other Expenses
$311.0 million
Revenue by Source (State)
50.9%
Revenue by Source (Local)
40.5%
Revenue by Source (Federal)
8.6%
Seattle Public Schools is well-funded, with revenue per student at $24,141 and annual spending at $18,945 per student.
The majority of funding comes from state sources (50.9%), followed by local contributions (40.5%) and federal funding (8.6%).
Instructional spending forms the largest budgetary share, demonstrating the district’s focus on classroom education.
However, disparities in spending effectiveness might exist, as indicated by areas of underperformance in math.
3rd Healthiest City in the United States
Metric
Seattle
National Average
Physically Unhealthy Days (per 30)
2.97
3.3
Mentally Unhealthy Days (per 30)
4.88
4.8
Smoking Rate (% of Adults)
9%
15%
Obesity Rate (% of Adults)
23.3%
34%
Diabetes Prevalence (% of Adults)
7.1%
11.6%
No Physical Activity (% of Adults)
14.3%
–
Binge/Heavy Drinking (% of Adults)
19%
18%
Drug Poisoning Deaths (per 100,000)
23.25
32.6
Less than 7 Hours of Sleep (% of Adults)
27.4%
36.8%
Seattle consistently ranks as one of the healthiest cities in the U.S., coming in third on the list.
The city’s residents report fewer physical (2.97 days) and mental (4.88 days) unhealthy days per month compared to the national averages of 3.3 and 4.8 days, respectively as per Statesmjournal.
Seattle, Washington, was ranked among the top 10 healthiest cities in America for 2025, according to a new report. https://t.co/RFhbY1kTpe
— Statesman Journal (@Salem_Statesman) December 13, 2024
These figures highlight Seattleites’ general well-being, likely influenced by a culture prioritizing fitness and outdoor activities.
The city also boasts lower rates of smoking (9%) and obesity (23.3%) compared to the national averages of 15% and 34%, respectively. This trend aligns with its reputation for a health-conscious population.
Diabetes prevalence in Seattle is significantly lower at 7.1%, compared to 11.6% nationally. Only 14.3% of adults report no physical activity during their free time, reflecting a community actively engaged in fitness and recreation.
Economic Overview
Metric
Seattle
Notes
Median Household Income
$120,600
Higher than national average
Households Earning $200,000+ (%)
29.2%
Reflects high-income earning
While binge or heavy drinking in Seattle is slightly above the national average (19% vs. 18%), the drug poisoning death rate (23.25 per 100,000) remains significantly lower than the national figure of 32.6. Sleep health is also notably better in Seattle, with only 27.4% of adults reporting fewer than seven hours of sleep compared to 36.8% nationally.
Economically, Seattle’s median household income of $120,600 reflects the city’s affluence, with nearly 29.2% of households earning $200,000 or more. This financial stability likely contributes to access to healthcare and wellness resources, further bolstering the city’s health outcomes.
Overall, Seattle’s ranking as the third healthiest city in the U.S. reflects its proactive health culture, robust public resources, and a strong local economy that supports residents’ well-being
Seattle’s Millennial Appeal
Metric
Value
Rank Among U.S. Cities for Millennials
5th
Percentage of Millennials (Newcomers)
11.51%
Total Millennials Who Moved to Seattle
86,049
Millennials from Other States
23,515
Millennials from Abroad
5,731
Millennials as Percentage of Population
42.09%
Median Household Income
$120,608
Seattle ranked 5th among U.S. cities attracting millennials in 2023, with millennials comprising 11.51% of the city’s total population and a remarkable 42.09% of residents aged 25-44.
This demographic shift, driven by over 86,000 millennial newcomers, underscores the city’s growing appeal as a hub for young professionals and families.
A strong job market fueled by leading industries such as technology, healthcare, and e-commerce has positioned Seattle as a hotspot for career advancement.

The city’s high median household income of $120,608 further solidifies its attractiveness to millennials seeking financial and professional growth.
The SmartAsset study, which analyzed migration patterns, highlighted that 23,515 millennials relocated to Seattle from other states, while 5,731 arrived from abroad.
These numbers showcase Seattle’s national and international draw.
Methodology for Crafting the Article
To create this comprehensive article, we employed a structured approach combining data collection, analysis, and synthesis. First, we aggregated verified statistics from reliable sources such as World Population Review, Macrotrends, SmartAsset, and Census Reporter to ensure accuracy and credibility.
Second, we categorized information into key themes, such as population growth, demographic distribution, economic metrics, health statistics, and housing trends, to provide a clear and organized narrative.
Third, we integrated data from public records, including census findings and studies by organizations like the CDC and U.S. News, to contextualize Seattle’s position on various national rankings.
References
- World Population Review – Seattle Population 2024
- Macrotrends – Seattle Metro Area Population 2025
- Census Reporter – Seattle Demographic Profile
- SmartAsset – Where Millennials Moved in 2025
- Redfin – Seattle Housing Market
- Seattle Times – Seattle Median Household Income Hits $121,000
- U.S. News – Seattle School District Profile
- Statesman Journal – Seattle Ranked Third Healthiest City in US
Related Posts:
- Indianapolis Population 2025 - Key Trends and Projections
- Louisville Population 2025 - Key Trends and Projections
- Arizona Population Statistics 2025 - 12 Key Data and…
- Houston Population 2025 - Growth Trends and Projections
- Oklahoma City Population 2025 - Growth Trends and…
- Jacksonville Population 2025 - Growth Trends and Projections


