When it comes to birth defects in the U.S., there’s no single, nationwide tracking system keeping tabs on every case. Instead, most states maintain their tracking programs, providing us with valuable regional data that helps paint a picture of which birth defects are most common and where.
Across the country, certain defects consistently show up at higher rates, and understanding these patterns is essential for healthcare providers, policymakers, and families.
Let’s start with the facts from the CDC: clubfoot affects roughly 1 in 536 births, which translates to around 6,850 babies born with this condition annually.
Down syndrome (Trisomy 21), one of the most well-known chromosomal conditions, occurs in 1 in 643 births, impacting approximately 5,713 babies each year. While these numbers represent national estimates, variations exist across different regions based on factors like environmental exposures, genetics, and access to prenatal care.
Key Takeaways
- Clubfoot and Down syndrome are among the most common birth defects, affecting thousands of babies yearly.
- Neural tube defects, while less common, have significant impacts and highlight the importance of folic acid supplementation.
- Heart defects represent the largest category, with nearly every state seeing cases annually.
- Regional variations stem from differences in healthcare access, environmental factors, and public health initiatives.
Heart Defects: The Most Common Category of Birth Defects
Congenital heart defects (CHDs) make up the largest category of birth defects, with some types requiring complex surgeries or lifelong management. Their prevalence and severity can vary widely.
| Heart Defect | Occurrence Rate | Estimated Babies Affected Annually |
|---|---|---|
| Atrioventricular septal defect (AVSD) | 1 in 1,712 births | ~2,145 |
| Coarctation of the aorta | 1 in 1,712 births | ~2,146 |
| Common truncus (TA) | 1 in 15,984 births | ~230 |
| Double outlet right ventricle (DORV) | 1 in 4,237 births | ~867 |
| Ebstein anomaly | 1 in 12,916 births | ~284 |
| Hypoplastic left heart syndrome (HLHS) | 1 in 3,955 births | ~929 |
| Interrupted aortic arch (IAA) | 1 in 10,058 births | ~365 |
| Pulmonary valve atresia and stenosis | 1 in 972 births | ~3,779 |
| Pulmonary valve atresia | 1 in 6,708 births | ~548 |
| Single ventricle | 1 in 15,356 births | ~239 |
| Tetralogy of Fallot (TOF) | 1 in 2,077 births | ~1,768 |
| Total anomalous pulmonary venous connection (TAPVC) | 1 in 7,552 births | ~486 |
| Transposition of the great arteries (TGA) | 1 in 3,348 births | ~1,097 |
| Dextro-transposition of great arteries (d-TGA) | 1 in 3,957 births | ~928 |
| Tricuspid valve atresia and stenosis | 1 in 5,527 births | ~665 |
| Tricuspid valve atresia | 1 in 11,309 births | ~325 |
These defects account for a significant number of newborn health challenges across the U.S. Pulmonary valve defects, for example, affect nearly 3,800 babies annually. Regions with robust pediatric cardiology services often report higher detection and management rates.
According to CDC data, congenital heart defects like atrioventricular septal defect (1 in 1,712 births) and pulmonary valve atresia and stenosis (1 in 972 births) are among the most frequently reported, affecting thousands of babies each year.
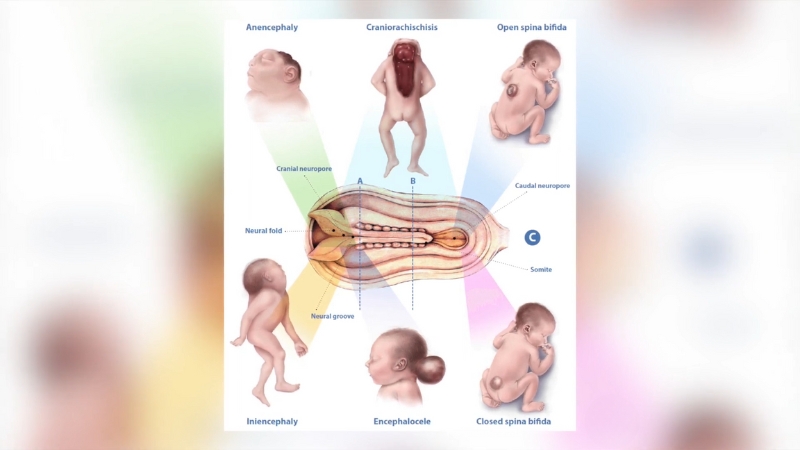
Neural Tube Defects: Serious but Rare Conditions
View this post on Instagram
A 2022 study published in Birth Defects Research highlighted significant regional disparities in neural tube defect rates across the United States, emphasizing the impact of factors such as maternal folic acid intake, healthcare access, and environmental exposures on the prevalence of these conditions.
| Neural Tube Defect | Occurrence Rate | Estimated Babies Affected Annually |
|---|---|---|
| Anencephaly | 1 in 5,246 births | ~700 |
| Encephalocele | 1 in 10,365 births | ~354 |
| Spina bifida (without anencephaly) | 1 in 2,875 births | ~1,278 |
Anencephaly, where parts of the brain and skull don’t form, is typically fatal shortly after birth. Spina bifida, a defect in the spine, varies in severity and can lead to lifelong mobility and health issues.
The rates of these defects can be influenced by factors like maternal folic acid intake, genetics, and access to prenatal care. States with aggressive folic acid supplementation programs have seen reductions in neural tube defects.
Eye Defects: Less Common but Impactful

Defects affecting eye formation, like anophthalmia (absence of one or both eyes) and microphthalmia (abnormally small eyes), occur less frequently but present significant challenges for affected children.
According to CDC data, eye defects like anophthalmia and microphthalmia occur in about 1 in 5,078 births, affecting roughly 723 babies annually across the U.S.
| Eye Defect | Occurrence Rate | Estimated Babies Affected Annually |
|---|---|---|
| Anophthalmia/Microphthalmia | 1 in 5,078 births | ~723 |
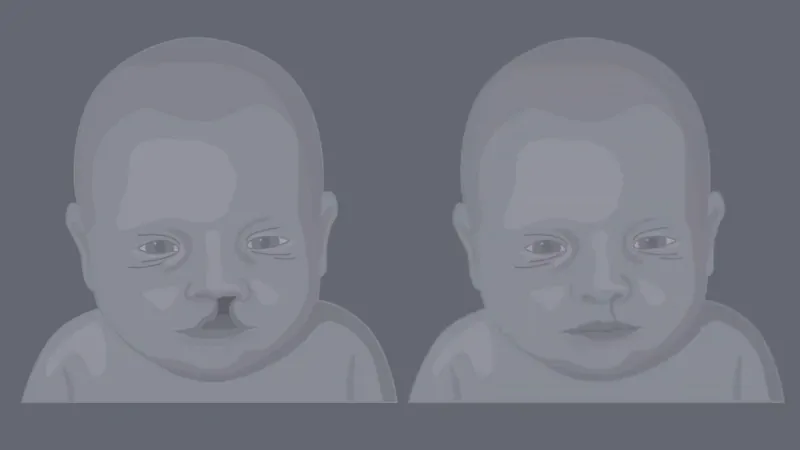
Cleft Lip and Palate: Common and Treatable
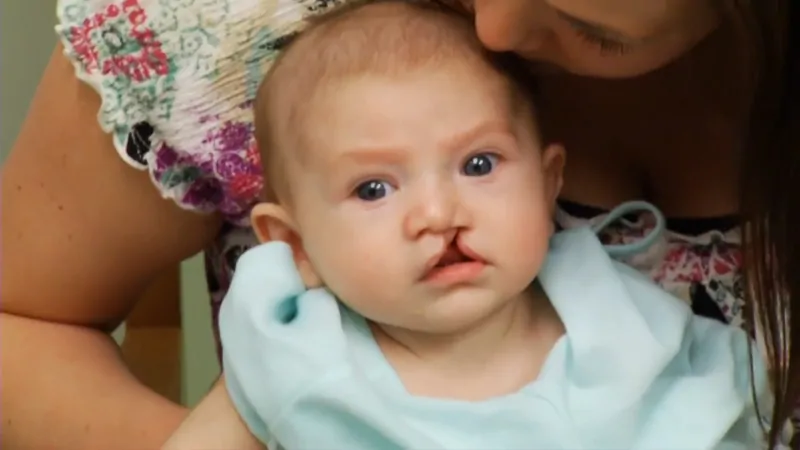
Mouth and facial defects, particularly cleft lip and cleft palate, are among the most common congenital defects. These conditions are highly treatable with surgical intervention, but early diagnosis and coordinated care are critical.
According to the latest data, cleft lip with or without cleft palate occurs in about 1 in 1,032 births, translating to roughly 3,560 babies born each year with this condition.
| Defect | Occurrence Rate | Estimated Babies Affected Annually |
|---|---|---|
| Cleft lip with/without palate | 1 in 1,032 births | ~3,560 |
| Cleft lip with cleft palate | 1 in 1,583 births | ~2,320 |
| Cleft lip alone | 1 in 2,963 births | ~1,240 |
| Cleft palate alone | 1 in 1,583 births | ~2,321 |
Regional differences can reflect access to prenatal care, maternal health factors, and public health campaigns promoting awareness of risk factors like smoking during pregnancy.
Muscle and Bone Defects: Clubfoot and Limb Deficiencies
@doctor.bradley #clubfoot The majority of Americans aren’t familiar with clubfoot; it’s a disability where the foot turns inward so severely that the bottom of the foot faces sideways or even upward, which leads to extreme pain, stigma and often an inability to walk. It’s one of the most common birth defects globally and can become a lifelong disability if it’s not treated. We’re fortunate that here in the United States, clubfoot is detected early, often, even in utero and babies born with the condition receive the highest levels of medical treatment. Yet, 85% of children in low- and middle-income countries born with clubfoot do not have access to the care or health practitioners needed to change the trajectory of this diagnosis. @MiracleFeet is an organization on a mission to ensure all children with #clubfoot ♬ original sound – Doctor Brad
Clubfoot is the most common musculoskeletal birth defect, while limb deficiencies affect fewer children but often require specialized care.
| Defect | Occurrence Rate | Estimated Babies Affected Annually |
|---|---|---|
| Clubfoot | 1 in 536 births | ~6,850 |
| Diaphragmatic hernia | 1 in 3,214 births | ~1,143 |
| Gastroschisis | 1 in 2,439 births | ~1,506 |
| Limb deficiencies | 1 in 2,064 births | ~1,779 |
| Omphalocele | 1 in 4,021 births | ~914 |
According to NCBI estimates, clubfoot remains the most common musculoskeletal birth defect, affecting about 1 in 536 births, or around 6,850 babies annually.
These cases often require specialized orthopedic care and prosthetics to support mobility and function.
Other musculoskeletal defects include diaphragmatic hernia, occurring in about 1 in 3,214 births (roughly 1,143 babies annually), and gastroschisis, seen in 1 in 2,439 births (affecting about 1,506 babies annually).
Gastroschisis is a condition where the baby’s intestines extend outside of the body through a hole near the belly button, often necessitating surgery soon after birth.
Meanwhile, omphalocele, a related but distinct condition, occurs in 1 in 4,021 births and affects around 914 babies each year, involving a protective sac around the protruding organs. These defects vary in severity and management, but all require coordinated medical care.
Stomach and Intestine Defects: Challenging Conditions
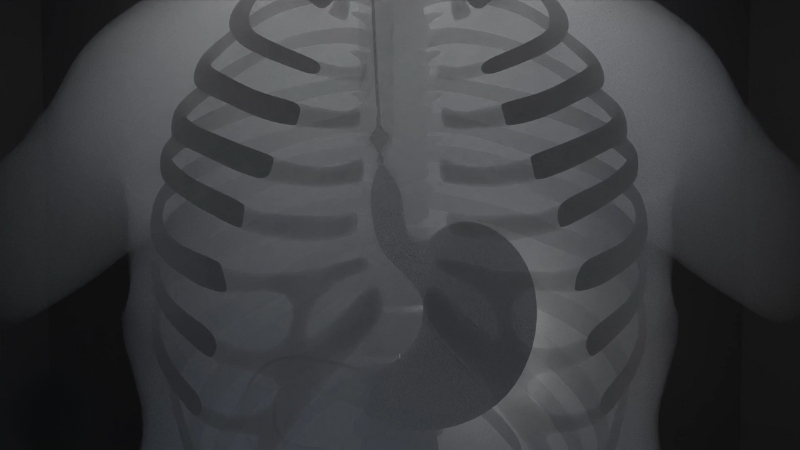
Gastrointestinal defects like esophageal atresia and rectal atresia can complicate feeding and digestion, often requiring early surgery.
| Defect | Occurrence Rate | Estimated Babies Affected Annually |
|---|---|---|
| Esophageal atresia/tracheoesophageal fistula | 1 in 4,167 births | ~882 |
| Rectal and large intestinal atresia/stenosis | 1 in 2,220 births | ~1,654 |
According to national estimates, gastrointestinal defects such as esophageal atresia occur in about 1 in 4,167 births, impacting roughly 882 babies each year.
Esophageal atresia is a condition where the esophagus doesn’t connect properly to the stomach, requiring surgery soon after birth to enable proper feeding. Similarly, rectal and large intestinal atresia or stenosis, affecting approximately 1 in 2,220 births (around 1,654 babies annually), involves a narrowing or complete blockage of the lower digestive tract.
This condition often necessitates early surgical intervention and can lead to long-term bowel management issues.
Both esophageal and rectal defects highlight the importance of prenatal care and early detection, as well as the need for experienced pediatric surgical teams to ensure the best outcomes.
Chromosomal Anomalies: The Genetic Side
Trisomy 21, better known as Down syndrome, is the most common chromosomal condition diagnosed in the U.S., but are your patients familiar with others like trisomy 18 & trisomy 13? Here’s more information: https://t.co/zSl6vVgD4b#PMLS #NIPT #trisomy #genetics #pregnancy #health
— Premier Medical (@_PremierMedical) July 29, 2022
Chromosomal conditions, especially Down syndrome (Trisomy 21), are among the most recognized birth defects. These anomalies can affect various body systems and are influenced by maternal age and regional prenatal screening practices.
| Condition | Occurrence Rate | Estimated Babies Affected Annually |
|---|---|---|
| Trisomy 13 | 1 in 6,967 births | ~527 |
| Trisomy 18 | 1 in 3,336 births | ~1,101 |
| Trisomy 21 (Down syndrome) | 1 in 643 births | ~5,713 |
According to CDC data, Down syndrome (Trisomy 21) stands as the most common chromosomal anomaly in the U.S., occurring in approximately 1 in every 643 births and affecting an estimated 5,713 babies annually.
This condition arises from an extra copy of chromosome 21, leading to a range of physical and developmental challenges that vary widely in severity. The prevalence of Down syndrome is influenced by several factors, including maternal age, with older mothers facing a higher risk.
Advances in prenatal screening and diagnostic testing have made it possible to identify this condition early, offering families time to plan and connect with resources. Despite the challenges, many children with Down syndrome lead fulfilling lives, thanks to early interventions, medical care, and supportive environments.
Regional differences in diagnosis rates may reflect disparities in access to prenatal care and screening services, highlighting the need for consistent healthcare outreach across the country
Birth Defect Prevalence in Selected States
| State | Musculoskeletal Defects | Cardiac Defects | Neural Tube Defects | Orofacial Clefts | Data Source |
|---|---|---|---|---|---|
| Texas | 165 per 10,000 | 158 per 10,000 | Data not specified | Data not specified | |
| Arkansas | Data not specified | Data not specified | Higher than the national average | Higher than the national average | State Surveillance Reports |
| Kentucky | Data not specified | Data not specified | Elevated rates | Higher prevalence | State Surveillance Reports |
| Alabama | Data not specified | Increased prevalence | Data not specified | Data not specified | State Surveillance Reports |
| Mississippi | Data not specified | Data not specified | Data not specified | Data not specified |
1. Musculoskeletal Defects
- Texas leads the data with 165 cases per 10,000 live births, indicating a significantly high prevalence of musculoskeletal anomalies, which likely includes conditions like clubfoot and limb deficiencies.
- Other states did not specify detailed numbers, but higher prevalence may also be present in Arkansas and Kentucky, which are regions known for limited healthcare access in rural areas.
The high prevalence in Texas may reflect both an increased detection rate due to comprehensive surveillance and potentially higher risk factors such as environmental exposures or maternal health issues.
2. Cardiac Defects
- Texas reports 158 cases per 10,000 live births for cardiac defects, a figure consistent with national trends but indicating a substantial healthcare burden.
- Alabama shows an increased prevalence, suggesting either higher incidence or improved case detection, though specific rates are not provided.
Congenital heart defects are the most common type of birth defect nationwide. States with strong pediatric cardiology services, like Texas, may report higher prevalence due to better diagnosis and data collection. Environmental factors or maternal health (e.g., diabetes, obesity) may also contribute.
3. Neural Tube Defects
- Arkansas and Kentucky both report higher-than-national-average rates of neural tube defects, including anencephaly and spina bifida.
- Data for Texas, Alabama, and Mississippi is not specified, though these states may still experience elevated rates in certain regions.
High neural tube defect rates in Arkansas and Kentucky may correlate with inadequate folic acid intake, socioeconomic barriers, or environmental risk factors. Public health initiatives like folic acid supplementation have been shown to lower these rates.
4. Orofacial Clefts (Cleft Lip and/or Palate)
- Arkansas and Kentucky report higher prevalence of orofacial clefts than the national average, while Texas, Alabama, and Mississippi lack specified data.
- These defects are influenced by both genetic and environmental factors, including maternal smoking, diabetes, and certain medications.
Higher rates in Arkansas and Kentucky suggest possible gaps in maternal health services, nutrition education, or smoking cessation programs.
Methodology
To write this article, we first compiled and reviewed data from multiple sources, including the CDC, National Birth Defects Prevention Network, and state-level surveillance reports. We prioritized clarity and accuracy, focusing on prevalence rates and the number of babies affected each year.
From there, we structured the content to balance detailed data with context, offering readers not just numbers but also explanations of underlying causes, risk factors, and implications.
Where possible, we highlighted regional differences to give a fuller picture of how birth defect rates vary across the U.S. We also integrated recent studies, like the 2022 paper in Birth Defects Research, to ensure the information was grounded in current science.
Finally, we aimed for an engaging, approachable tone that informs readers while respecting the seriousness of the subject.
The Takeaway: Why Awareness and Early Action Matter
Birth defects affect one in every 33 babies born in the U.S.
Communities can take steps to ensure services and supports are available, information is accessible, and individuals feel supported at every stage in life. https://t.co/lJS94oQ8rM #AcrossTheLifespan pic.twitter.com/9XygJ4aMrO— CDC (@CDCgov) January 3, 2023
Birth defects affect thousands of babies across the U.S. every year, with clubfoot and Down syndrome among the most common.
While rates vary by region, the overall message is clear: early detection, access to high-quality prenatal care, and public health education are essential to reducing risks and improving outcomes.
Knowing which defects are more prevalent in certain areas helps healthcare providers and policymakers focus resources where they’re needed most.
For families, understanding these patterns can offer reassurance and guide proactive steps, from genetic counseling to connecting with local support programs. Staying informed—and advocating for strong tracking and early intervention systems—can make a real difference.
References:
- CDC – Facts About Birth Defects
- CDC – Facts About Down Syndrome
- CDC – Facts About Cleft Lip and Cleft Palate
- CDC – Facts About Esophageal Atresia
- NCBI – Prevalence of Neural Tube Defects in the United States, 2022
- NCBI – Musculoskeletal Birth Defects and National Prevalence Data