Colorado’s population continues to grow steadily, reflecting the state’s enduring appeal and economic opportunities. As of 2023, Colorado’s population reached 5.88 million, marking a 0.63% increase from the previous year.
This upward trend has been consistent over the past two decades, with the state adding approximately 1.55 million residents since 2000.
The Colorado State Demography Office reports that the state’s population growth is driven by both natural increase and net migration, with a diverse mix of age groups contributing to its demographic makeup.
Notably, the labor force participation among older adults in Colorado has been rising, with the number of employed adults aged 65 and over increasing significantly from 30,000 in 2000 to over 180,000 in 2022.
Colorado’s population dynamics are shaping its future, influencing everything from urban development to economic policies.
The state is preparing for an estimated 40,000 retirements per year over the next five years, highlighting the importance of workforce planning and the potential for new opportunities in various sectors.
Demography

Colorado population continues to grow, reaching 5.88 million in 2023 according to neilsberg.com. This represents a 0.63% increase from the previous year, maintaining the state’s trend of steady growth.
The racial composition of Colorado is diverse. White residents make up the largest group, followed by Hispanic or Latino individuals of any race. Other racial groups include Black or African American, Asian, and Native American populations.
Colorado’s age distribution is evolving. The state is experiencing an aging trend, with the 65+ age group becoming a larger share of the total population. This shift impacts various aspects of the state’s economy and social services.
Migration patterns play a significant role in Colorado’s demographics. The state has been attracting new residents, particularly to the Front Range region. However, recent data suggests a slowing in migration and mobility rates.
Birth rates in Colorado have been declining, while death rates have increased. This demographic shift contributes to the changing age structure of the state’s population.
Colorado’s population growth is not evenly distributed. The Front Range area, which includes major cities like Denver and Colorado Springs, continues to see the most significant increases in both jobs and residents.
Historical Growth Patterns

Colorado population grew rapidly in the late 1800s following the discovery of gold and silver. By 1900, the state’s population reached 539,700 according to World Population Review.
Throughout the 20th century, Colorado consistently added new residents. Growth accelerated in the latter half, with increases of around 30% between censuses.
This trend propelled Colorado past the 5 million mark in 2012. The state’s attractive natural amenities, strong economy, and high quality of life continued to draw new residents.
Recent Yearly Estimates
From 2010 to 2022, Colorado’s population increased every year as per USAFacts. The average annual growth rate during this period was 1.2%.
The largest single-year increase occurred between 2014 and 2015, with a 1.9% jump. However, growth has moderated in recent years, similar to trends seen in California.
2020-2021 saw slower growth nationally, with 17 states losing population. Colorado maintained positive growth but at a reduced rate.
Projections suggest continued population increases for Colorado, though potentially at a more modest pace than seen in previous decades.
Age Distribution
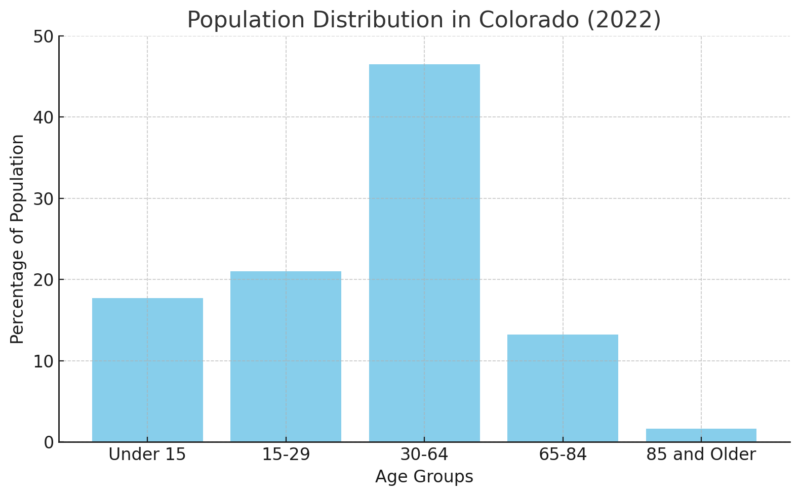
Colorado population is spread across various age groups. As of 2022, 17.70% of Coloradans were under 15 years old. The 15-29 age group comprised 20.98% of the population.
The largest segment falls within the 30-64 age range, accounting for 46.49% of residents. This group represents a significant portion of the working-age population.
Older adults aged 65-84 make up 13.22% of Colorado’s population. The 85 and older demographic represents 1.60% of residents.
Projections for 2032 indicate population growth across all age groups according to coloradocenterforaging.org. The 65 and over category is expected to see the largest increase, with an addition of 300,028 individuals.
Median Age Analysis
Colorado’s median age stands at 37.3 years, based on 2018-2022 American Community Survey estimates. This figure provides insight into the state’s overall age structure.
The median age reflects a relatively young population compared to some other states. It suggests a balanced mix of younger workers and families alongside older residents.
Colorado’s labor force participation among older adults has been rising. The number of employed adults aged 65 and over increased by 600% between 2000 and 2022, growing from 30,000 to over 180,000.
Projections indicate about 40,000 retirements per year over the next five years. This trend may impact the state’s workforce dynamics and age distribution in the coming years.
Urban vs. Rural Populations
Colorado’s population is predominantly urban. As of 2025, approximately 85% of Coloradans live in urban areas. The Front Range Urban Corridor, stretching from Fort Collins to Pueblo, houses the majority of urban dwellers.
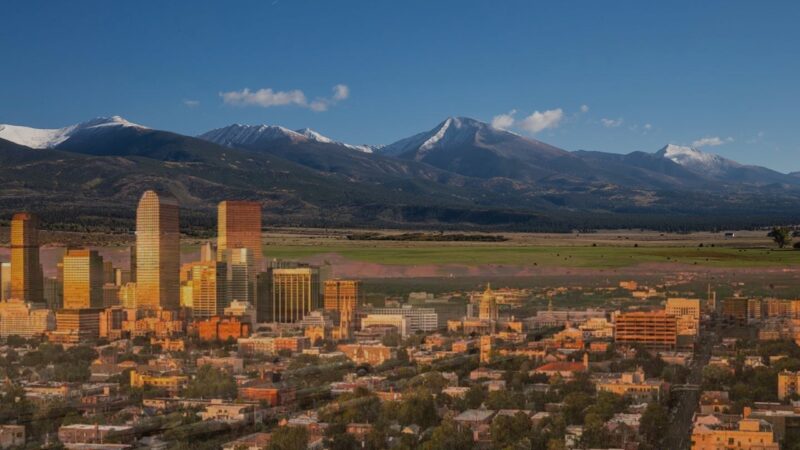
Denver, the state capital, remains the largest city. Its metropolitan area continues to grow, attracting newcomers with job opportunities and urban amenities.
Rural Colorado faces different demographic trends. Many rural counties experience population decline or stagnation. This shift affects local economies and services in these areas.
Population Density by Region
Colorado’s population density varies significantly across its regions. The state’s overall density is relatively low compared to its size, ranking as the eighth largest state by area.
The Denver metro area boasts the highest population density. Other Front Range cities like Colorado Springs and Boulder also have higher densities.
Mountain communities show lower densities, with tourism-driven towns like Aspen and Vail as exceptions. These areas see seasonal population fluctuations due to tourism.
Eastern Plains counties have the lowest population densities. Large agricultural areas and sparse settlements characterize this region.
Western Slope communities vary, with Grand Junction serving as a regional hub amidst less densely populated surroundings.
Ethnic and Racial Composition
Race
Population
% of Total Population
White
4,393,409
76.13%
Black or African American
233,712
4.05%
American Indian and Alaska Native
57,022
0.99%
Asian
185,431
3.21%
Native Hawaiian and Other Pacific Islanders
8,094
0.14%
Some other race
283,146
4.91%
Two or more races (multiracial)
609,976
10.57%
Ethnic composition is predominantly non-Hispanic, with a sizable Hispanic population. 22.07% of the total population identifies as Hispanic or Latino, representing approximately 1.27 million residents. The remaining 77.93% of the population, or about 4.5 million people, identifies as non-Hispanic.
Among the non-Hispanic population, the largest racial group is White alone. This group comprises 84.98% of the non-Hispanic population, totaling around 3.82 million individuals as stated by neilsberg.com.
The Hispanic community in Colorado has grown steadily over the years, contributing to the state’s cultural diversity. This growth has influenced various aspects of Colorado’s society, including food, music, and local traditions.
Migration and Mobility
Colorado has seen a slowing rate of population growth in recent years. From July 2021 to July 2022, the state added 28,629 residents, a notable decrease from the previous decade’s average annual growth of 74,000.
Despite this slowdown, Colorado’s growth rate of 0.5% still exceeded the national rate of 0.4%. This suggests the state remains an attractive destination for new residents.
Inbound migration continues to play a crucial role in Colorado’s population changes. More than half of the state’s population growth is attributed to people moving in from other areas.
Impacts of Inter-state Migration
The movement of people between states has significant implications for Colorado’s demographics and economy. In 2021, nearly 7.9 million people moved between states in the U.S., up from 7.4 million in 2019.
This increased mobility affects Colorado’s ability to attract and retain talent. The state faces challenges in maintaining its workforce, particularly in key industries.
Interstate migration has led to concentrated growth along Colorado’s Front Range, impacting both job markets and population distribution. This trend influences urban planning, housing demand, and infrastructure needs across the region.
Household and Family Structure

Colorado’s household and family structure has evolved significantly over the years. In 2022, married-couple households comprised 47% of all households in the United States, a notable decrease from 71% in 1970 as per census.gov.
This trend is reflected in Colorado’s diverse living arrangements. The state has seen a rise in non-traditional household structures, including single-parent families, cohabiting couples, and multigenerational households.
Family size has also changed. The average household size has decreased, aligning with national trends towards smaller families and more single-person households.
Income levels play a crucial role in family structure. Colorado’s median household income is $89,930, which is 116.17% of the U.S. median. This higher income level can influence family formation and living arrangements.
Urban areas like Denver and Colorado Springs show different household patterns compared to rural regions. Cities tend to have more diverse family structures and a higher proportion of non-family households.
The state’s changing demographics, including an aging population and increasing racial diversity, continue to shape Colorado’s household and family landscape. These shifts reflect broader societal changes and economic factors influencing how Coloradans choose to live and form families.
Economic Factors

Colorado’s labor market in 2024 shows resilience and growth. The state’s unemployment rate stands at 3.5%, lower than the national average. Employment sectors experiencing notable expansion include technology, healthcare, and renewable energy.
Colorado added 45,000 new jobs in the past year, with the fastest growth in professional and business services according to coloradu.edu. The Denver metro area continues to be a major job hub, accounting for 60% of the state’s employment opportunities.
Remote work remains prevalent, with 25% of Colorado’s workforce engaging in flexible arrangements. This trend has led to increased migration to smaller cities and rural areas, reshaping local economies.
Household Income Distribution
Colorado’s household income distribution reflects both economic strengths and challenges. The median household income in 2024 is around $89,930, surpassing the national average by 15%.
Income disparities persist across regions. Urban areas like Boulder and Denver report higher median incomes, while rural counties face economic pressures. The top 20% of earners account for 48% of the state’s total income.
Colorado’s cost of living continues to rise, particularly in housing. This impacts lower-income households disproportionately. State initiatives aim to address affordability issues through targeted tax relief and affordable housing programs.
Approximately 18% of Colorado workers participate in freelance or contract work, influencing overall income patterns.
Education Levels

Colorado’s education system demonstrates strong performance in several key areas. The state boasts an 83.1% high school graduation rate, the highest in nearly a decade as per Chalkbeat.
Public school enrollment in Colorado has seen recent changes. The 2023-24 school year recorded 881,464 students in PK-12 public schools, marking the lowest enrollment in a decade.
Rural education plays a significant role in Colorado’s educational landscape. Out of 179 school districts, 36 meet the definition of rural, while 110 are classified as small rural.
Early childhood education statistics in Colorado align with national trends.
For children aged 3-5:
- 59% are enrolled in school
- 39% attend public schools
- 20% receive private education
The enrollment rate for 5-year-olds (84%) significantly exceeds that of 3- to 4-year-olds (47%).
These figures reflect Colorado’s commitment to education across various age groups and geographical areas. The state continues to adapt its educational strategies to meet the changing needs of its diverse student population.
Healthcare Access and Demographics
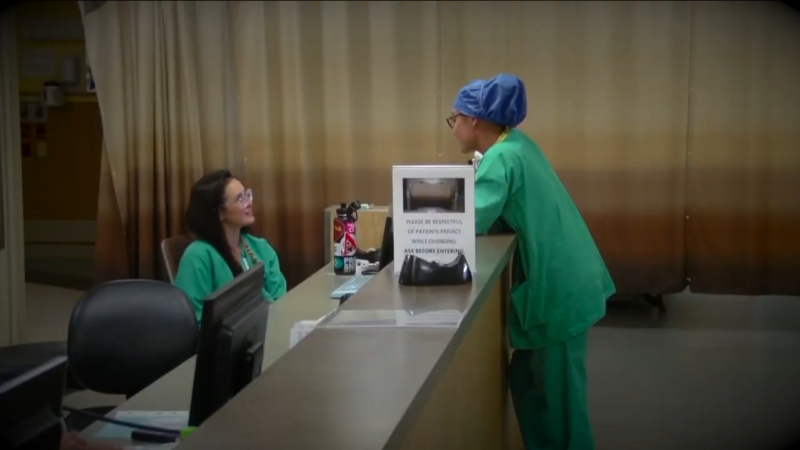
Colorado’s healthcare landscape has undergone significant changes in recent years.
The 2023 Colorado Health Access Survey provides valuable insights into the state’s health coverage and access trends.
Over 95% of Coloradans had health insurance in 2023. This high coverage rate reflects the state’s efforts to expand access to healthcare services.
The survey, which sampled nearly 10,000 households, revealed substantial shifts in health access and social stressors following the COVID-19 pandemic as per the Colorado State Demography Office.
Key findings include:
- Improved insurance coverage rates
- Changes in healthcare utilization patterns
- Increased focus on mental health services
Demographics play a crucial role in shaping healthcare needs and access.
Age distribution, racial and ethnic diversity, and geographic location all influence healthcare access and outcomes across the state.
Rural areas face unique challenges in healthcare access, including limited provider availability and longer travel distances to medical facilities.
Urban centers, while often having more healthcare resources, may struggle with issues of affordability and overcrowded facilities.
Denver has also seen record-breaking events, including sports, where the Denver Nuggets recently achieved record attendance, demonstrating the city’s growing appeal to both residents and visitors.
As Colorado’s population continues to climb, key urban centers like Denver will play a crucial role in shaping the state’s future.
Housing Market Dynamics

The Colorado housing market continues to evolve in 2024, reflecting broader population trends. Median home prices across the state have reached $559,980, marking a 5.7% increase from the previous year.
Sellers maintain an advantage in the current market conditions. Properties are selling close to their listing prices, with the average home fetching 99.3% of its asking price.
Despite challenges, the Colorado real estate market has demonstrated resilience.
The Denver metro area, in particular, has maintained strong property values, with median home prices hovering around $600,000.
Affordability remains a key concern for many prospective buyers for Colorado population. This issue is particularly pronounced in certain regions, with Mesa County experiencing the most significant increase in unaffordability from January 2023 to October 2024.
Population growth rates vary across different counties:
- Boulder: 3% growth
- Denver, Larimer, Pueblo, Weld: 4% growth
- Broomfield, Adams, Arapahoe, El Paso, Jefferson: 5% growth
These demographic shifts are influencing local housing demands and market dynamics throughout the state.
References:
References
- Colorado State Demography Office – Demographic and Budget Outlook
- Neilsberg – Colorado Population by Year
- World Population Review – Historical Growth Patterns of Colorado’s Population
- USAFacts – Population Trends in Colorado
- Colorado Center for Aging – Projections for Age Groups in Colorado
- American Community Survey – Colorado Median Age Estimates
- Colorado Health Institute – Colorado Health Access Survey 2023
- Statista – Colorado Median Household Income
- Chalkbeat – Colorado Graduation Rates
- Journal-Advocate – Public School Enrollment in Colorado
- National Center for Education Statistics – Early Childhood Education Statistics
- Norada Real Estate Investments – Colorado Housing Market
- James Hund Realty – Colorado Real Estate Market Trends
- Colorado State Demography Office – Housing Affordability Metrics