

A population parameter describes an entire population. A sample statistic describes only the sample that researchers actually measured.
That single difference sits behind a large part of inferential statistics. Researchers usually want to know something about a full population, but collecting data from every person, household, business or object can be expensive, slow or impossible. They collect a sample instead and use its statistics to estimate the unknown population parameters.
Penn State defines a parameter as a population measure and a statistic as a measure calculated from a sample. The terms can refer to means, proportions, standard deviations, correlations and many other numerical summaries.
| Population Parameter | Sample Statistic |
|---|---|
| Describes the full population | Describes the observed sample |
| Usually unknown | Calculated from collected data |
| Fixed for a defined population | Changes when the sample changes |
| Often represented by Greek letters | Often represented by Roman letters or symbols with hats and bars |
| Example: population mean μ | Example: sample mean x̄ |
| Example: population proportion p | Example: sample proportion p̂ |
What Is a Population Parameter?
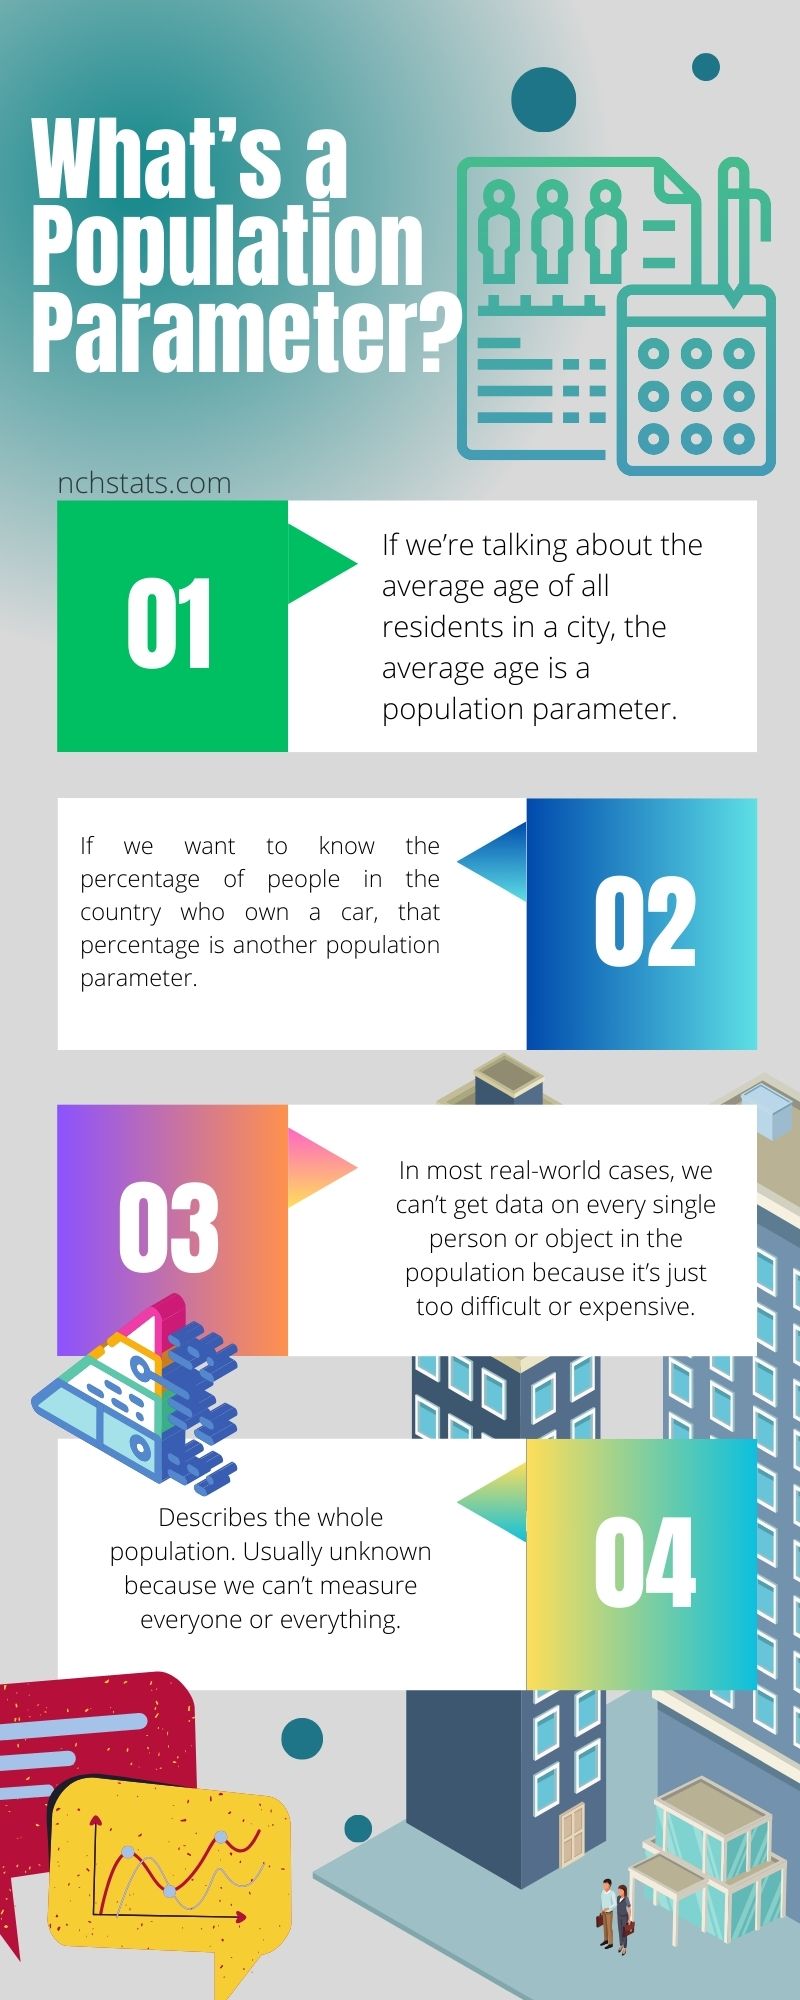
A population parameter is a numerical value describing a characteristic of the complete population being studied.
The population does not have to mean every person in a country. It is simply the full group covered by the research question.
For a study of all students at one university, the population is every student at that university. For research on registered voters in Ohio, the population is all registered Ohio voters covered by the study.
A parameter could be:
- the mean age of every student at a university
- the proportion of all city residents who own a car
- the standard deviation of incomes for every household in a county
- the correlation between two variables across the complete population
Parameter is a population summary. The key point is that the parameter belongs to the whole defined population.
A Parameter Is Fixed
Once the population and variable have been defined, its parameter has one true value at that point in time.
Suppose a university has exactly 20,000 students. If their true mean age is 22.7 years, then μ = 22.7 for that population. Drawing several samples does not change the population mean.
Researchers may not know the value, but it still exists.
Population Parameters Often Use Greek Symbols
Statistics courses use a standard set of symbols to separate population values from sample values.
| Population Measure | Common Symbol |
|---|---|
| Population mean | μ |
| Population proportion | p |
| Population standard deviation | σ |
| Population variance | σ² |
| Population correlation | ρ |
For a finite population with N observations, the population mean can be written as:
μ = ΣX / N
Here, ΣX is the sum of every value in the population and N is the total number of population members.
What Is a Sample Statistic?
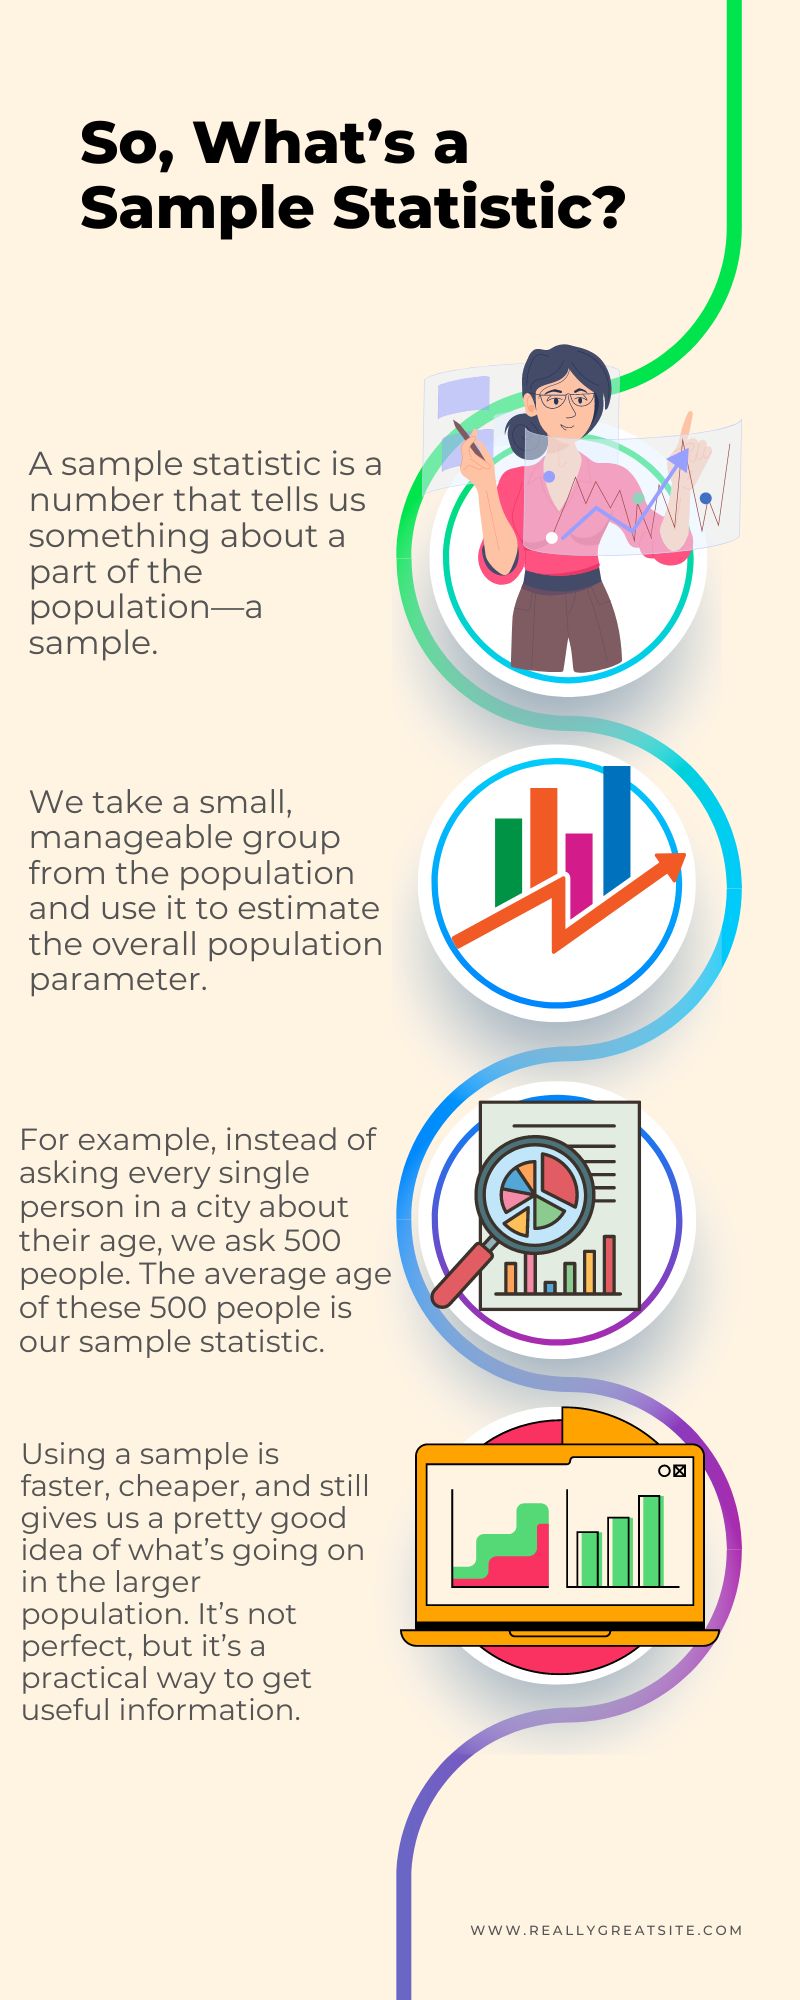
A sample statistic is calculated from the smaller group that researchers actually observe.
Suppose the university has 20,000 students, but researchers randomly select 500 and calculate their mean age. The resulting average is a sample statistic.
If those 500 students have a mean age of 22.9 years, then:
x̄ = 22.9
The researchers can use 22.9 as an estimate of the unknown population mean μ.
OpenStax defines a sample statistic as a numerical summary calculated from a sample. Sample means and sample proportions are two of the most common examples.
A Sample Statistic Changes Between Samples
Take another random sample of 500 students and the mean may be 22.6. A third sample may produce 22.8.
None of those changes alter the full university population. They occur because each sample contains a different collection of students.
Sample statistics represents random variables because statistics vary across possible samples. Population parameters remain fixed for the defined population.
Population Parameter and Sample Statistic Side by Side
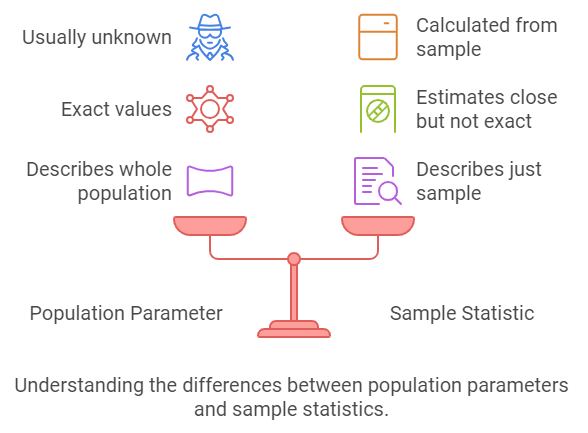
| Feature | Population Parameter | Sample Statistic |
|---|---|---|
| Data source | Entire population | Observed sample |
| Value | Fixed for the defined population | Varies from sample to sample |
| Known or unknown | Often unknown | Known after sample data are collected |
| Main purpose | Quantity researchers want to know | Quantity used to estimate the parameter |
| Mean | μ | x̄ |
| Proportion | p | p̂ |
| Standard deviation | σ | s |
| Variance | σ² | s² |
| Correlation | ρ | r |
A Simple Example With a Population Mean
Assume a company wants to know the mean commute time for all 8,000 employees.
The real mean commute time for all 8,000 employees is the population parameter μ. Researchers would have to obtain usable commute information from every employee to calculate that exact population value directly.
Instead, the company randomly surveys 400 employees and gets a mean commute time of 31.4 minutes.
- Population: all 8,000 employees
- Parameter: true mean commute time for all 8,000 employees
- Sample: 400 surveyed employees
- Statistic: x̄ = 31.4 minutes
The 31.4-minute sample mean provides an estimate of the unknown population mean. A second random sample would probably produce a slightly different number.
The Same Idea Works With Percentages
Parameters and statistics are not limited to averages.
Assume a city wants to know the proportion of all adult residents who use public transportation at least once a week.
The actual proportion among every adult resident is the population parameter p. If researchers survey 1,000 adults and 380 report weekly public-transport use, the sample proportion is:
p̂ = 380 / 1,000 = 0.38
The sample statistic is therefore 38%. Researchers can use that result to estimate the true population proportion.
Why Researchers Use Samples
Measuring an entire population is sometimes possible. A company with 40 employees could collect information from everyone. Government censuses also attempt very large population counts.
Many research questions involve populations that are too large, expensive or difficult to measure completely. A national opinion survey does not need to interview hundreds of millions of people to estimate public opinion.
A carefully designed probability sample gives researchers a manageable dataset and a mathematical way to describe uncertainty.
Our data sources and methodology explains why source quality and definitions are important when interpreting published statistics.
Sampling Error Is Expected
A sample statistic will rarely equal the population parameter exactly.
The U.S. Census Bureau defines sampling error in sample surveys as variation caused by observing a sample instead of the complete population.
Suppose the true mean household income in a population is $70,000. A random sample could produce $69,200. Another could produce $70,600.
The sample estimates move because different households were selected.
Sampling Error Is Not a Research Mistake
The word error can sound as if somebody did something wrong. Sampling error can exist even when a probability sample is designed and collected correctly.
It comes from using only part of the population.
The Census Bureau explains that repeated probability samples from the same population produce different estimates. Standard errors measure the amount of sampling variability associated with those estimates.
Standard Error Shows How Much Statistics Vary
The standard error describes the variability of a statistic across repeated samples.
For a sample mean under the standard independent-sampling model, the standard error is:
SE(x̄) = σ / √n
The formula explains an important property of sample size. Increasing n reduces the standard error when the other conditions stay the same.
OpenStax gives the same standard error formula for means.
The square root in the denominator is important. Increasing a sample from 100 people to 400 does not reduce the standard error by four times. It reduces it by about half.
Margin of Error Adds a Range Around an Estimate
A poll reporting 52% support for a proposal is giving a sample statistic. The true population percentage is usually unknown.
Researchers therefore report uncertainty around the estimate. A result might appear as 52% with a margin of error of plus or minus 3 percentage points.
The U.S. Census Bureau explains that a margin of error describes uncertainty associated with an estimate produced from a sample.
A margin of error should not be read as a guarantee that the sample is unbiased. It describes sampling uncertainty under the statistical method being used.
A Larger Sample Does Not Fix Bias
Increasing sample size generally reduces sampling variability, but size alone does not rescue a badly selected sample.
Imagine an election survey that collects 100,000 responses only from visitors to one political website. The sample is enormous, but it may represent that website audience far better than the voting population.
A smaller probability sample can provide a more defensible estimate because the selection process gives members of the target population a known chance of inclusion.
The Census Bureau separates sampling error from other sources of survey error, including nonresponse, coverage problems, recording errors and mistakes in data processing.
Common Sampling Methods
The way researchers select the sample affects what they can infer from it.
Simple Random Sampling
Every member of the population has a defined chance of selection, and selections are made through a random process.
A random sample helps prevent researchers from deliberately or accidentally filling the sample with one preferred group.
Stratified Sampling
Researchers first divide the population into relevant groups, called strata, and then sample within those groups.
A university survey could create strata for undergraduate and graduate students, then select respondents from both. The design ensures that each defined group contributes observations.
Cluster Sampling
The population is divided into natural groups, and researchers randomly select some groups for observation.
A school study could select several schools and collect data from students within those schools rather than drawing individual students from every school in the region.
Convenience Sampling
A convenience sample uses participants who are easiest to reach.
An online poll open to anyone who clicks a link is one example. The resulting statistic accurately describes the people who responded, but extending that result to a wider population can be difficult because participation was not randomly assigned.
Parameter, Statistic and Estimator Are Not the Same Term
Three closely related words are easy to mix up.
A parameter is the population quantity researchers want to know. A statistic is a number calculated from observed sample data.
An estimator is the rule or formula used to produce an estimate of the parameter.
For example, researchers may use the sample mean x̄ as an estimator of the population mean μ. After they collect one particular sample and calculate x̄ = 31.4, the value 31.4 is the estimate produced by that estimator.
One Sample Does Not Reveal the Exact Population Value
A common mistake is to treat a survey estimate as if researchers measured every member of the population.
Suppose a report says 41% of adults support a policy. If the result came from a probability sample, 41% is the observed sample proportion p̂. The unknown population proportion p is what the survey is trying to estimate.
The Census Bureau uses margins of error for the same reason in products such as the American Community Survey. Its ACS sampling guidance states that estimates based on samples carry uncertainty and that larger samples generally reduce sampling error.
How Confidence Intervals Connect Statistics and Parameters
A confidence interval uses a sample statistic and its estimated uncertainty to produce a range for an unknown population parameter.
Confidence interval is a range calculated from sample statistics to estimate an unknown parameter at a stated confidence level.
For example, a survey may estimate voter support at 52% with a 95% confidence interval from 49% to 55%.
The sample proportion remains 52%. The interval communicates the uncertainty involved in using that sample to estimate the population proportion.
How to Read Statistics in News and Research
A reported number becomes much easier to interpret once the population and sample are identified.
For any survey result, four details are especially useful:
- Target population. Identify the full group the study is trying to describe.
- Sample. Find out who or what was actually measured.
- Statistic. Identify the result calculated from those observations.
- Uncertainty. Look for the standard error, margin of error, confidence interval or another measure of precision.
Sampling design deserves just as much attention as sample size. A very large convenience sample can still give a misleading estimate of a population parameter.
Population Parameter and Sample Statistic in One Example
Suppose researchers want the mean annual income of all 100,000 households in a city.
| Statistical Element | Example |
|---|---|
| Population | All 100,000 households |
| Parameter | True mean income of all 100,000 households |
| Parameter symbol | μ |
| Sample | 2,000 selected households |
| Statistic | Mean income calculated from those 2,000 households |
| Statistic symbol | x̄ |
| Statistical goal | Use x̄ to estimate μ |
The entire relationship can be reduced to one line:
Population → unknown parameter → sample → observed statistic → estimate of the parameter
A parameter describes the population researchers care about. A statistic comes from the sample they can actually measure. Inferential statistics provides the methods for using the second number to learn about the first.