
Iowa population is projected to be 3.21 million, reflecting consistent growth patterns observed over the past decade.
These numbers hint at a sustainable population increase rooted in economic and social factors unique to the state.
An examination of Iowa’s recent history shows an average growth rate of 0.4% per year from 2010 to 2022 according to World Population Review.
This steady incline demonstrates the state’s ability to retain residents and attract newcomers to its vibrant communities.
Such growth is also observed in several urban areas, contributing to shifts in geographic growth patterns across various regions of Iowa.
Key Takeaways
Demographics
Iowa’s population is approximately 3,214,315 in 2024. This reflects a steady increase from previous years, following a consistent growth pattern since 2010. The state has experienced moderate growth rates over the past decade.
Racial and Ethnic Composition
Race
Percentage
White
87.93%
Two or more races
3.89%
Black or African American
3.74%
Asian
2.49%
Other race
1.47%
Native American
0.34%
Native Hawaiian or Pacific Islander
0.13%
Population Trends
From 2010 to 2022, Iowa experienced population growth each year, with the most significant increase of 1% between 2019 and 2020. Average growth during this period was about 0.4% annually. The population change dynamics continue to be influenced by both births and migration patterns.
Gender Distribution and Median Age

- Male: 1,590,001 (50.01%)
- Female: 1,589,089 (49.99%)
Median Age
- Overall: 38.3 years
- Male: 37.4 years
- Female: 39.2 years
Age Dependency Ratios
Iowa’s population dependency reflects the number of children and elderly relying on the working-age population:
- Total Age Dependency Ratio: 67.6
- Old Age Dependency Ratio: 28.5 (seniors to working-age adults)
- Child Dependency Ratio: 39.1 (children to working-age adults)
Adult and Senior Population

- Total Adults: 2,436,915
- Senior Citizens (65+ years): 540,542
Seniors represent approximately 22% of the total adult population, indicating a significant aging demographic.
Population Pyramid Breakdown (2024)
Iowa population pyramid shows the distribution of different age groups for both males and females. The pyramid suggests a population with a strong middle-age group, especially from 30 to 50 years of age, with a tapering off toward older ages. Here’s the distribution:
Age Group
Male Population
Female Population
0 – 10 years
~120,000
~120,000
10 – 30 years
~80,000 – 100,000
~80,000 – 100,000
30 – 50 years
~60,000 – 90,000
~60,000 – 90,000
50 – 70 years
~40,000 – 70,000
~40,000 – 70,000
70+ years
Tapers off
Tapers off
- Iowa’s population is aging, with a median age of 38.3 years.
- The child dependency ratio (39.1) is higher than the old-age dependency ratio (28.5), indicating a larger proportion of children compared to seniors.
- Despite a slight tilt in favor of males, the gender distribution is nearly balanced.
- The growing senior population (over half a million) emphasizes the importance of healthcare and retirement support systems in the state.
Sex Ratio
- The sex ratio in Iowa shows a nearly 1:1 balance between men and women, with males making up a slightly larger portion of the population (50.01%).
Population Growth Trends
Historical Growth Patterns
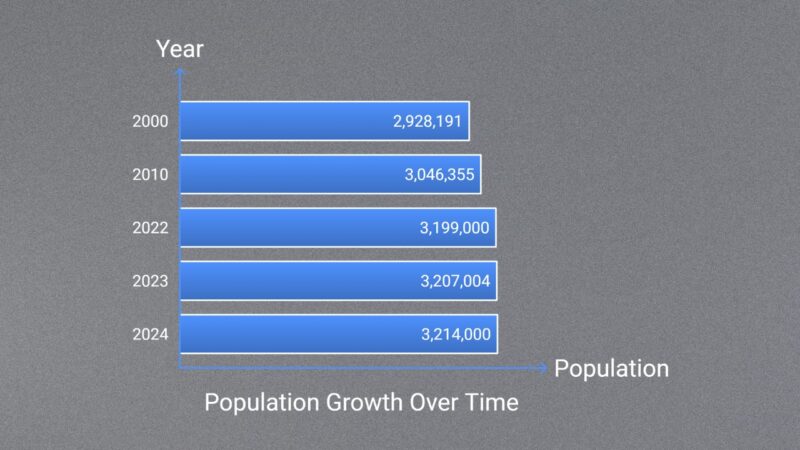
Iowa’s population has demonstrated consistent growth over the years, notably between 2000 and 2023, when the number increased by 278,813 people. This period saw the population reaching 3.21 million in 2023, its peak so far.
The population growth over the last 20 years represents an important demographic trend, reflecting economic and social changes in the state. Historical data from the Census Bureau places Iowa as the 30th most populous state, emphasizing its steady climb since surpassing the 3 million mark in 2010.
Current Year Estimates
In 2023, Iowa’s population was about 3,207,004, showing a 0.23% increase from the previous year.
This growth highlights a stable upward trend, aligning with national patterns. Estimates for 2024 are expected to reflect continued growth, despite economic and social factors that might influence demographic shifts.
The slight yet consistent annual growth rate showcases Iowa’s resilience in population expansion and indicates positive trends for local development and urban planning.
Growth Rate Projections
Future projections suggest a continued rise in Iowa’s population, supported by historical trends and current estimates. The state’s growth rate averaged 0.4% annually between 2010 and 2022, with some years reaching up to a 1% increase.
These projections from USA Facts provide a blueprint for policymakers and investors aiming to capitalize on Iowa’s demographic trends. Expected growth is likely to affect infrastructure, education, health care, and employment sectors, requiring strategic planning and investment to sustain thriving communities in the state.
Population by County
Iowa consists of 99 counties, each with varying population densities and growth patterns. Polk County, home to Des Moines, is the most populous, highlighting significant urban concentration. Linn County, containing Cedar Rapids, also shows substantial population numbers. In contrast, counties like Adams exhibit lower population figures, reflecting rural characteristics.
Counties near metropolitan areas tend to experience more growth. For example, Dallas County has been one of the fastest-growing due to suburban expansion near Des Moines. Economic factors, such as employment opportunities and amenities, often influence these population distributions.
Rank
County
Population
1
Polk County
505,255
2
Linn County
228,972
3
Scott County
174,270
4
Johnson County
157,528
5
Black Hawk County
130,471
6
Dallas County
111,092
7
Woodbury County
105,951
8
Dubuque County
98,887
9
Story County
98,566
10
Pottawattamie County
93,179
11
Warren County
55,205
12
Clinton County
46,158
13
Cerro Gordo County
42,406
14
Muscatine County
42,218
15
Marshall County
40,014
16
Des Moines County
38,253
17
Jasper County
37,919
18
Webster County
36,485
19
Sioux County
36,246
20
Wapello County
35,166
21
Marion County
33,770
22
Lee County
32,565
23
Boone County
26,590
24
Benton County
25,796
25
Plymouth County
25,722
26
Bremer County
25,307
27
Washington County
22,560
28
Mahaska County
21,874
29
Jones County
20,900
30
Buchanan County
20,691
31
Buena Vista County
20,567
32
Carroll County
20,522
33
Winneshiek County
19,815
34
Henry County
19,547
35
Jackson County
19,342
36
Fayette County
19,210
37
Poweshiek County
18,453
38
Cedar County
18,302
39
Dickinson County
18,056
40
Delaware County
17,600
41
Madison County
16,971
42
Clayton County
16,969
43
Tama County
16,833
44
Clay County
16,511
45
Hardin County
16,463
46
Iowa County
16,381
47
Crawford County
16,013
48
Jefferson County
15,440
49
Floyd County
15,326
50
Page County
15,014
51
Hamilton County
14,729
52
Harrison County
14,670
53
Mills County
14,633
54
Kossuth County
14,396
55
Butler County
14,172
56
Allamakee County
14,074
57
O’Brien County
14,012
58
Cass County
13,130
59
Wright County
12,656
60
Grundy County
12,384
61
Lyon County
12,324
62
Appanoose County
12,119
63
Union County
11,906
64
Shelby County
11,806
65
Chickasaw County
11,658
66
Cherokee County
11,605
67
Guthrie County
10,722
68
Hancock County
10,615
69
Winnebago County
10,571
70
Mitchell County
10,518
71
Louisa County
10,513
72
Montgomery County
10,139
73
Keokuk County
9,914
74
Franklin County
9,875
75
Calhoun County
9,763
76
Sac County
9,686
77
Clarke County
9,588
78
Humboldt County
9,500
79
Howard County
9,376
80
Emmet County
9,229
81
Davis County
9,169
82
Palo Alto County
8,810
83
Lucas County
8,747
84
Greene County
8,584
85
Monona County
8,493
86
Decatur County
7,665
87
Monroe County
7,504
88
Adair County
7,389
89
Worth County
7,297
90
Van Buren County
7,266
91
Pocahontas County
6,976
92
Ida County
6,833
93
Wayne County
6,557
94
Fremont County
6,458
95
Osceola County
5,978
96
Taylor County
5,924
97
Audubon County
5,534
98
Ringgold County
4,642
99
Adams County
3,544
Education Levels
Education in Iowa is a strong determinant of socioeconomic status, with the state outperforming national averages in high school completion rates. According to the latest data from the U.S. Census Bureau:
- 93.5% of adults (aged 25 and older) in Iowa have completed high school, which is higher than the national average of 89.6%.
- 32.3% of adults hold a bachelor’s degree or higher, which is slightly below the U.S. average of 35.7%as per Census Reporter
However, despite strong educational outcomes, disparities exist, particularly between urban and rural regions:
- Urban areas like Des Moines and Iowa City benefit from proximity to universities and resources, leading to higher educational attainment.
- Rural areas, however, face challenges such as limited access to advanced educational facilities and resources. Addressing these disparities is crucial to ensure equitable education opportunities across the state.
Income Distribution
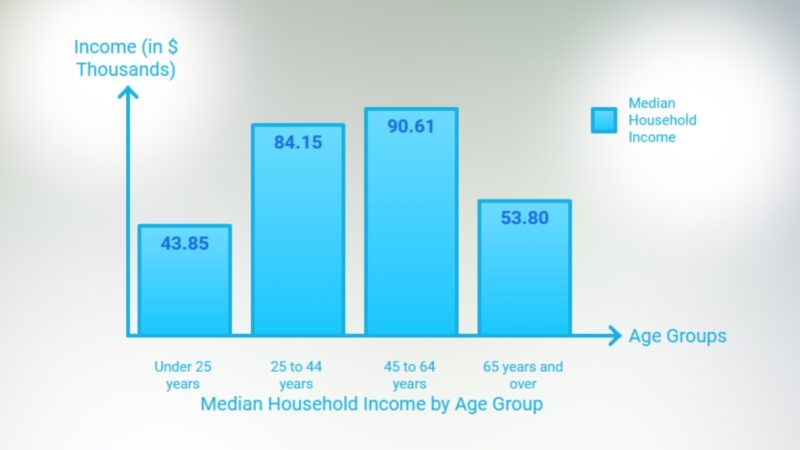
Income distribution in Iowa reveals both stability and disparity. Below is a table summarizing the income levels across various age groups in Iowa:
- Median Household Income: In 2024, the overall median household income in Iowa stands at $73,482, slightly lower than the national median of $74,755 according to Neilsberg
- Urban vs. Rural: Urban counties such as Polk and Linn report significantly higher income levels than more rural areas. This disparity reflects the broader national trend where urbanization correlates with higher wages and job diversity.
Key Points on Income Disparity
- Middle-income bracket stability: A large proportion of the population in Iowa falls within the middle-income range, supported by the state’s robust agricultural economy and growing business sectors like healthcare and education.
- Challenges in rural areas: Rural areas, where farming dominates, are particularly vulnerable to income fluctuations due to agricultural productivity and market volatility. Farming-dependent households face risks such as wage stagnation, and sectors like manufacturing and trade also exhibit limited wage growth
Iowa’s Labor Market and Economic Factors
- Unemployment Rate: Iowa has a relatively low unemployment rate of 2.8% in 2024, highlighting a stable labor market. However, some rural areas face higher unemployment rates, and certain sectors, like manufacturing, have seen slight declines as noted in the BLS report.
- Agricultural Influence: Agriculture remains a key driver of income in rural Iowa, with income levels closely tied to farm productivity and market conditions
Over the past decade, income trends have shown significant growth across all age groups, with no declines reported between 2012 and 2022. The most pronounced increase was seen in the 25-year-old age group, where household income surged by $8,776 (a 25.02% rise), growing from a median of $35,074 in 2012 to $43,850 in 2022.
In contrast, the 45 to 64-year-old age group experienced the smallest income growth, with a more modest increase of $6,121 (a 7.25% rise), from $84,484 in 2012 to $90,605 in 2022.
Impact of Migration
Migration patterns have significantly influenced Iowa’s demographic landscape. In 2021, Iowa experienced the migration of 1,188 individuals leaving the state, resulting in a loss of $259,644,000 in Adjusted Gross Income (AGI). This movement represented a small fraction, only 0.4%, of the state’s total population at that time.
The influx of new residents from states like California, Illinois, and Nebraska counterbalances this loss. These areas are primary contributors to the incoming migration to Iowa, supporting growth in various sectors.
Pandemic-related shifts in domestic migration have altered traditional patterns in the United States. For example, in 2021, approximately 7.9 million people relocated across state lines. This figure marked an increase from almost 7.4 million in 2019, influenced by the COVID-19 pandemic’s widespread impact on work and lifestyle adjustments.
Title 42’s expiration in 2023 brought attention to the impact of border policies on states like Iowa. Communities anticipated a surge of migrants due to changes in federal policies, highlighting the continued significance of migration on local demographics and economies.
Migration impacts are also observed in localized population changes. For instance, Sioux Center, Iowa, reports a rapid increase in population numbers, spurred by immigrants from Mexico and Central America. This trend is an exception in a broader pattern of decreasing birth rates across the U.S.
Housing and Real Estate Trends
The Iowa housing market in 2024 exhibits notable trends, with a supply of approximately two months and 11,787 homes for sale. The median home price is around $244,900, reflecting a potential for a decrease due to rising inventory levels in late 2024.
The sale-to-list price ratio stands at 98.3%, showing a slight year-over-year decline. A look at Zillow’s data reveals that the median sale price as of July 2024 is approximately $221,509, with the median list price in August 2024 at $249,967.
Median Home Price Trends
- April 2023: $231,600
- Growth in 2024: 3.0%
Compared to the national median home price of $433,558, Iowa’s market remains more affordable, indicating a more accessible market for home buyers.
Real estate professionals, represented by the Iowa Association of REALTORS®, anticipate a potential market resurgence. Updates and trends are regularly published, reflecting data collated through multiple listing services. Insights from sources such as the Iowa Association of REALTORS®contribute to ongoing understanding of the market dynamics and help provide clear expectations.
City
Median ZHVI
Nevada
$229,977
Roland
$238,177
Gilbert
$304,569
Ames
$262,236
McCallsburg
$223,213
Story City
$258,748
Colo
$225,154
Zearing
$200,096
Randall
—
Gilbert stands out with the highest median ZHVI at $304,569, suggesting a relatively higher home price in comparison to the other cities listed. On the lower end, Zearing has the most affordable housing market, with a median ZHVI of $200,096.
Some other notable cities include:
- Ames, a larger city and home to Iowa State University, where the median home price sits at $262,236, positioning it in the middle of the range.
- Roland and Nevada have comparable home prices, with Roland slightly higher at $238,177 compared to Nevada’s $229,977.
- Smaller towns like McCallsburg and Colo also have relatively lower median home prices, below the $230,000 mark.
Employment and Labor Force Statistics

- Labor Force Participation Rate (LFPR): As of July 2024, Iowa’s LFPR was 66.7%, reflecting a slight decline from earlier in the year and below pre-pandemic levels according to YCharts
- Unemployment Rate: Bureau of Labor Statistics notes that Iowa’s unemployment rate has remained relatively low in 2024, hovering around 2.8% to 2.9% throughout much of the year. This rate places Iowa among the states with the lowest unemployment levels in the U.S
- Labor Force Size: The total labor force in Iowa has experienced a decrease over the past year, dropping from approximately 1.711 million in July 2023 to 1.686 million in July 2024, representing a 1.5% reduction
- Employment: Total nonfarm employment remained stable at about 1.61 million jobs in the summer of 2024, with fluctuations in certain sectors, such as construction and education as per Common Sense Institute
Sector-Specific Trends
- Construction and Manufacturing: Construction showed moderate job growth, adding around 100 jobs in early 2024. However, manufacturing experienced a slight decline in employment, losing approximately 400 jobs
- Trade, Transportation, and Utilities: This sector, which is Iowa’s largest, finally recovered to pre-pandemic employment levels. However, small declines were seen in May and June
- Professional and Business Services: Despite a slight dip in employment in May 2024, this sector has been one of the top performers since 2020, adding over 9,500 jobs during the post-pandemic recovery
- Government Employment: The government sector added 2,500 jobs between December 2023 and May 2024, with job growth continuing at a steady pace
Job Openings and Growth

- Job Openings: As of May 2024, there were over 54,000 job openings in Iowa, with the most demand in healthcare (particularly registered nurses), retail, and administrative roles
- Long-Term Job Growth: Since January 2020, Iowa has added more than 22,000 jobs in net, with notable gains in professional services and construction
Methodology
The data used in this report was gathered from a variety of trusted sources, including the U.S. Census Bureau, World Population Review, Bureau of Labor Statistics (BLS), and other governmental and real estate organizations. These sources provided information on Iowa’s population growth, demographics, economic factors, housing trends, and labor market conditions.
For population estimates, historical data from 2010 to 2024 was analyzed to understand growth patterns and project future trends. Data on racial, ethnic, and age demographics, as well as dependency ratios, were sourced from census reports. County-level population figures were derived from regional sample statistics, reflecting urban and rural differences across Iowa.
Economic factors, such as income distribution and employment rates, were obtained from the BLS, Census Reporter, and industry reports. Housing and real estate trends were compiled using data from Zillow and the Iowa Association of REALTORS®. Migration patterns were examined using migration studies and tax filings.