
As of early 2025, the United States federal government employs just over 3 million civilian workers across all agencies. This makes the federal government the nation’s largest employer, accounting for roughly 1.9% of the entire U.S. workforce according to PewResearch.org.
Importantly, this 3 million figure includes about 600,000 U.S. Postal Service employees (the Postal Service is a quasi-independent federal agency).
If we exclude the Postal Service, the federal civilian workforce is on the order of 2.4 million people.
In addition to civilian employees, the federal workforce also encompasses the country’s uniformed military personnel. Approximately 1.3 million active-duty military members are serving in 2025.
While active-duty service members aren’t usually counted as “civilian employees,” they are a significant part of the federal payroll. If we combine civilian employees (around 3.0 million) and active-duty military (~1.3 million), the total federal workforce in 2025 is roughly 4.3 million people on the government’s direct payroll.
Overview

To put these numbers in perspective, one in every 53 U.S. workers is a federal employee (about 1.9% of all U.S. jobs). That percentage has been fairly steady in recent years, even as the raw headcount has inched up.
The federal workforce remains huge, but it’s not growing explosively – in fact, today’s federal workforce is about the same size as it was in the late 1960s and 1980s, when considering civilian employees, and significantly smaller as a share of the total workforce than it was in those decades.
Full-Time vs. Part-Time/Temporary
The vast majority of federal civilian workers are full-time, permanent employees. According to the Office of Personnel Management (OPM), as of late 2024, about 2.1 million federal workers were full-time permanent staff.
This suggests roughly 85–88% of federal civilian employees hold full-time permanent positions, with the remainder in part-time, seasonal, or temporary roles (for example, short-term Census takers or temporary project staff).
For instance, the once-a-decade Census can cause a temporary spike in federal hiring – during the 2020 Census, the federal headcount jumped by several hundred thousand for a few months.
Aside from such temporary bumps, the core federal civil service is predominantly career staff. The Postal Service likewise has a mix of career and non-career employees; about 80% of postal workers are career permanent staff while roughly 20% are “non-career” or temporary positions, as noted by Pew Research Center.
Finally, note that the figures above do not include the large workforce of federal contractors and grant-funded employees, whom the government hires indirectly.
Some research (e.g., by Paul C. Light and the Volcker Alliance) has estimated that if you count contractors, grant-funded personnel, and active-duty military together with civil servants, the “true” federal workforce would be many millions higher.
However, in terms of direct government employees (civilian and military), the count in 2025 stands at around 4.3 million people.
Where Do Federal Employees Work? – Breakdown by Department and Agency
Department/Agency
Employees (approx.)
Notes
Defense (DOD)
~764,000 civilians + 1,300,000 active military
(Total ~2.06 million). Largest overall; includes Army, Navy, Air Force, and Defense agencies.
Veterans Affairs (VA)
~486,000
Second-largest civilian agency; operates the VA health system.
Homeland Security (DHS)
~260,000
Includes TSA, CBP, ICE, FEMA, Secret Service, Coast Guard (~41k military).
Postal Service (USPS)
~600,000
Semi-independent. Handles mail delivery nationwide (down from ~900k in 1999)
Justice (DOJ)
~117,000
Includes FBI, DEA, U.S. Marshals, Bureau of Prisons, etc.
Treasury
~96,000
Includes IRS (~80k) and financial bureaus (Mint, etc.).
Health & Human Services (HHS)
~88,000
Includes NIH, CDC, FDA, Medicare/Medicaid offices.
Agriculture (USDA)
~85,000
Includes the Forest Service, food inspectors, and farm services.
Interior
~63,000
Manages National Parks, public lands, and wildlife refuges.
Social Security Admin (SSA)
~59,000
Handles Social Security retirement and disability programs.
Transportation (DOT)
~55,000
Includes FAA (~45k air traffic controllers & staff).
Commerce
~47,000 (peacetime)
Spikes every 10 years with the Census (temporary hires). NOAA and Patent Office included.
Labor
~14,000
Includes OSHA, BLS, and job training administration.
State
~14,000 (civil service)
+ ~13,000 Foreign Service officers/specialists (diplomats).
Energy
~16,000
Small core staff; most work done via contractors at labs.
Housing & Urban Dev (HUD)
~8,000
Administers housing programs and urban grants.
Education
~4,200
Smallest department: grants and student loan admins.
EPA (independent)
~14,000
Environmental Protection Agency.
NASA (independent)
~18,000
National Aeronautics and Space Administration.
GSA (independent)
~12,000
General Services Administration (government facilities & procurement).
[Others]
(Various smaller agencies)
e.g. FEMA (~20k including disaster reservists), NSF (~2k), SBA (~8k), etc.
Department of Defense (DOD)

DOD has about 764,000 civilian employees, as it is noted by govexec.com (spread across the Department of the Army, Navy, Air Force, and various defense agencies), plus roughly 1.3 million active-duty uniformed military personnel.
In total, DOD (military + civilian) employs on the order of 2.06 million people in 2025 – nearly half the entire federal workforce.
The civilian DOD staff includes everything from defense engineers and procurement officials to base support personnel, while the uniformed side includes Army soldiers, Navy sailors, Air Force and Space Force personnel, Marines, and Coast Guardsmen (the Coast Guard is counted under Homeland Security in peacetime).
If we count just civilian workers, DOD is still the single largest federal employer of its multiple service departments (Army, Navy, Air Force), each having well over 150,000 civilian staff.
Department of Veterans Affairs (VA)
The largest federal employer outside DOD, the VA, has about 486,000 employees. This is by far the largest headcount of any single Cabinet-level department.
Most VA employees work in the Veterans Health Administration, staffing the nation’s VA hospitals, clinics, and nursing homes as doctors, nurses, technicians, and support personnel.
The VA’s workforce has grown in recent years to meet increased demand for veterans’ healthcare and benefits. (Notably, VA’s 486k employees outnumber the combined workforces of several small Cabinet departments put together!)
Department of Homeland Security (DHS)
Around 260,000 employees. DHS is one of the biggest federal employers, encompassing agencies like U.S. Customs and Border Protection (CBP), the Transportation Security Administration (TSA), Immigration and Customs Enforcement (ICE), the Secret Service, the Federal Emergency Management Agency (FEMA), and the Coast Guard.
DHS’s workforce includes both civilian employees and about 41,000 active-duty Coast Guard military personnel (the Coast Guard is unique as a military service under DHS). Major components of DHS include the Border Patrol and customs officers (~60,000+), TSA’s airport security screeners (~50,000), and FEMA’s emergency response staff.
According to DHS, it takes “the hard work of more than 260,000 employees” to fulfill its mission of keeping America safe.
United States Postal Service (USPS)
The US post office has 600,000 human beings working there & they come into contact with dozens of customers or colleagues every day.
What if more of those 600,000 employees were like Ms. Williams? What kind of difference would that make? #workingoutloud https://t.co/7k7IuFfhU1
— Working Out Loud® (@workingoutloud) January 18, 2024
Approximately 600,000 to 630,000 employees work for the Postal Service, as noted by fred.stlouisfed.org, making it the single largest federal agency by workforce. (USPS would rank third after DOD and VA if we compared headcounts.)
However, USPS is often tallied separately due to its self-funding status and unique mission. Postal workers are spread across every city and town, handling mail delivery and operations.
It’s worth noting that the USPS workforce peaked in 1999 at around 900,000 employees and has since dropped by about one-third due to automation, electronic communication replacing letters, and cost-cutting measures.
For the past decade, USPS employment has held roughly steady around the 600,000 level. These include letter carriers, mail sorters, postmasters, and clerks, about 80% of whom are full-time career employees and 20% in transitional or part-time roles.
Department of Justice (DOJ)
Approximately 115,000–117,000 employees. DOJ includes law enforcement and legal agencies such as the FBI, the Drug Enforcement Administration (DEA), the U.S. Marshals Service, the Bureau of Prisons, and the 94 U.S. Attorney’s Offices, as well as thousands of lawyers and support staff at the main Justice Department.
A huge portion of the DOJ’s workforce works in federal prisons or law enforcement roles. For example, the Bureau of Prisons employs over 35,000 correctional officers and staff, and the FBI about 35,000 as well. DOJ’s headcount has stayed roughly around 115k in recent years, according to usgovernmentmanual.gov.
Department of the Treasury
Around 95,000–96,000 employees. Treasury’s workforce includes the Internal Revenue Service (IRS), by far its biggest component, along with the U.S. Mint, the Bureau of Engraving and Printing, the Office of the Comptroller of the Currency, and other fiscal bureaus.
IRS employees (revenue agents, examiners, customer service reps, etc.) make up the lion’s share – the IRS alone has on the order of ~80,000 employees (with recent budget boosts aimed at hiring more auditors).
The rest of Treasury’s staff (approx. 15,000) cover everything from printing currency to enforcing finance laws.
Department of Health and Human Services (HHS)
View this post on Instagram
Around 83,000–88,000 employees, HHS includes major public health agencies like the National Institutes of Health (NIH), the Centers for Disease Control and Prevention (CDC), the Food and Drug Administration (FDA), and the Centers for Medicare & Medicaid Services (CMS), among others.
For example, NIH’s research campuses employ a large number of scientists and staff, and the FDA has thousands of inspectors and regulators.
HHS employees tend to be highly educated professionals (doctors, scientists, public health experts). The department’s workforce grew modestly with initiatives like healthcare reform and responses to public health emergencies.
Department of Agriculture (USDA)
Approximately 84,000–92,000 employees. USDA’s far-flung workforce includes agencies such as the Forest Service (which alone accounts for over 30,000, including wildland firefighters), the Farm Service Agency, the Food Safety and Inspection Service (meat and poultry inspectors nationwide), the Agricultural Research Service, and the Animal and Plant Health Inspection Service.
Many USDA employees work outside D.C., in national forests, county extension offices, and food inspection labs across the country. USDA had been near 100k employees in recent years and has seen some reductions through retirements and occasional reorganization.
Department of the Interior
Around 56,000–63,000 employees, the Interior Department manages America’s vast public lands and natural resources through agencies like the National Park Service (NPS), Bureau of Land Management (BLM), U.S. Fish and Wildlife Service, Bureau of Indian Affairs, and others.
The Park Service employs the largest share of Interior’s staff (with rangers, guides, firefighters, etc., spread across all the national parks).
BLM and the Bureau of Reclamation also have sizeable field staff managing land use and water projects. Interior’s headcount has been relatively stable, though there are often seasonal employees (e.g., extra park rangers in summer).
Social Security Administration (SSA)

About 59,000 employees. Although not a Cabinet department, SSA is one of the largest independent federal agencies. It operates the network of Social Security offices and call centers that serve millions of Americans.
SSA staff handle retirement and disability benefit claims, appeals, and customer service. Interestingly, SSA’s ~59k workforce is larger than the combined staff of five Cabinet departments (Education, HUD, Energy, Labor, and State) put together!
SSA has kept its staffing fairly flat or even reduced a bit over the years through automation, even as beneficiary loads increased.
Department of Transportation (DOT)
Around 53,000–56,000 employees, according to eeoc.gov. DOT includes the Federal Aviation Administration (FAA), which by itself employs roughly 45,000 people (including all the nation’s air traffic controllers and aviation safety inspectors).
Other DOT agencies include the Federal Highway Administration, Federal Railroad Administration, and so on – bbut the AA is the dominant employer in DOT.
DOT’s workforce has been steady, though the air traffic controller workforce saw a notable change after the 1981 strike (and subsequent rebuilding in the 80s). In 2025, hiring is underway to address a wave of controller retirements.
Department of Commerce
Around 47,000 employees (not counting temporary Census hires). Commerce has a very heterogeneous workforce. Its largest bureau in peacetime is the Patent and Trademark Office (over 10,000 patent examiners and staff).
Add to that NOAA (the National Oceanic and Atmospheric Administration, which includes the National Weather Service and scientific research staff ~ roughly 11,000), the Census Bureau (which is small most of the decade, but adds hundreds of thousands of temporary workers during the decennial census – in 2020 the Census Bureau ballooned by ~500,000 short-term employees as noted by usafacts.org), and other agencies like the Bureau of Industry and Security, Economic Analysis, and Standards and Technology.
Outside of Census years, Commerce’s core is under 50k, but once a decade, it briefly becomes the single largest civilian employer due to the census operations.
Department of Energy (DOE)

About 14,000–17,000 employees (civilian). Energy is relatively small in direct staff, but oversees a vast contractor workforce at national laboratories.
Many DOE “employees” are contractors (scientists at places like Los Alamos or Sandia labs). The 16k or so federal employees include nuclear security administrators, environmental cleanup staff, and policy headquarters personnel.
Department of State
Around 14,000–15,000 direct employees in OPM counts, plus an additional ~13,000 Foreign Service Officers and Specialists who may not all be reflected in OPM’s data.
The State Department’s workforce is unique: about half are Foreign Service diplomats stationed overseas or rotating assignments, and the other half are civil service personnel (analysts, passport agency staff, etc.), mostly in Washington.
If you include Foreign Service officers, State’s total workforce is on the order of 25–30,000. (OPM data, which was used in the graphic above, appears to count the civil-service portion around 14k.)
Even combined, the State is not a large employer compared to domestic agencies, which surprises some, given its critical mission.
Department of Labor
Around 14,000–15,000 employees. Labor is one of the smaller Cabinet departments. Its biggest components are the Occupational Safety and Health Administration (OSHA), the Bureau of Labor Statistics (BLS), the Employment and Training Administration, and the Mine Safety and Health Administration (MSHA).
Each of these agencies has a few thousand employees (for example, OSHA has inspectors spread nationwide). Labor’s headcount has hovered in the mid-teens (thousands) for years.
Department of Housing and Urban Development (HUD)
- Source: Youtube/Screenshot, About half of HUD’s employees work in field offices around the country to monitor housing programs
Around 8,000–9,000 employees. HUD is relatively small; many of its programs (like housing vouchers or community grants) are administered via state/local agencies or nonprofits, so HUD’s role is oversight and grant management.
Department of Education
Only about 4,200 employees. This is by far the smallest Cabinet department. Education primarily issues grants and loans; actual school operations are handled by states and local districts, so the federal role is limited.
Ed’s staff mostly manages programs like federal student aid, civil rights enforcement in schools, and research. It’s so small that multiple proposals have been made to eliminate the department (though none have succeeded).
In addition to the executive departments above, there are independent federal agencies with significant workforce presence.
We already noted the Postal Service (600k) aand the ocial Security Administration (59k). A few other notable ones:
To sum up the breakdown: Defense (military and civilian) is the giant, dwarfing all others. Outside Defense, the biggest civilian employers are VA, DHS, USPS, Justice, Treasury, HHS, and Agriculture, each with on the order of 80,000 to 500,000 personnel.
Meanwhile, several departments (Education, HUD, Energy, Labor, State (civil service)) have workforces under 20,000, making them relatively small players in staffing terms.
This wide disparity reflects each agency’s mission – for instance, taking care of millions of veterans requires a large, labor-intensive workforce (hence VA’s size), whereas distributing federal education grants or energy R&D can be done with much smaller staffs.
Federal Workforce Trends: 1980–2025
Over the past five years (2020–2025), the federal workforce has grown slightly in siz,– on the order of a few tens of thousands of additional employees each year, which is about a 1% annual growth rate according to PewResearch.org.
In 2019, federal civilian employment (including the Postal Service) was around 2.8–2.9 million. It ticked up to roughly 2.9 million in 2020, saw a temporary surge to ~3.2 million during the 2020 Census count (when many temporary census takers were hired), then settled back.
By 2021–2022, the workforce was roughly 2.9 million, and by late 2024, it had just crested 3.0 million for the first time in decades. Late 2024 marked the first time since 1994 that the federal civilian workforce topped 3 million employees.
Over the longer term, the size of the federal workforce has ebbed and flowed with history. Here are some milestone points for civilian federal employment (including USPS) over the past decades:
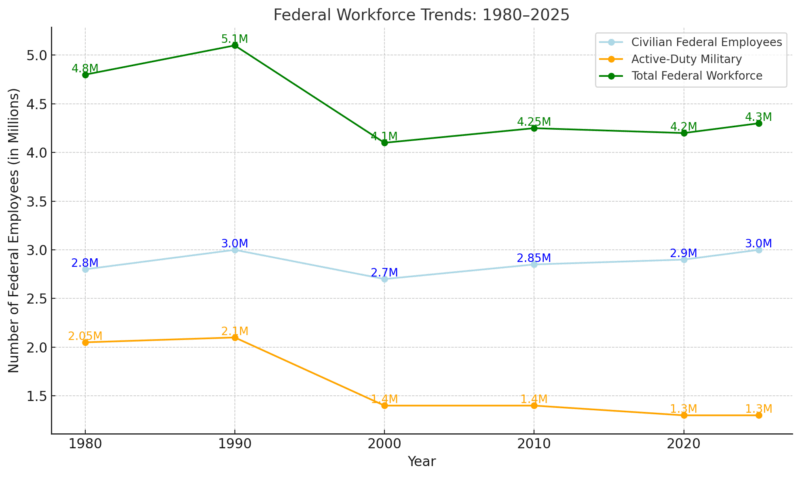
1980
The federal civil service (executive branch, incl. Postal) was roughly 2.8 million employees. This was just after a period of downsizing in the 1970s, post-Vietnam.
(If you include active-duty military, which numbered just over 2 million in 1980 according to historyinpieces.com, the total federal workforce in 1980 was around 4.8 million.)
1990

The federal workforce expanded through the 1980s, reaching around 3.0 million to 3.2 million civilian employees by 1990. In fact, at one point in 1990, it spiked to about 3.4 million because of temporary census hires.
The late Cold War military buildup and new programs under the Reagan administration had grown the civil workforce, and the 1990 Census added a short-term bump.
The active-duty military was about 2.1 million around 1990 (down a bit from the mid-1980s). So, total federal workers (civilian + military) around 1990 were roughly 5+ million.
2000
The 1990s saw a notable decline in federal employment. After the Cold War ended, the Defense Department slashed civilian (and military) personnel, and the Clinton administration’s reforms (“reinventing government”) trimmed the civil service.
Federal employment **contracted from the 3.1 million range in 1990 down to about 2.7–2.8 million by 2000. 1999–2000 was a modern low point, with around 2.7 million civilian employees.
For example, the 1995 closure of the Commerce Department’s Census field offices after the 1990 count, post-Cold War base closures, and a buyout program for federal workers all contributed.
OPM data shows that in November 2000, federal employment (excluding Postal Service) was 1.8559 million, which implies roughly ~2.75 million including postal workers.
The active military had also shrunk to about 1.4 million by 2000. So overall, the government in 2000 had roughly 4.1 million total employees (1.3 million fewer than in 1990).
2010

Despite new homeland security agencies (DHS was created in 2003, shifting in employees from other departments), the total count remained at 2 million.
By 2010, federal civilian employment was about 2.8 to 2.9 million. The 2010 Census caused a temporary surge to ~3.2 million mid-year (again, census takers), but by the end of 2010, it was back under 3 million.
Notably, during the 2000,s the Postal Service’s workforce was shrinking steadily – USPS went from ~800,000+ employees in the early 2000s to around 600,000 by the early 2010s, which kept overall numbers down.
Meanwhile, non-postal federal workers grew modestly with TSA’s creation and military operations in the War on Terror, but many warzone tasks were outsourced to contractors rather than swelling the civil service.
In short, the 2010’s federal workforce was quite similar in size to the 2000’s. Active-duty military remained roughly 1.4 million in 2010 (despite wars in Iraq/Afghanistan, the military did not grow dramatically – it relied on reserves and contractors).
2020
The late 2010s saw slight growth. By 2014, the civilian workforce hit a low of about 2.7 million (coinciding with tight budget caps). After 2014, hiring picked up modestly.
By 2019, it was around 2.8–2.9 million. In 2020, as noted, the census hiring pushed the peak to 3.2 million in August 2020, then it fell back to 2.9 million by December 2020.
The COVID-19 pandemic in 2020 did not significantly reduce federal employment; in fact, agencies like the CDC and SSA maintained staffing, and some parts of government (like health and economic aid programs) were extremely active, but the civil service numbers didn’t explode – much of the emergency work was handled via funding private-sector contracts and temporary hires.
The net effect: by 2020, the federal workforce was roughly the same size as a decade earlier, if not a tad larger due to growth in agencies like VA and DHS. (Active military in 2020 was about 1.3 million, continuing a gradual decline from 1980s levels.)
2025
View this post on Instagram
Today, in 2025, we’re essentially back to just above 3 million civilian federal employees, as detailed in the first section. That’s slightly above the level of the mid-1990s, but lower than the 3.4 million peak seen in 1990.
In other words, the civil workforce has grown very slowly (about 1% per year on average since 2000). One striking fact is that the number of federal employees in 2025 is almost the same as in 198,– despite the U.S. population growing and new missions emerging, the civil service headcount is relatively unchanged, reflecting decades of productivity improvements and outsourcing.
To visualize the trend: in November 2000, federal employment (excluding Postal) was ~1.856 million; by March 2024, it was ~2.405 million. That’s an increase of about 30% over nearly 24 years – roughly tracking population growth and new agency needs, but not a dramatic expansion.
As a share of the U.S. workforce, federal employment has declined. It hovered around 2% of U.S. jobs in 2000 and is under 1.9% now. The decline is mainly due to the Postal Service shedding jobs (automation and less mail). If you remove USPS, the rest of the federal workforce has grown slightly in absolute terms but stayed flat at ~1.5% of U.S. nonfarm employment【53†look】.
Military personnel trends: In 1980, the U.S. had over 2.0 million active-duty troops. That number dropped with the end of the draft and Vietnam War, then held around ~2.1 million in the 1980s. After the Cold War, it fell to ~1.4 million by 2000, and has remained in the 1.3 million range in recent years.
In percentage terms, there are ~37% fewer active-duty military members now than in 1980. This reduction in uniformed military (along with the postal cuts) means that the total federal payroll workforce – civilian plus military – is considerably smaller today (about 4.3 million) than it was in the 1980s (when it was over 5 million).
Overall, the federal workforce story is one of slow, incremental change rather than explosive growth. Certain agencies have expanded significantly (e.g., VA nearly doubled its workforce over the past 20 years to care for aging veterans, and DHS was created and grew after 2002), while others have contracted (USPS down by ~300k since 1990, Defense civilian workforce down from Cold War highs according togovexec.com, etc.).
But in aggregate, the civil service headcount has stayed in a narrow band between ~2.5 and 3 million for the past 40 years.
Cutting Fat vs. Cutting Capacity: Can the Federal Government Learn from Elon Musk?
@projectfga Elon Musk fired 80% of Twitter’s staff. 🎥 Fox News #tiktok #viral #elonmusk #twitter #billionaire #tuckercarlson ♬ Breaking News, TV Shows, Report, Broadcast, Live, Serious, Business, World(1323125) – SAKUMAMATATA
When Elon Musk took over Twitter (now X) in late 2022, one of his first moves was to aggressively slash headcount. The company reportedly had 7,500 employees when he acquired it; by early 2023, that number had dropped to around 1,500 — an 80% reduction. Say what you want about his management style (plenty of people do), but the point was clear: cut what doesn’t serve the mission, and fast.
Musk’s argument? That bloated staffing slowed down innovation, wasted money, and added unnecessary layers of bureaucracy. Stripping that down, he believed, would lead to a leaner, more responsive operation — the kind that builds quickly, adapts often, and costs less to run.
And while government isn’t a tech company — no one’s pushing code at the IRS at 2 a.m. — the principle of efficiency still matters. Especially when you’re talking about a payroll of 4.3 million people and a federal budget north of $6 trillion.
What Would a Musk-Style Trim Mean for the U.S. Government?
If the federal government were to cut even 10% of its direct workforce, that would amount to about 430,000 jobs. Assuming an average federal salary of $90,000–$110,000 (plus benefits), that’s potentially $40–$50 billion a year in payroll savings — not including long-term pension and administrative overhead.
Even shaving a few percentage points could save enough to fund major infrastructure or defense priorities.
But here’s the challenge: not all “cuts” are created equal.
Unlike Twitter, federal agencies perform public safety, health, infrastructure, scientific research, and military operations. Eliminating “unnecessary” staff is much harder to define.
Who decides what’s redundant at the CDC, or which border agents aren’t essential? You can’t automate a wildfire response or replace air traffic control with an AI chatbot — not yet, anyway.
Still, many experts argue there’s room for smart modernization, especially in:
Real Savings Come from Smart Streamlining
Here’s what a more productive federal workforce could look like — without pink-slipping frontline staff:
Strategy
Potential Annual Savings
Notes
Consolidate overlapping programs
$10B+
Multiple grant programs often do the same work across departments.
Modernize outdated tech systems
$5–10B
Reduces maintenance costs and fraud; improves speed of service.
Replace inefficient contractors
$15–25B
Government can sometimes do tasks more cheaply in-house.
Automate low-risk administrative tasks
$3–7B
From HR onboarding to processing simple forms, automation helps.
Even federal insiders have pointed this out. A 2023 report from the Government Accountability Office (GAO) identified 1,100+ areas of duplication, fragmentation, and overlap, recommending reforms that could save tens of billions — if followed through.
Can the Government Actually Move That Fast?

Not easily. Unlike a tech founder who can cut half the workforce by sending a midnight email, the U.S. government has civil service protections, union agreements, and oversight mechanisms for good reason.
But Musk’s message resonates: question the status quo. Just because something’s always been done a certain way doesn’t mean it still makes sense. And if the federal workforce is to stay near 3 million for the long haul, those 3 million need to be deployed where they matter most — not just where tradition or inertia says they belong.
So while Washington isn’t Silicon Valley, it might still benefit from a little of the startup mentality: cut waste, streamline systems, and make every taxpayer dollar count.
Concluding Observations
Despite changes in administrations, political rhetoric about “big government,” and events like wars and pandemics, the core size of the federal workforce has been remarkably stable for decades.
Around 2 to 3 million civilians have been on the federal payroll at any given time from the late 20th century through today. The composition of that workforce has shifted – for example, fewer postal clerks but more TSA officers now than 20 years ago, and more VA healthcare workers to serve veterans, while some agencies like Labor or Interior have stayed level or shrunk.
The military workforce has shrunk in size since the Cold War, but the civilian workforce has slightly grown to meet new needs (like homeland security and IT management) – yet those increases were often offset by efficiencies and contractor usage.
For a nation of over 330 million people, a civilian federal corps of 3 million executing all the duties of governmen,– from delivering mail to guarding borders, from running national parks to researching vaccines, is not an inconceivably large number.
Many analysts note that federal employment hasn’t kept pace with U.S. population growth, meaning agencies are expected to do more with roughly the same number of staff. This tension is often managed by outsourcing work to contractors or state/local partners, rather than by hiring en masse.
Going forward, the federal workforce may face a wave of retirements (a large chunk of feds are over age 55usafacts.org) and efforts to modernize. But in pure numbers, any changes are likely to be gradual. The federal government of 2030 will probably still employ on the order of three million Americans, give or take a few hundred thousand, barring some major policy shift.
In summary, 2025’s federal workforce is big in absolute terms (millions of employees) but has grown only modestly over time. It is concentrated in a few giant agencies (Defense, VA, DHS, USPS) and stable or shrinking in many others.
References
- Pew Research Center – What the data says about federal workers
- Pew Research Center – The state of the U.S. Postal Service in 8 charts
- GovExec – Pentagon to fire 61,000 workers starting with 5,400 next week, says DoD
- Fred Economic Data (FRED) – All employees, United States Postal Service
- US Government Manual – Department of Justice
- Department of Homeland Security – About DHS
- EEOC – Department of Transportation (DOT)
- USAFacts – How many people work for the federal government?
- History in Pieces – U.S. Military Personnel 1954–2014
- Federal Reserve Economic Data (FRED) – All Employees, Federal
- USAFacts – How old is the federal workforce?
- Volcker Alliance – New Research Analyzes the Size of Government Since the 1980s