
As of 2025, the most populated county in Ohio is Franklin County, with nearly 1.3 million residents surpassing Cuyahoga County, which has recently seen a decrease in its population.
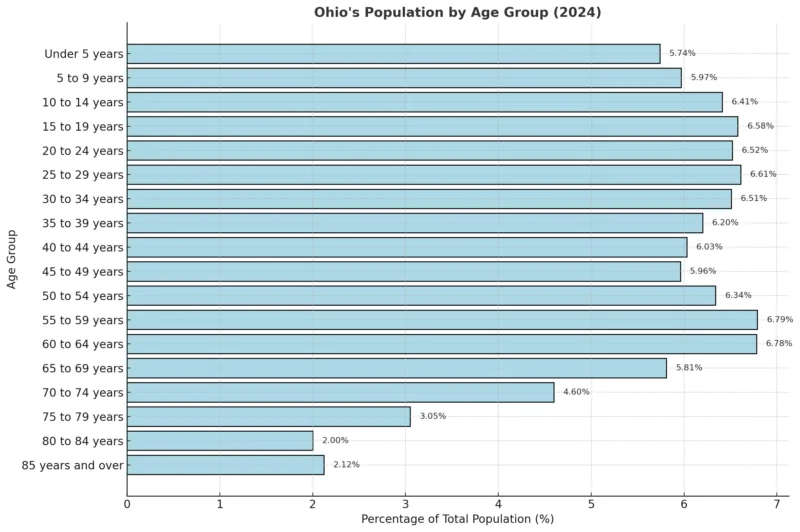
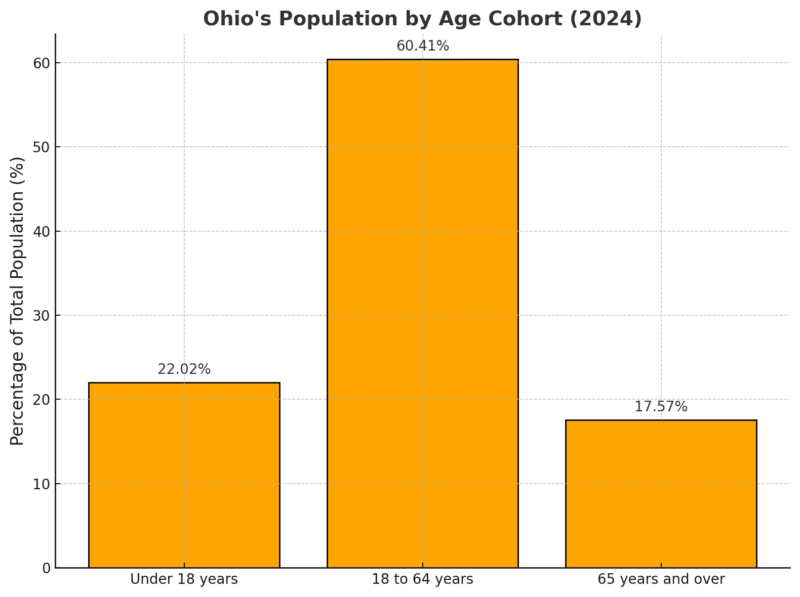
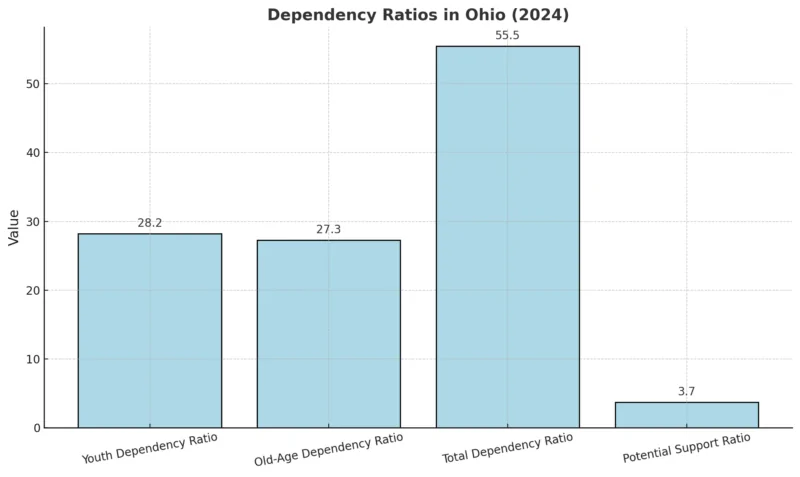
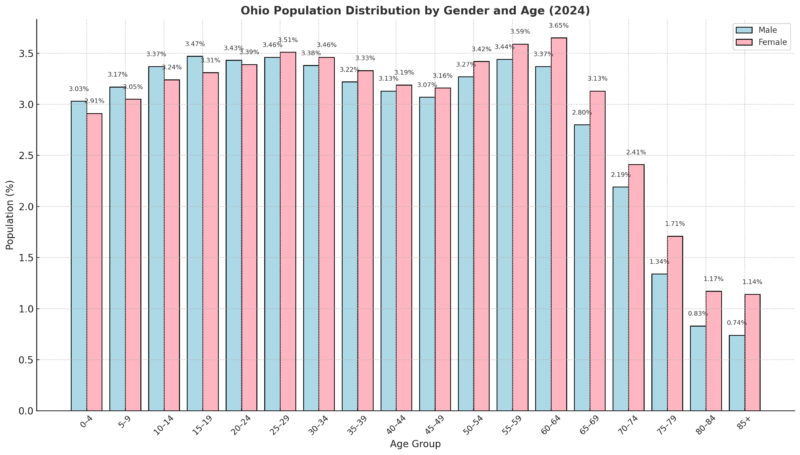
Demographics by Age and Gender
Ethnic and Racial Composition
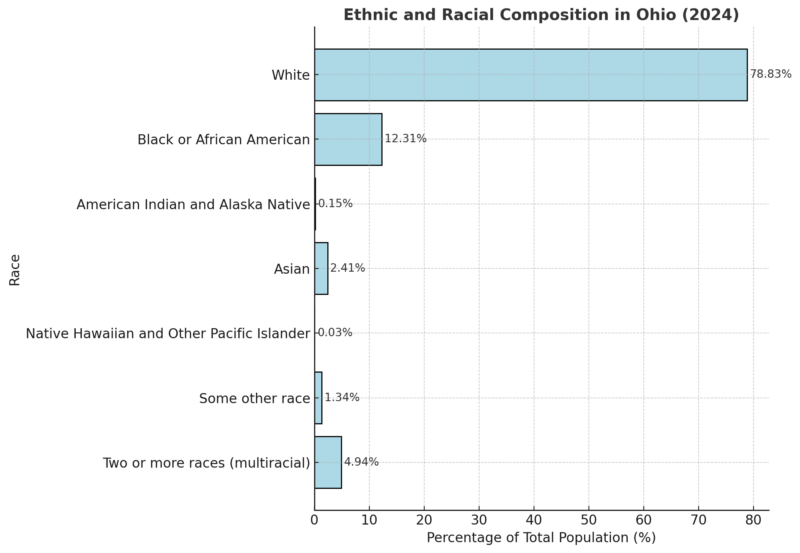
The majority of Ohio’s population identifies as White (78.83%), followed by Black or African American individuals, who make up 12.31%.
Asians account for 2.41%, while multiracial individuals constitute 4.94%, reflecting Ohio’s growing diversity.
Smaller racial groups, such as Native Hawaiians (0.03%) and American Indians (0.15%), make up a minimal share of the state’s demographic.
This racial breakdown highlights Ohio’s predominantly White population with steady representation from minority groups, indicative of gradual diversification over time.
Counties By Population
Ohio’s population trends highlight significant regional differences. Columbus continues to thrive with steady growth, driven by economic opportunities and urban development according to sources. On the other hand, Cleveland’s decline underscores the challenges faced by older industrial cities. Population distribution across counties and cities reflects both growth in dynamic areas like Franklin County and stagnation or decline in regions such as Cuyahoga County.
County
Population
% Growth
Area (sq mi)
Population Density (per sq mi)
Franklin County
1,330,396
+0.45%
205
2,501
Cuyahoga County
1,229,182
-2.64%
176
2,690
Hamilton County
829,395
-0.12%
156
2,048
Summit County
535,697
-0.76%
159
1,297
Montgomery County
534,118
-0.56%
178
1,159
Lucas County
424,249
-1.53%
131
1,248
Butler County
396,358
+1.40%
180
849
Stark County
372,647
-0.50%
222
648
Lorain County
319,789
+2.01%
190
651
Warren County
254,561
+4.66%
155
635
Delaware County
236,746
+10.03%
171
534
Lake County
231,544
-0.42%
88
1,011
Mahoning County
225,270
-1.20%
159
548
Clermont County
213,265
+2.16%
175
471
Trumbull County
200,020
-0.82%
239
324
Licking County
184,637
+3.27%
263
271
Medina County
184,595
+1.07%
163
438
Greene County
170,355
+1.32%
160
411
Fairfield County
167,764
+5.22%
195
333
Portage County
163,588
+1.07%
188
336
Clark County
134,488
-1.03%
153
340
Wood County
133,658
+1.06%
238
217
Richland County
124,867
-0.08%
191
252
Wayne County
116,468
-0.39%
214
210
Miami County
111,539
+2.37%
157
274
Allen County
100,579
-1.51%
156
250
Columbiana County
99,795
-1.82%
205
188
Ashtabula County
96,730
-0.78%
271
138
Geauga County
95,323
-0.07%
154
238
Tuscarawas County
91,777
-1.52%
219
162
Muskingum County
86,496
+0.03%
257
130
Ross County
76,494
-0.72%
266
111
Hancock County
74,634
-0.39%
205
141
Erie County
73,556
-2.55%
97
293
Union County
72,398
+14.76%
167
168
Scioto County
71,749
-2.84%
235
118
Marion County
65,093
-0.45%
156
161
Population Density
Metric
Value
Population Density
282.3 people/sq mile
Land Area
44,825 square miles
Major Cities (Population)
Columbus
850,000
Cleveland
388,072
Cincinnati
298,550
Toledo
298,550
Akron
197,542
Top Counties (Population)
Franklin County
1,291,981
Cuyahoga County
1,248,514 (2% decline)
Educational Attainment Levels
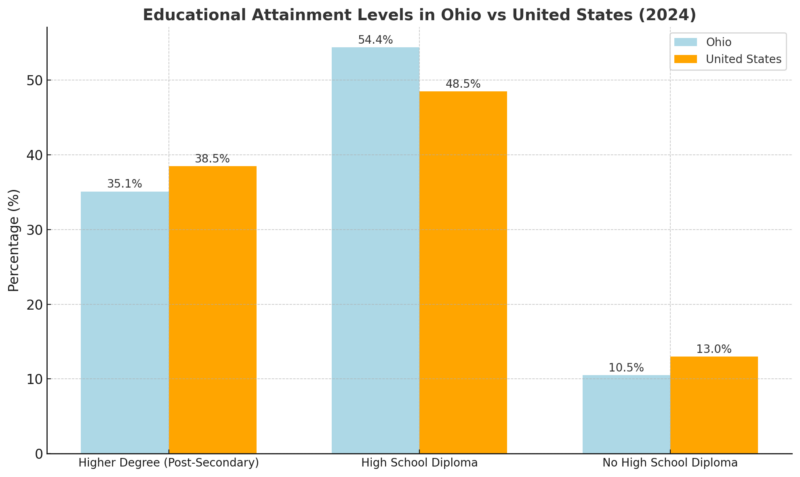
Ohio has a higher percentage of residents with only a high school diploma (54.4%) compared to the national average (48.5%) according to Statistical Atlas.
However, it lags behind the U.S. in post-secondary education, with 35.1% holding higher degrees versus 38.5% nationwide.
Ohio also has a lower percentage of residents without a high school diploma, suggesting stronger basic educational attainment.
Detailed Educational Attainment in Ohio vs. U.S. (Population Aged 25+)
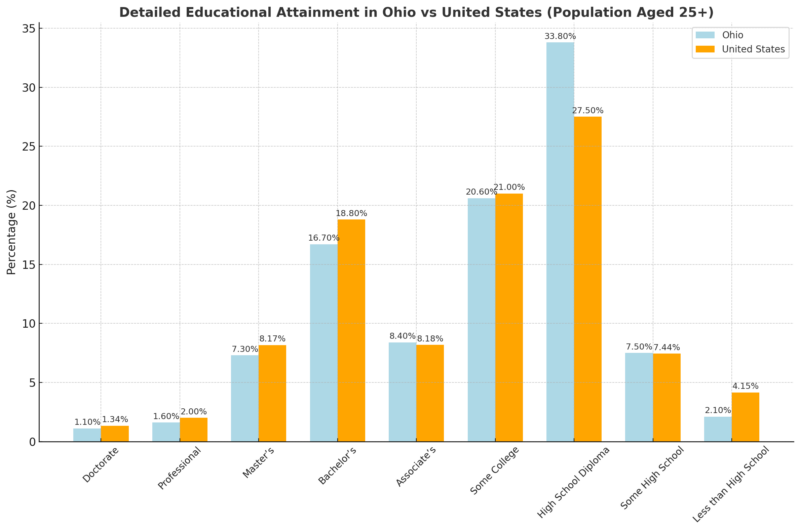
Ohio has a notably higher percentage of residents with a high school diploma only (33.8%) compared to the national average (27.5%).
While Ohio’s rates for professional and advanced degrees (e.g., doctorates, master’s) are lower than national levels, the state has a slightly higher percentage of associate degree holders and residents with some high school education but no diploma.
Educational Attainment by Gender (Ohio)
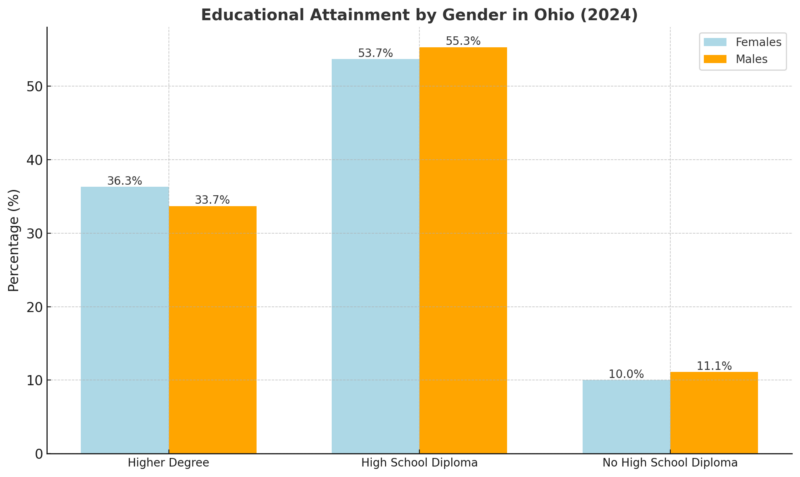
Females in Ohio are more likely to attain higher degrees than males, reflecting national trends.
Conversely, males slightly outpace females in high school diploma attainment and are marginally more likely to lack a high school diploma.
These differences indicate small but notable gender disparities in educational achievement within the state.
Employment
Data Series
April 2024
May 2024
June 2024
July 2024
August 2024
September 2024 (Preliminary)
Civilian Labor Force (in thousands)
5,808.6
5,817.2
5,838.5
5,859.9
5,863.0
5,877.0
Employment (in thousands)
5,579.1
5,574.5
5,584.2
5,596.3
5,600.1
5,614.0
Unemployment (in thousands)
229.5
242.8
254.2
263.7
262.9
263.0
Unemployment Rate (%)
4.0
4.2
4.4
4.5
4.5
4.5
- Civilian Labor Force Growth: Ohio’s civilian labor force has grown steadily from 5.81 million in April to a preliminary 5.88 million in September 2024. This indicates an increase in individuals either working or actively seeking work according to BLS.
- Employment Levels: Employment increased slightly, rising from 5.58 million in April to a preliminary 5.61 million in September. This reflects gradual job growth in the state.
- Unemployment Stability: Unemployment figures also rose marginally, from 229,500 in April to 263,000 in September, corresponding to a slight increase in the unemployment rate from 4.0% to 4.5%. This suggests that while more people are entering the labor force, job creation is not fully absorbing this increase.
- Unemployment Rate Trends: The unemployment rate grew by 0.5 percentage points over the six months, remaining stable at 4.5% from July to September.
Ohio’s unemployment rate hit a nearly three-year high of 4.5% in July as a growing number of people return to the labor force. https://t.co/blpeXfTdR9
— Columbus Dispatch (@DispatchAlerts) August 19, 2024
Income Distribution
Income Bracket
Average Annual Tax Change
Impact
Under $24,000
+$80
Increased tax burden
$24,000–$66,900
-$352
Modest tax decrease (<1% of income)
Over $647,000 (Top 1%)
-$52,000
Substantial tax reduction
Ohio families earning less than $24,000 annually have seen an increased tax burden, paying $80 more each year on average according to policymattersohio.org.
Meanwhile, middle-income earners, earning up to $66,900, have experienced a modest tax reduction of $352 annually, which equates to less than $30 per month.
In stark contrast, the wealthiest households, earning over $647,000, benefit from significant tax cuts, saving over $52,000 annually.
Revenue Loss from Tax Changes vs. State Investments
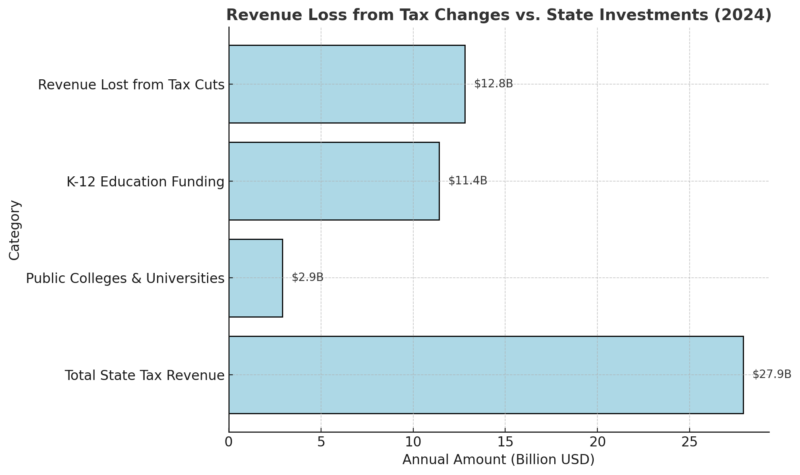
The $12.8 billion in annual revenue lost due to tax cuts nearly matches Ohio’s entire K-12 education budget ($11.4 billion) and exceeds the funding provided for public colleges and universities ($2.9 billion).
This revenue loss also constitutes nearly half of Ohio’s total tax revenue ($27.9 billion), highlighting the significant opportunity cost of these tax policies.
Distribution of Tax Cuts
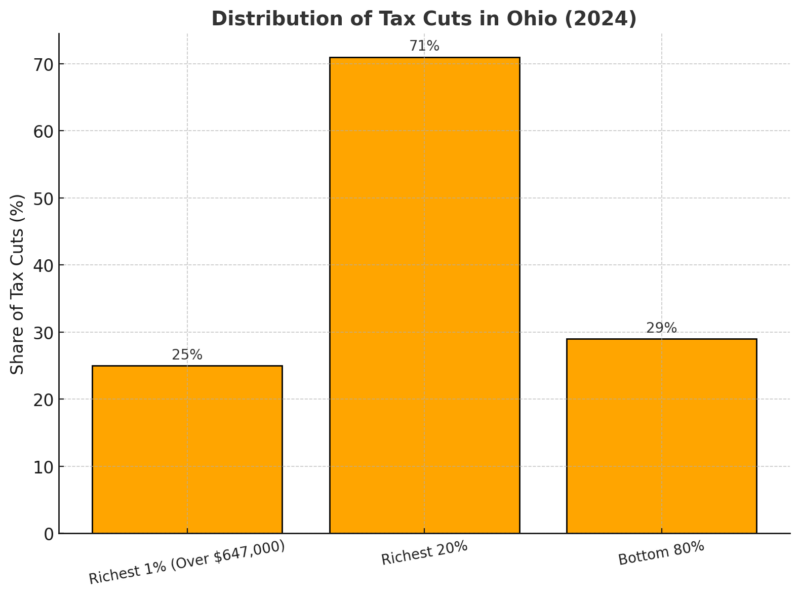
The wealthiest 1% of Ohioans receive 25% of the total tax cuts, while the top 20% collectively take 71%.
In contrast, the remaining 80% of households share just 29% of the benefits, demonstrating a disproportionate allocation of tax relief favoring the highest earners.
Changes in Tax Types by Household Impact
Tax Type
Impact on the Bottom 99%
Impact on the Top 1%
Sales Taxes
Increase
Decrease ($600/year)
Excise Taxes
Increase
Decrease
Business Taxes
Increase
Decrease
Recent changes to sales, excise, and business taxes have increased the financial burden for 99% of Ohio households.
Conversely, the wealthiest 1% pay less, saving around $600 annually from reductions in these taxes.
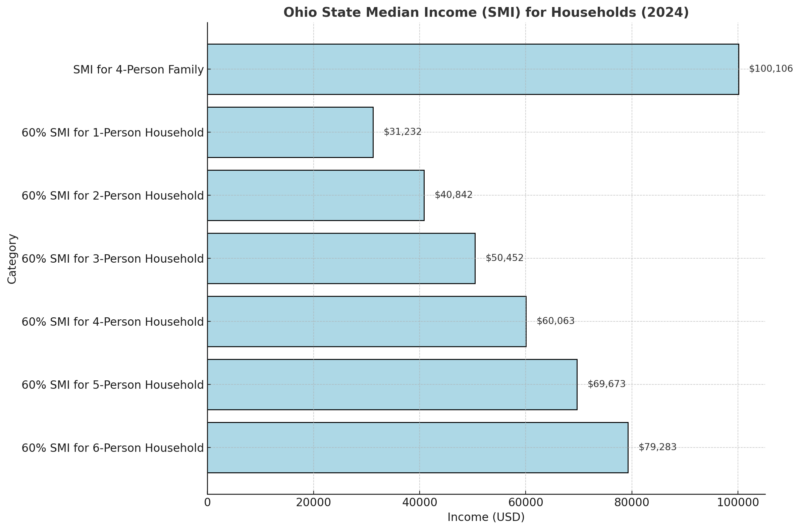
This table provides the State Median Income (SMI) for a standard 4-person family in Ohio, which is $100,106 as noted by government sources.
Additionally, it outlines the income thresholds representing 60% of the SMI for households of varying sizes, from 1-person to 6-person households.
Housing and Real Estate Trends
Metric
Value
Year-Over-Year Growth
Median Sale Price
$247,900
+6.7%
Number of Homes Sold
11,464
+4.1%
Median Days on Market
38 days
+10 days
Number of Homes for Sale
39,863
+16.4%
Number of Newly Listed Homes
13,407
+5.3%
Months of Supply
2 months
No change
Home prices in Ohio continue to rise, with a 6.7% increase year-over-year, reaching a median sale price of $247,900 in October 2024 according to Redfin.
The steady growth in home values reflects a strong housing market, although it may signal reduced affordability for some buyers.
The number of homes sold increased by 4.1%, indicating healthy demand.
View this post on Instagram
However, homes are staying on the market longer, with the median days on the market rising by 10 days to 38 days. This could suggest a slight cooling in buyer urgency.
The housing inventory in Ohio expanded significantly, with a 16.4% increase in the number of homes for sale and a 5.3% rise in newly listed homes.
Despite this growth, the months of supply remained at 2, suggesting that demand continues to outpace supply, maintaining a seller’s market.
Top 10 Metros in Ohio with Fastest Growing Sales Price
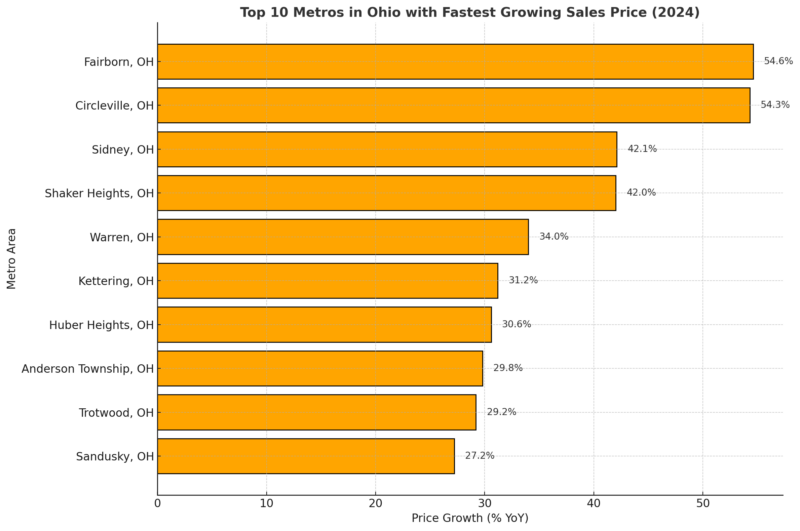
Fairborn, Circleville, and Sidney lead the state with sales price growth of over 40%, showcasing rapidly appreciating markets in smaller cities. These trends may indicate increased interest in more affordable or suburban areas.
Health and Well-Being Statistics
Indicator
Value
Fertility Rate
57.3 (births per 1,000 women aged 15-44)
Teen Birth Rate
15.4 (births per 1,000 females aged 15-19)
Infant Mortality Rate
7.11 (infant deaths per 1,000 live births)
Life Expectancy (at Birth)
74.5 years (2021)
Marriage Rate
5.3 (marriages per 1,000)
Divorce Rate
2.4 (divorces per 1,000)
Leading Cause of Death
Heart Disease
Drug Overdose Death Rate
45.6 (per 100,000)
Firearm Injury Death Rate
15.6 (per 100,000)
Homicide Rate
8.5 (per 100,000)
Ohio faces significant health challenges, as evidenced by its health indicators.
The state’s life expectancy at birth is 74.5 years, which is lower than the national average as noted by CDC.
The leading cause of death is heart disease, highlighting the need for cardiovascular health initiatives.
Ohio also has a high drug overdose death rate of 45.6 per 100,000, alongside firearm injury and homicide rates of 15.6 and 8.5 per 100,000, respectively.
These statistics suggest that public health efforts need to focus on substance abuse, violence prevention, and chronic disease management.
Birth Data for Ohio
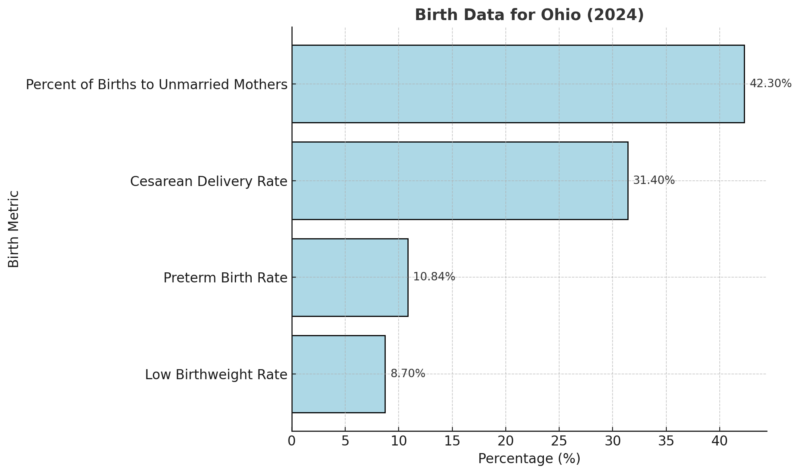
Ohio’s birth statistics reveal areas for improvement in maternal and infant health.
Notably, 42.3% of births are to unmarried mothers, which could indicate socioeconomic challenges.
The state’s preterm birth rate of 10.84% and low birthweight rate of 8.70% suggest a need for enhanced prenatal care programs.
Cesarean deliveries account for 31.4% of births, which is significant but aligns with broader trends.
Migration Patterns
Metric
Value
Immigrant Share of Population
4.9%
Total Immigrant Residents
581,000
Immigrant Spending Power
$18.6 billion
Taxes Paid by Immigrants
$7.0 billion
Immigrant Share of Labor Force
6.1%
Immigrant Entrepreneurs
8.0%
Immigrant Business Income
$944 million
American Immigration Council notes that immigrants make up 4.9% of Ohio’s population (581,000 residents) and contribute significantly to the economy, generating $18.6 billion in spending power and paying $7 billion in taxes.
They also account for 6.1% of the labor force and own 8% of businesses in the state, earning nearly $1 billion in annual business income.
Age Distribution of Immigrants vs. U.S.-Born Population
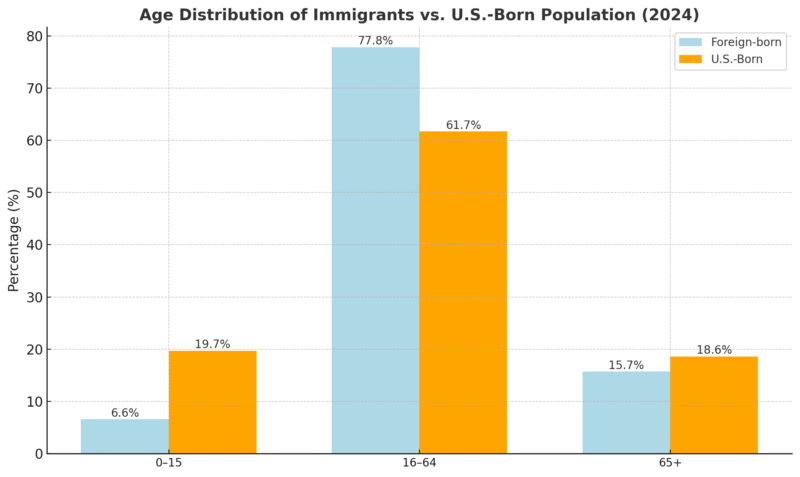
The majority of Ohio’s immigrants (77.8%) are working-age adults (16–64), compared to 61.7% of U.S.-born residents.
This demographic difference highlights immigrants’ critical role in the workforce.
Immigrant children (6.6%) and seniors (15.7%) form a smaller share of the population compared to their U.S.-born counterparts.
Immigrants in the Workforce and Education
Category
Value
Share of Workers in the Labor Force
6.1%
Number of Workers in the Labor Force
364,600
Share of STEM Workers
11.7%
Share of Nurses
5.0%
Share of Health Aides
8.6%
College Education (Graduate Degree)
22.3% (Foreign-Born)
College Education (Graduate Degree)
12.1% (U.S.-Born)
Immigrants play a significant role in Ohio’s workforce, particularly in high-demand fields like STEM (11.7%) and healthcare (5.0% of nurses).
They are also more likely than U.S.-born residents to hold advanced degrees (22.3% vs. 12.1%), filling crucial roles in professional and technical industries.
Immigrant Contributions to Housing
Housing Metric
Value
Immigrant Homeowners
143,600
Recent Homebuyers (Foreign-Born)
6.8%
Housing Wealth Held
$45.0 billion
Rent Paid by Immigrant Households
$1.4 billion
Immigrants have revitalized Ohio’s housing market by becoming homeowners (143,600 households) and accounting for 6.8% of recent homebuyers.
They contribute $45 billion in housing wealth and pay $1.4 billion in rent annually, reinforcing their role in stabilizing and strengthening communities.
Methodology
This article was crafted using data sourced from reputable organizations, including the U.S. Census Bureau, American Immigration Council, and other state and federal agencies.
We analyzed publicly available data sets and reports to highlight trends in Ohio’s demographics, economy, education, and healthcare.
Relevant metrics were compared against national averages to provide contextual insights.
Tables and concise summaries were used to organize complex data for better readability. Expert analyses and projections were incorporated to provide actionable insights for policymakers, businesses, and residents.
References:
- World Population Review – Ohio Population 2024
- American Community Survey – Ohio Population by Gender and Age
- U.S. Census Bureau – Census 2020 Demographic Profile: Charting the Changes
- Statistical Atlas – Educational Attainment in Ohio
- Bureau of Labor Statistics – State Employment and Unemployment
- Policy Matters Ohio – The Great Ohio Tax Shift 2024
- Redfin – Ohio Housing Market Overview
- American Immigration Council – Immigrants in Ohio
- Centers for Disease Control and Prevention – Ohio Health Statistics
- Office of Community Services – FY2023 State Median Income Table
- World Population Review – State Densities


