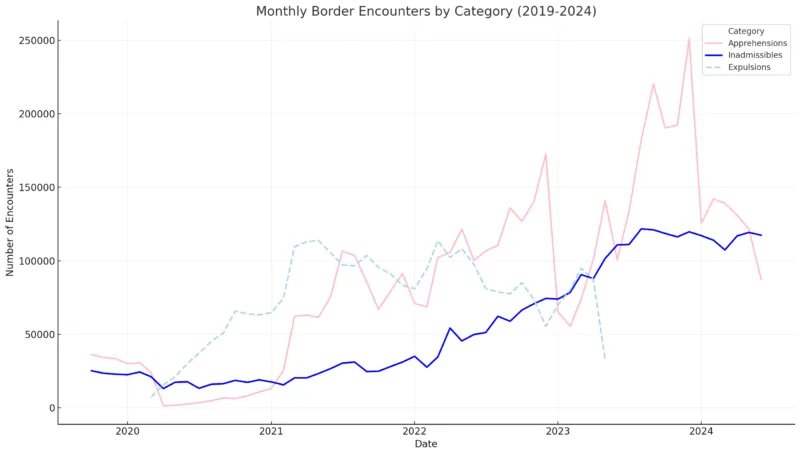
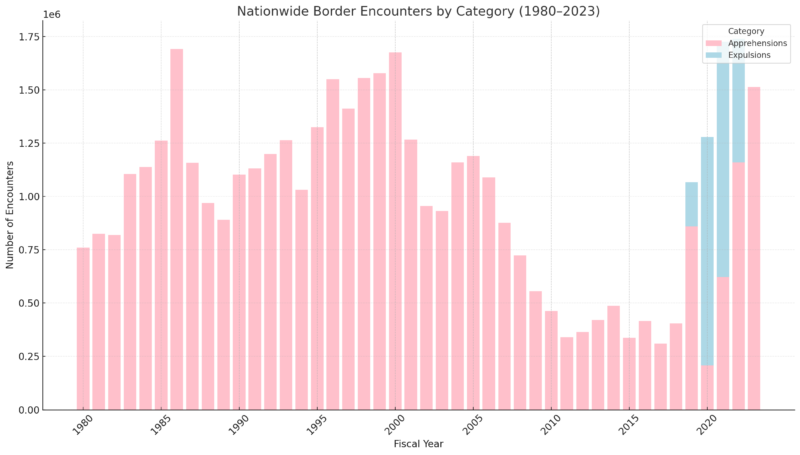
Between October 2019 and June 2024, U.S. border officials recorded encounters with 11 million unauthorized migrants attempting to enter the country according to USA Facts.
These encounters include individuals apprehended while crossing the border without inspection or attempting to gain entry.
This data plays a crucial role in helping the government estimate the scale of unauthorized immigration.
By analyzing the demographics and origins of those encountered, policymakers can gain better insight into the factors driving migration and develop more informed immigration policies.
Key Takeaways
Trends in Border Encounters (2019–2024)
The @CBP reported nearly 7.7 million unauthorized border encounters across the US between October 2019 and June 2023.
What can the data tell us about unauthorized immigration? Learn more: https://t.co/pjVHRjptEz #dataviz #usafacts pic.twitter.com/U4qr15E1SH
— USAFacts (@USAFacts) February 16, 2024
Between October 2019 and June 2024, U.S. border officials reported approximately 11 million border encounters that are around the population of Georgia.
The trends during this period highlight both the challenges and policy impacts related to unauthorized immigration.
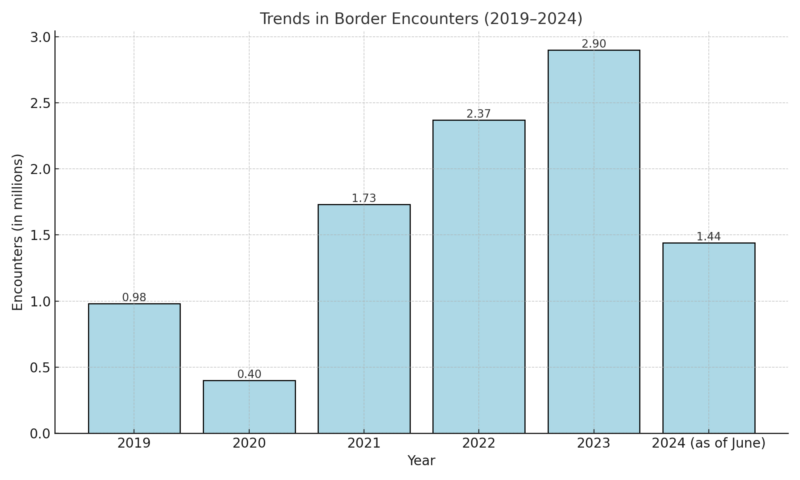
Annual Data Highlights
- Monthly encounters peaked in December 2023, with over 370,000 individuals, averaging more than 12,000 per day.
- By June 2024, there were 1.44 million encounters reported for the year, reflecting elevated levels compared to prior decades.
Impact of Title 42
-
Monthly border encounters by category (2019-2024)
During the early months of the COVID-19 pandemic, border encounters dropped slightly, particularly between March and April 2020, when the Trump administration implemented Title 42. This policy allowed border officials to expel migrants quickly for public health reasons, bypassing standard immigration procedures.
Title 42 remained in effect until May 2023, after which expulsions under the policy ceased. Following the initial drop in 2020, border encounters rebounded and surged by 66% from February to March 2021, remaining consistently high through 2023.
One factor behind this increase was the higher recidivism rate among those expelled under Title 42. Unlike individuals processed under Title 8, those expelled under Title 42 were more likely to attempt multiple crossings, inflating encounter numbers.
According to CBP, the actual number of unique individuals attempting to cross the border was significantly lower than the total reported encounters due to repeated attempts by the same individuals.
Event
Date
Title 42 Invoked
March 20, 2020
Title 42 Ended
May 11, 2023
Historical Context of Unauthorized Entries
While exact data on unauthorized crossings is unavailable, border encounter numbers provide an imperfect yet valuable proxy.
The apprehension rate is a key measure, estimating the proportion of illegal crossings prevented by border enforcement.
From 2018 to 2020, the U.S. Customs and Border Protection (CBP) reported an average apprehension rate of 78%, a significant improvement from 35% during 2002–2004.
This indicates fewer successful entries compared to earlier decades.
-
Nationwide border encounters by category (1980–2023)
- During the 1990s, annual apprehensions averaged over 1.3 million.
- By the 2010s, this number dropped to fewer than 500,000 annually, reflecting shifts in migration patterns and enforcement strategies.
Decade
Average Annual Apprehensions
1990s
1.3 million
2000s
900,000
2010s
480,000
2020–2024
1.9 million
Demographics of Border Crossers
The profile of unauthorized immigrants in the U.S. has shifted significantly since the population peaked in 2007.
Here are the key trends and changes in recent years:
Mexico
Mexicans remain the largest group of unauthorized immigrants in the U.S., but their share has been declining steadily.
In 2022, there were approximately 4.0 million unauthorized immigrants from Mexico, the lowest number since the 1990s according to Rand’s report.
Mexicans accounted for 37% of the total unauthorized immigrant population, the smallest proportion on record.
This decline can be attributed to:
- A broader decrease in migration from Mexico to the U.S.
- Some Mexican immigrants returning to Mexico.
- Expanded opportunities for lawful immigration, especially for temporary agricultural workers.
Year
Unauthorized Immigrants from Mexico (millions)
Percentage of Total Unauthorized Population
2007
6.9
~57%
2017
~4.5
~48%
2022
4.0
37%
Rest of the World
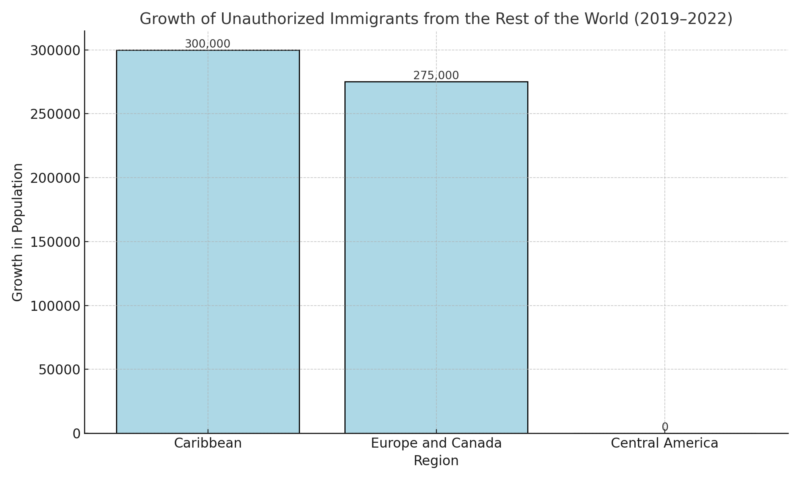
From 2019 to 2022, the total number of unauthorized immigrants from countries other than Mexico increased significantly, rising from 5.8 million to 6.9 million according to an NIH study.
The largest increases came from:
- The Caribbean (+300,000)
- Europe and Canada (+275,000)
Central America, which had been a major source of growth before 2019, saw little change during this period.
Countries with Largest Unauthorized Populations in 2022
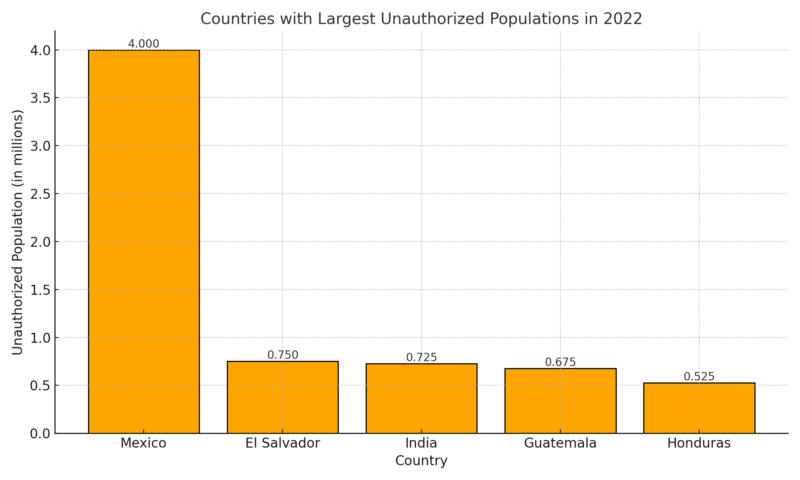
After Mexico, the countries contributing the largest number of unauthorized immigrants in 2022 were:
- El Salvador: 750,000
- India: 725,000
- Guatemala: 675,000
- Honduras: 525,000
Paw Research notes that collectively, the three Central American countries of El Salvador, Guatemala, and Honduras, known as the Northern Triangle, accounted for 1.9 million unauthorized immigrants or about 18% of the total.
Other Countries
Unauthorized immigration from other countries also grew between 2019 and 2022:
- Venezuela: Increased to 270,000 in 2022, up from 130,000 in 2017 according to UCIS.
- Brazil, Canada, Colombia, Ecuador, India, and countries from the former Soviet Union also experienced significant growth.
Countries with no notable change during this period include:
- China
- Dominican Republic
- Philippines
Country
Unauthorized Population in 2022
Venezuela
270,000
Brazil
Moderate increase
Canada
Moderate increase
Colombia
Moderate increase
China
No change
Dominican Republic
No change
Philippines
No change
These trends highlight shifting migration dynamics, with significant growth among countries outside of Mexico and the Northern Triangle, reflecting broader global migration patterns.
Family and Child Encounters
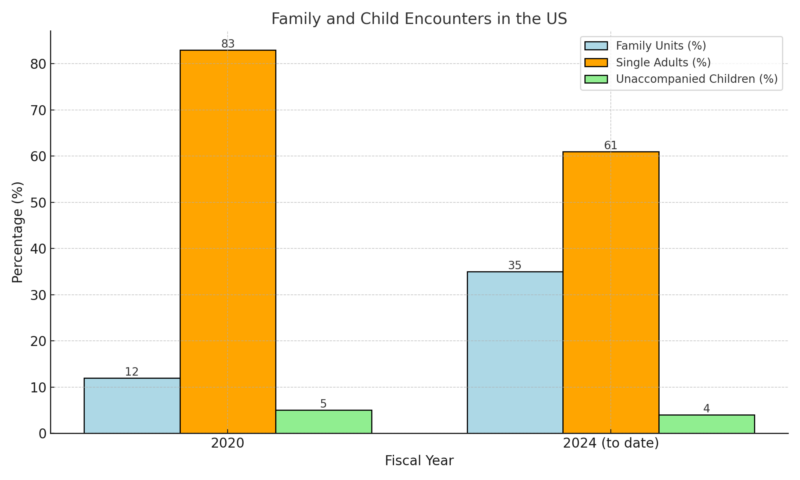
Between 2019 and 2024:
- 585,000 encounters involved children, 96% of whom were unaccompanied as per the CRS report.
- Family unit encounters rose from 11.6% of total encounters in 2020 to 35.1% in 2024.
Where Do Unauthorized Immigrants Live in the U.S.?
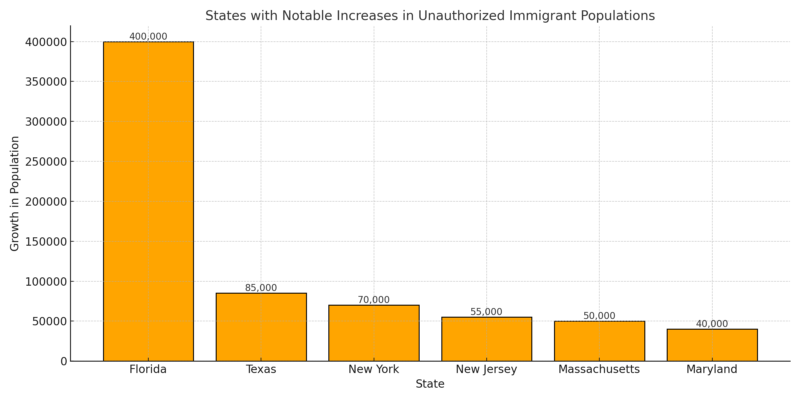
The distribution of unauthorized immigrants across the United States reveals key trends and regional dynamics. While most states saw relatively stable populations of unauthorized immigrants between 2019 and 2024, several states experienced notable growth or decline.
States with Significant Growth (2019–2024)
Between 2019 and 2024, six states saw substantial increases in their unauthorized immigrant populations:
Declines
- California was the only state to see a decline, losing 120,000 unauthorized immigrants during this period according to Paw Research Center.
States with the Largest Unauthorized Immigrant Populations
The majority of unauthorized immigrants reside in a small number of states. The six states with the largest populations were:
State
Population (in millions)
California
1.8M
Texas
1.6M
Florida
1.2M
New York
650,000
New Jersey
475,000
Illinois
400,000
Together, these six states accounted for 56% of the total unauthorized immigrant population, compared to 80% in 1990.
This indicates a decreasing concentration of unauthorized immigrants in traditional states and a broader geographic dispersion over time.
The Unauthorized Immigrant Population
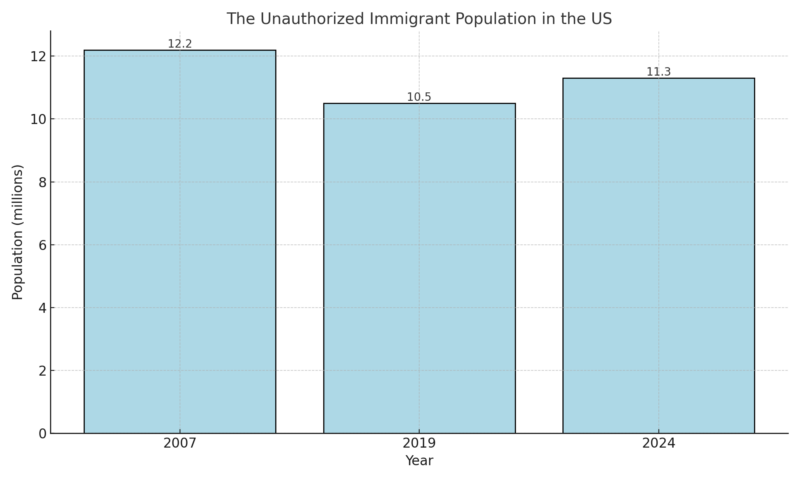
The unauthorized immigrant population grew to 11.3 million in 2024, reversing a decline from its peak of 12.2 million in 2007 according to Migration Policy. This growth reflects increased migration from regions outside Mexico, including South America, the Caribbean, and Asia.
Labor Force Participation
Unauthorized immigrants comprised 45.4% of the U.S. workforce in 2022, totaling 8.3 million workers as noted in this research.
The Role of Immigrants in the U.S. Workforce
Immigrants play a crucial role in the U.S. workforce, with both authorized and unauthorized workers contributing significantly to various sectors of the economy.
In 2022, immigrants made up 18% of the total U.S. workforce, reflecting a slight increase from 17% in 2007. However, the share of unauthorized immigrants in the workforce has declined over the years.
Workforce Composition of Immigrants in 2022
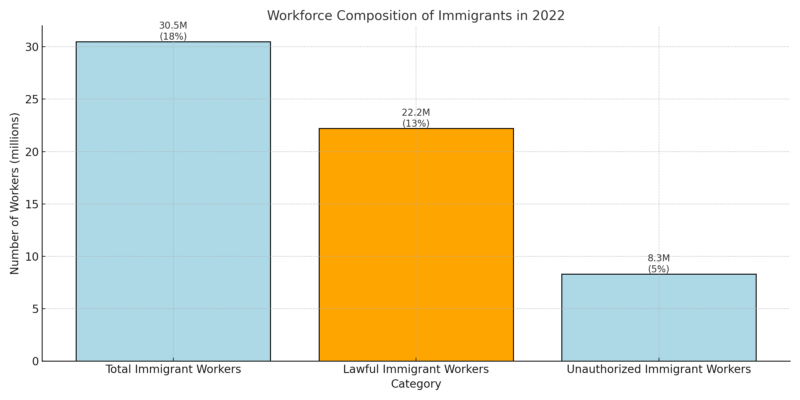
- Lawful immigrants form the majority of immigrant workers, contributing 22.2 million workers, or 13% of the workforce.
- Unauthorized immigrants accounted for 8.3 million workers, or 5% of the workforce.
Trends in the Unauthorized Immigrant Workforce
The number of unauthorized immigrant workers has fluctuated over the years:
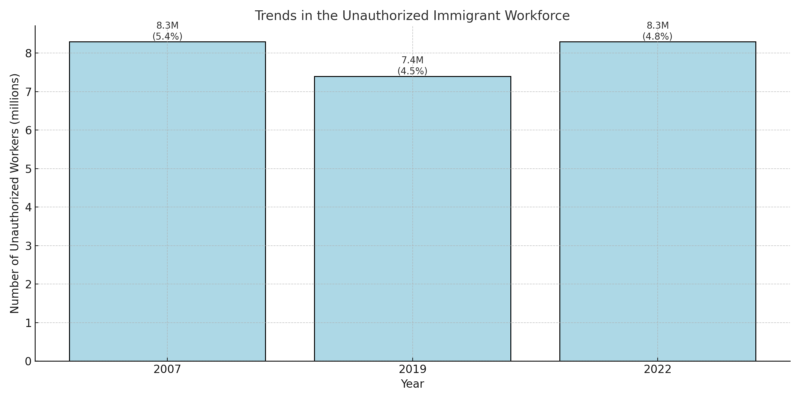
- The unauthorized immigrant workforce peaked at 5.4% in 2007 and has since declined to 4.8% in 2022.
- Despite this decline in percentage terms, the total number of unauthorized workers has remained stable at around 8.3 million, reflecting an increase from 2019 levels.
Comparison with Lawful Immigrants
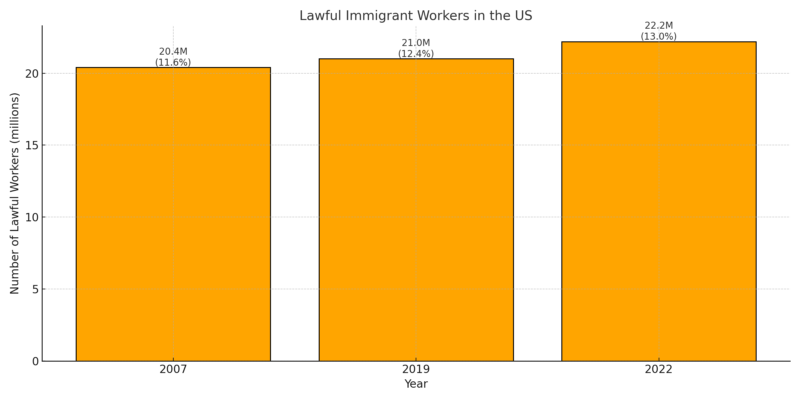
- The number of lawful immigrant workers has grown steadily, rising from 20.4 million in 2007 to 22.2 million in 2022.
- Lawful immigrants continue to represent the majority of immigrant workers in the U.S., reflecting the long-term trend of naturalization and legal residency programs.
Methodology
This article was crafted using data from reputable sources, including USAFacts, CBP, and Pew Research Center, ensuring accuracy. Key trends and statistics were derived from studies by Rand, NIH, and the Migration Policy Institute. We analyzed historical and recent data on migration patterns, labor force participation, and demographic shifts.
Visualizations and tables summarize the most significant changes in border encounters and immigrant populations. Policy impacts, such as Title 42, were examined using official timelines and reports. All findings were cross-verified with multiple sources for consistency.
References
- USA Facts – Border Recidivism & Repeat Illegal Border Crossings
- U.S. Customs and Border Protection (CBP) – Southwest Border Enforcement Report FY 2021
- Rand Corporation – Unauthorized Immigration Trends
- National Institutes of Health (NIH) – Immigration Data Analysis
- Pew Research Center – Rise in U.S. Immigrants from El Salvador, Guatemala, and Honduras
- U.S. Citizenship and Immigration Services (USCIS) – CHNV and U4U Parole Programs
- Migration Policy Institute – Latest Number of U.S. Unauthorized Immigrants
- Pew Research Center – Key Findings About U.S. Immigrants


