West Virginia, located in the central-eastern sector of the United States, was admitted into the Union in 1863.
The current population of West Virginia is 1,766,110 according to the World Population Review.
As the 41st largest and 38th most populous state in the country, its population has grown very slowly since the 1950s, with periods of decline.
West Virginia shares its borders with Pennsylvania to the north, Maryland and Virginia to the east, Kentucky to the southwest, and Ohio to the northwest.
Key Takeaways
- West Virginia’s current population is 1,766,110, with slow growth and periods of decline; the median age is 42.6, reflecting an aging population.
- The state is predominantly White (91.43%), with small proportions of Black (3.41%), multiracial (3.73%), and other racial groups. Females (50.1%) slightly outnumber males.
- Median home prices increased by 14.5% year-over-year to $254,400, with a 22.8% rise in homes sold, indicating strong demand and competitive market conditions.
- The unemployment rate remained stable at 4.2%, with slight declines in the labor force and employment from May to October 2024.
- Life expectancy is 71 years, lower than the national average, with high infant mortality (7.32) and drug overdose death rates (80.9 per 100,000).
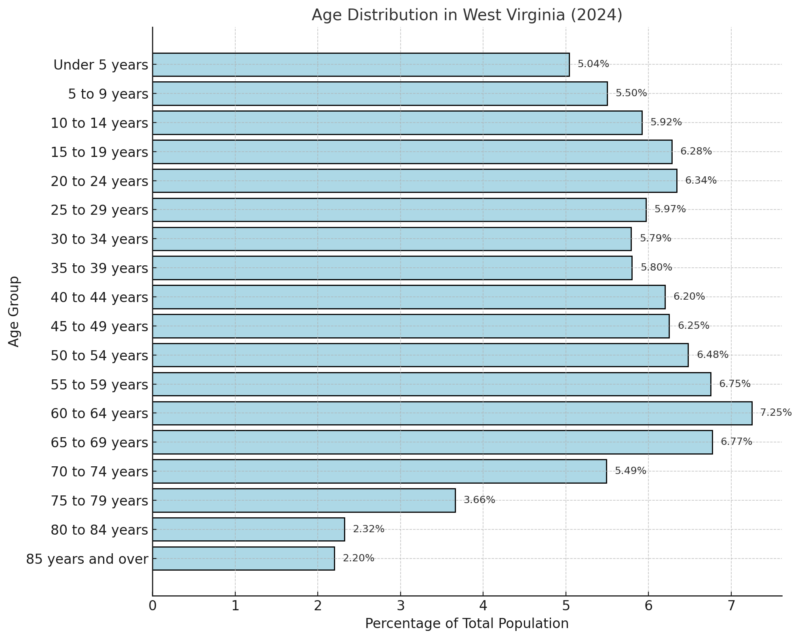
Age Distribution
The median age in West Virginia is 42.6, as reported in the 2018-2022 ACS 5-Year Estimates.
The age distribution of the population is as follows:
Population by Cohorts
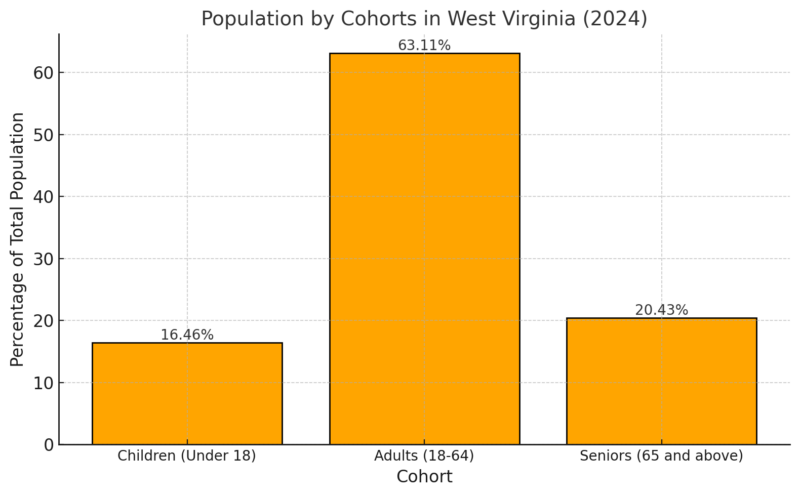
The adult working population (18-64 years) makes up the largest share, at 63.11%, indicating that the majority of residents are in their economically active years.
Seniors (65 and above) account for 20.43%, reflecting the aging population in the state.
Children (under 18) make up 16.46%, showing a smaller proportion of the population, which might affect future workforce availability.
Gender Distribution
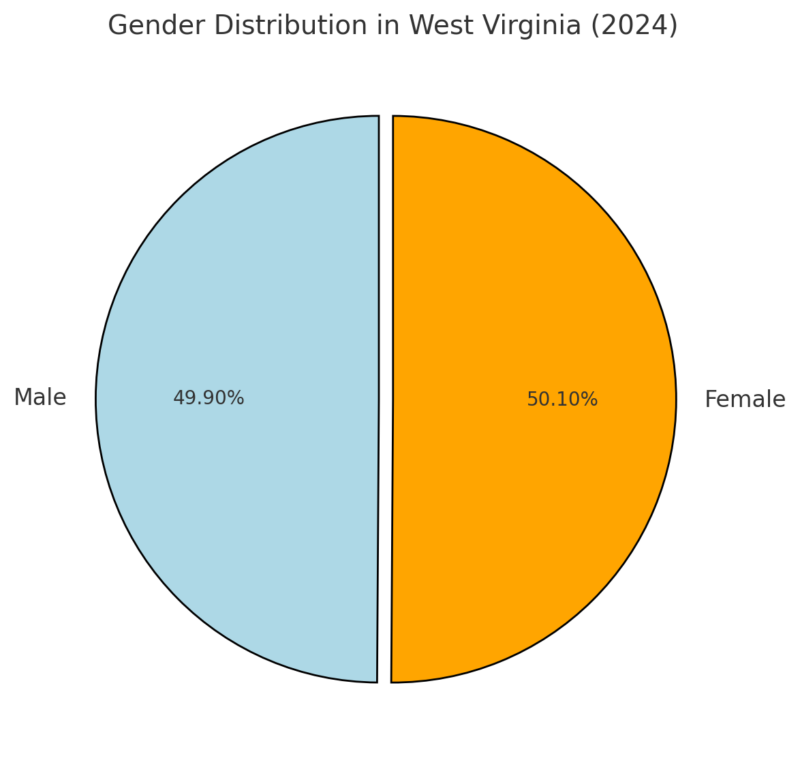
The gender distribution in West Virginia is almost even, with females accounting for a slightly higher percentage (50.10%) than males (49.90%) according to Neilsberg.
Ethnic and Racial Composition
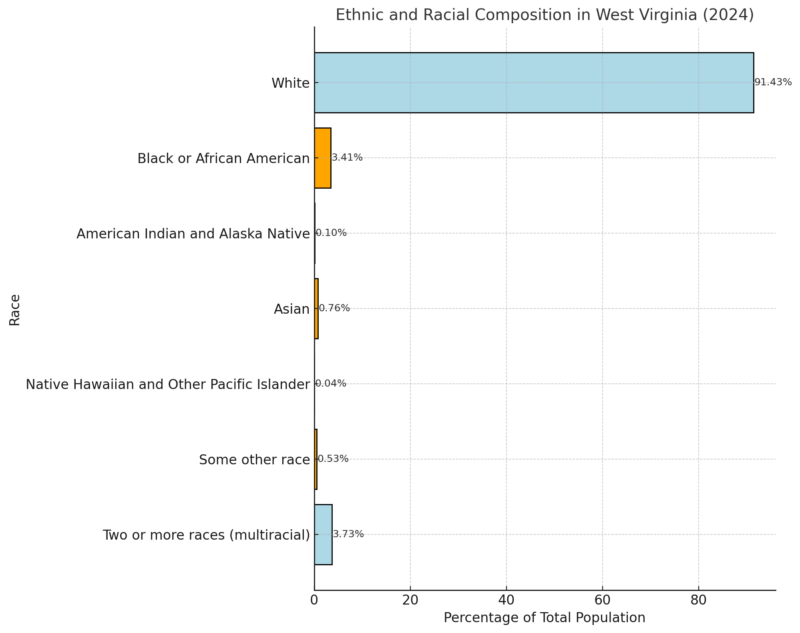
- Neilsberg notes that white residents make up the overwhelming majority of the population, at 91.43%, reflecting a lack of significant racial diversity in the state but also across entire United State.
- Black or African American residents are the second-largest racial group, comprising 3.41% of the population.
- Multiracial individuals account for 3.73%, suggesting a small but notable population identifying with two or more races.
- Other racial groups such as Asian (0.76%), American Indian and Alaska Native (0.10%), and Native Hawaiian and Pacific Islander (0.04%) represent very small percentages, indicating minimal representation.
West Virginia Counties Population 2025
| County | Population | % Change | Area (sq mi) | Density (per sq mi) |
|---|---|---|---|---|
| Kanawha | 173,746 | -3.6% | 348 | 193 |
| Berkeley | 135,501 | 10.43% | 124 | 422 |
| Monongalia | 108,458 | 2.4% | 139 | 301 |
| Cabell | 91,679 | -2.72% | 108 | 326 |
| Wood | 82,716 | -1.69% | 142 | 225 |
| Raleigh | 71,911 | -3.34% | 234 | 119 |
| Harrison | 64,526 | -1.99% | 161 | 155 |
| Jefferson | 60,573 | 4.82% | 81 | 290 |
| Mercer | 57,502 | -3.39% | 162 | 137 |
| Putnam | 56,861 | -1.01% | 134 | 164 |
| Marion | 55,830 | -0.73% | 119 | 181 |
| Ohio | 40,925 | -3.34% | 41 | 386 |
| Fayette | 38,756 | -4.14% | 256 | 59 |
| Wayne | 37,392 | -3.81% | 195 | 74 |
| Preston | 33,976 | -0.62% | 251 | 52 |
| Greenbrier | 31,923 | -2.95% | 394 | 31 |
| Logan | 30,448 | -6.35% | 175 | 67 |
| Marshall | 29,143 | -4.43% | 118 | 96 |
| Hancock | 28,036 | -3.45% | 32 | 338 |
| Jackson | 27,519 | -0.74% | 179 | 59 |
| Randolph | 27,148 | -2.67% | 401 | 26 |
| Mineral | 26,832 | -0.21% | 127 | 82 |
| Mason | 24,619 | -3.09% | 166 | 57 |
| Nicholas | 24,029 | -2.15% | 250 | 37 |
| Hampshire | 23,841 | 3.2% | 247 | 37 |
| Upshur | 23,353 | -1.94% | 137 | 66 |
| Mingo | 21,601 | -8.03% | 163 | 51 |
| Brooke | 21,052 | -6.34% | 34 | 237 |
| Boone | 20,245 | -6.89% | 194 | 40 |
| Wyoming | 19,982 | -6.28% | 193 | 40 |
| Lincoln | 19,551 | -3.99% | 169 | 45 |
| Morgan | 17,863 | 4.54% | 88 | 78 |
| McDowell | 17,072 | -9.84% | 206 | 32 |
| Taylor | 16,366 | -1.95% | 67 | 95 |
| Lewis | 16,326 | -4.08% | 149 | 42 |
| Barbour | 15,365 | -0.66% | 132 | 45 |
| Hardy | 14,334 | 0.67% | 225 | 25 |
| Wetzel | 13,786 | -4.3% | 138 | 39 |
| Roane | 13,653 | -2.39% | 187 | 28 |
| Monroe | 12,442 | 0.47% | 183 | 26 |
| Braxton | 12,154 | -1.97% | 197 | 24 |
| Summers | 11,460 | -4.01% | 139 | 32 |
| Grant | 10,904 | -0.78% | 184 | 23 |
| Ritchie | 8,104 | -3.79% | 174 | 18 |
| Webster | 7,949 | -4.87% | 213 | 14 |
| Tyler | 7,748 | -6.55% | 99 | 30 |
| Pocahontas | 7,733 | -1.62% | 363 | 8 |
| Clay | 7,726 | -3.49% | 132 | 23 |
| Doddridge | 7,648 | -1.77% | 124 | 24 |
| Pleasants | 7,286 | -4.76% | 50 | 56 |
| Gilmer | 7,178 | -2.95% | 131 | 21 |
| Tucker | 6,588 | -2.36% | 162 | 16 |
| Pendleton | 5,991 | -2.3% | 269 | 9 |
| Calhoun | 5,849 | -5.65% | 108 | 21 |
| Wirt | 4,908 | -5.4% | 90 | 21 |
According to the World Population Review West Virginia has 55 counties, with Kanawha County being the most populous, housing Charleston, with a population of 180,454 in 2019, despite a -6.46% decline since 2010. Other populous counties include Berkeley (117,132), which experienced the highest growth rate (11.97%), Monongalia (106,420), and Cabell (93,224).
The least populous county is Wirt County (5,830), which saw modest growth (1.82%). Many small counties, including Tucker (6,955) and Pendleton (6,997), have populations under 10,000, with Webster County (8,285) facing the steepest decline (-9.48%).
Counties with rapid growth include Berkeley (+11.97%), Monongalia (+9.99%), and Jefferson (+5.98%), while McDowell County saw the largest population loss (-17.54%).
Employment Opportunities
| Metric | May 2024 | June 2024 | July 2024 | Aug 2024 | Sept 2024 | Oct 2024 (p) |
|---|---|---|---|---|---|---|
| Civilian Labor Force | 789.2 | 788.7 | 789.0 | 788.1 | 788.3 | 787.6 |
| Employment | 756.1 | 756.0 | 755.9 | 755.3 | 754.9 | 754.3 |
| Unemployment | 33.0 | 32.7 | 33.1 | 32.9 | 33.3 | 33.4 |
| Unemployment Rate | 4.2% | 4.1% | 4.2% | 4.2% | 4.2% | 4.2% |
The Civilian Labor Force experienced a slight decline over the months, moving from 789.2k in May to 787.6k in October according to BLS.
Employment also showed a gradual decrease, dropping from 756.1k in May to 754.3k in October.
Unemployment is near historic lows in WV, but some groups don’t fare as well as others due to longstanding inequities in access to opportunity. Despite changes over time, a gap between men & women persists regarding labor force participation, wages, poverty, & economic security. pic.twitter.com/KiRZOkQ6y0
— West Virginia Center on Budget and Policy (@WVCBP) October 8, 2024
Unemployment remained relatively stable, ranging from 32.7k to 33.4k, with a marginal increase towards October.
The Unemployment Rate fluctuated very slightly, holding steady at 4.2% for most months, with a minor dip to 4.1% in June.
Housing Market Trends
| Metric | Value | Year-over-Year Growth |
|---|---|---|
| Median Sale Price | $254,400 | +14.5% |
| # of Homes Sold | 1,124 | +22.8% |
| Median Days on Market | 52 days | -3 days |
Redfin notes that the median sale price increased significantly by 14.5% year-over-year, reaching $254,400, indicating a strong housing demand and price growth in the state.
The number of homes sold rose sharply by 22.8%, suggesting an active market with increased buyer interest.
The median days on the market decreased slightly by 3 days, reflecting faster sales and high market competitiveness.
Housing Supply
| Metric | Value | Year-over-Year Growth |
|---|---|---|
| # of Homes for Sale | 4,581 | +19.9% |
| # of Newly Listed Homes | 1,288 | +20.8% |
| Months of Supply | 3 months | No change |
The number of homes for sale increased by 19.9%, showing improved housing availability.
The number of newly listed homes grew by 20.8%, indicating that sellers are responding to increased demand.
Despite these increases, the months of supply remained constant at 3 months, suggesting the market is still competitive but not overwhelmed by inventory.
Housing Demand
| Metric | Value | Year-over-Year Growth |
|---|---|---|
| Homes Sold Above List Price | 21.0% | -3.4 points |
| Homes with Price Drops | 26.8% | +17.3 points |
| Sale-to-List Price Ratio | 97.1% | -0.3 points |
21.0% of homes sold above list price, a decline of 3.4 points year-over-year, reflecting slightly less aggressive bidding.
The proportion of homes with price drops increased significantly by 17.3 points, indicating some price corrections as sellers adjust to market conditions.
The sale-to-list price ratio dipped slightly to 97.1%, showing a minor reduction in sellers achieving their initial asking prices.
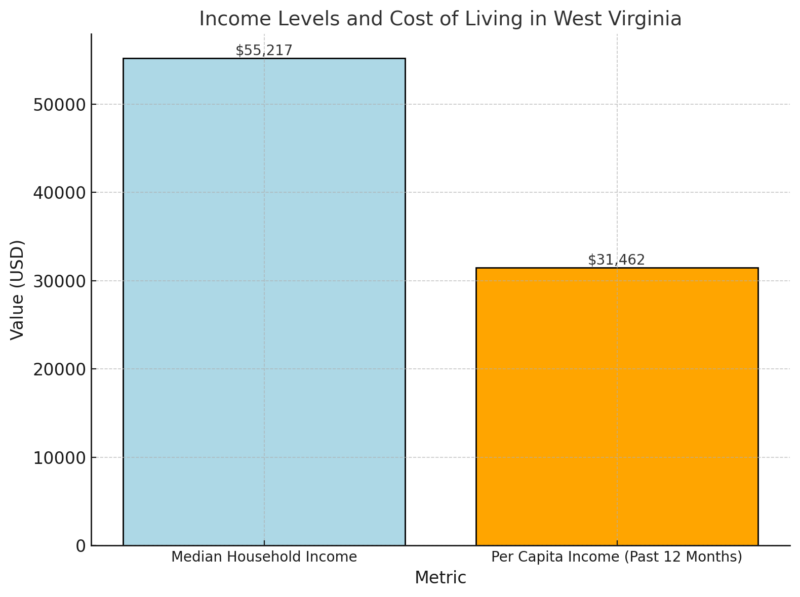
Income Levels and Cost of Living
Poverty Statistics
| Metric | Value |
|---|---|
| Persons in Poverty (%) | 16.7% |
The median household income in West Virginia is $55,217, which is lower than the national average, reflecting the state’s generally lower cost of living and economic challenges according to the US Census.
View this post on Instagram
The per capita income of $31,462 highlights individual earnings and aligns with the broader economic trends in the region.
The poverty rate is 16.7%, significantly higher than the national average, indicating a need for policies addressing economic disparities and poverty alleviation in the state.
Migration Patterns
| Metric | Value |
|---|---|
| Immigrant Population (% of Total Population) | 2% |
| Total Immigrant Population | 27,605 |
| Native-Born U.S. Citizens with Immigrant Parents | 31,448 |
| Gender Breakdown (Immigrants): Women | 13,112 |
| Gender Breakdown (Immigrants): Men | 12,168 |
| Gender Breakdown (Immigrants): Children | 2,325 |
American Immigration Council notes that immigrants make up a small portion (2%) of West Virginia’s total population, with 27,605 individuals.
An additional 2% of the population are native-born U.S. citizens with at least one immigrant parent, reflecting a generational influence of immigration in the state.
The gender distribution shows a balanced population of immigrant men (12,168) and women (13,112), while children make up a smaller share (2,325), highlighting the family-oriented nature of immigration in the state.
Top Countries of Origin
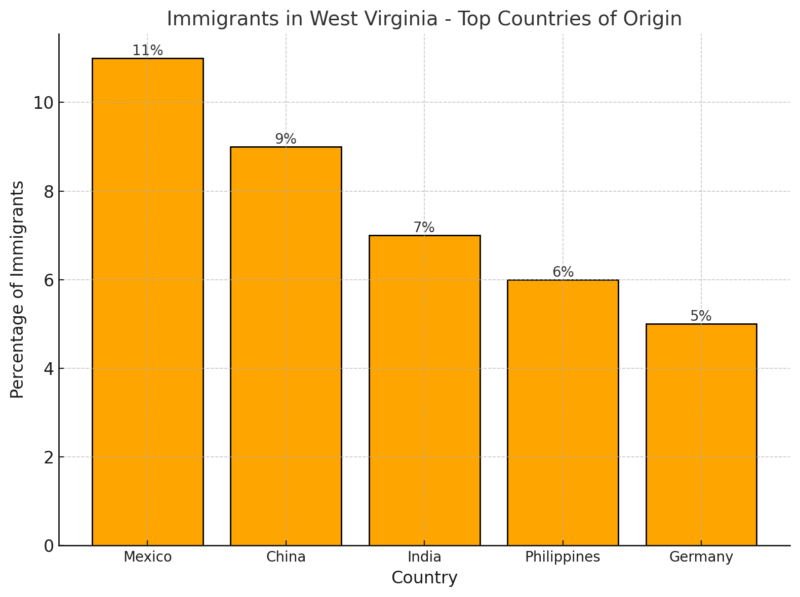
The majority of immigrants in West Virginia come from Mexico (11%), followed by China (9%), showing both regional and global representation.
Immigrants from India (7%), the Philippines (6%), and Germany (5%) further indicate the diversity of origins, reflecting a mix of cultural and professional backgrounds contributing to the state’s economy and community.
Naturalization and Language Proficiency
| Metric | Value |
|---|---|
| Naturalized U.S. Citizens | 14,303 (52%) |
| Eligible for Naturalization (2017) | 6,993 |
| English Proficiency: Speak “Well” or “Very Well” | 93% |
Over half (52%) of West Virginia’s immigrant population has naturalized, highlighting a significant commitment to integration and citizenship.
The high rate of English proficiency (93%) demonstrates the adaptability of immigrants and their active participation in local communities.
Education Levels Among Immigrants (2018)
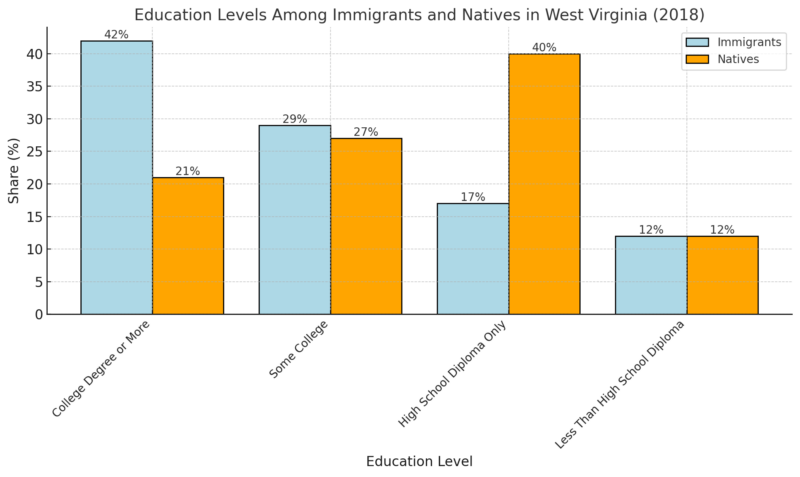
Immigrants in West Virginia are more likely to have a college degree or more education (42%) compared to natives (21%), reflecting a highly skilled and educated immigrant workforce.
The share of immigrants with less than a high school diploma (12%) is equal to that of natives, indicating that the immigrant population is not lagging behind in education.
Health Stats
| Indicator | Value |
|---|---|
| Fertility Rate | 54.0 (births per 1,000 women aged 15-44) |
| Teen Birth Rate | 19.8 (births per 1,000 females aged 15-19) |
| Infant Mortality Rate | 7.32 (infant deaths per 1,000 live births) |
| Life Expectancy (at Birth) | 71.0 years (2021) |
| Marriage Rate | 6.1 (marriages per 1,000) |
| Divorce Rate | 3.2 (divorces per 1,000) |
| Leading Cause of Death | Heart Disease |
| Drug Overdose Death Rate | 80.9 (per 100,000) |
| Firearm Injury Death Rate | 16.2 (per 100,000) |
| Homicide Rate | 6.2 (per 100,000) |
According to the CDC life expectancy at birth is 71 years, which is lower than the U.S. average, reflecting significant health challenges in the state.
The infant mortality rate of 7.32 is higher than the national average, indicating potential gaps in maternal and child healthcare.
The drug overdose death rate (80.9 per 100,000) is alarmingly high, emphasizing the ongoing opioid crisis and substance abuse issues in the region.
Heart disease remains the leading cause of death, consistent with national trends in chronic illness.
Firearm injury and homicide rates highlight safety concerns, though these are moderate compared to some other states.
Birth Data
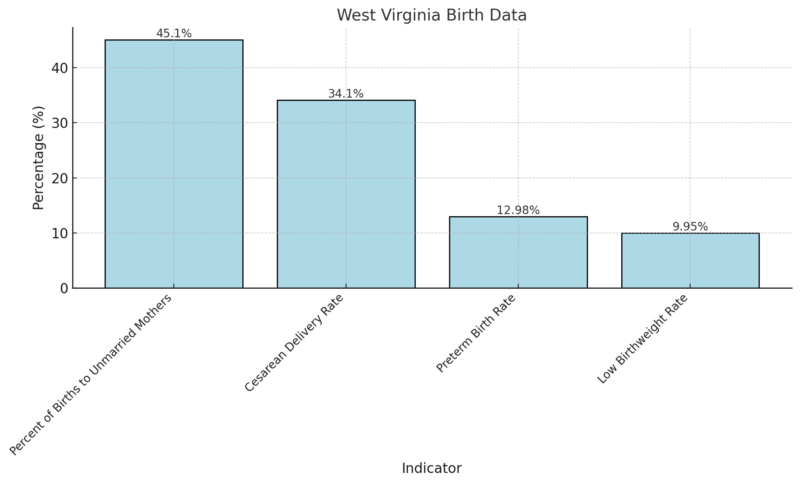
Nearly half of births (45.1%) are to unmarried mothers, suggesting social and economic factors affecting family structure.
The cesarean delivery rate (34.1%) is above the recommended threshold, potentially indicating overutilization of surgical births.
The preterm birth rate (12.98%) and low birthweight rate (9.95%) are concerning, as these are risk factors for infant mortality and long-term health challenges for children. These rates suggest a need for improved prenatal and maternal care services in the state.
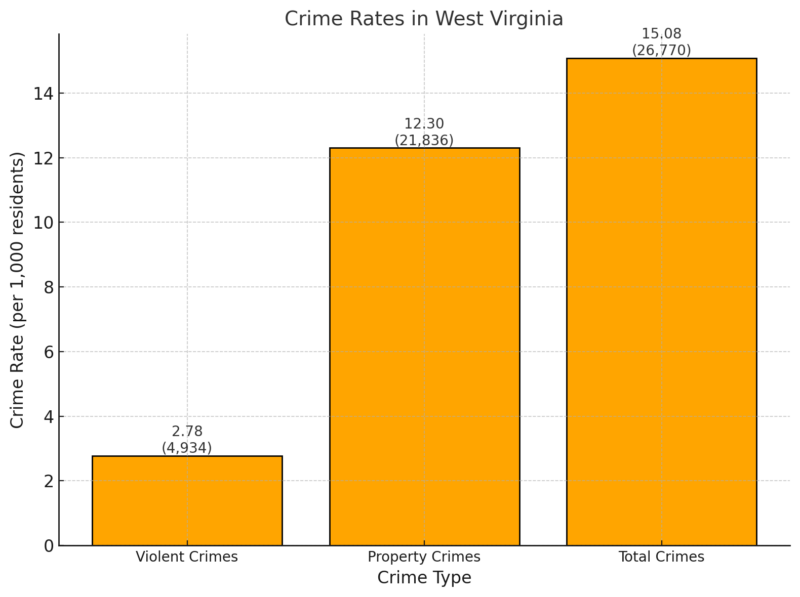
Crime Rates in West Virginia
Violent Crimes in West Virginia (Comparison)
| Crime Type | WV Report Total | WV Rate per 1,000 | U.S. Rate per 1,000 |
|---|---|---|---|
| Murder | 81 | 0.05 | 0.06 |
| Rape | 789 | 0.44 | 0.40 |
| Robbery | 178 | 0.10 | 0.66 |
| Assault | 3,886 | 2.19 | 2.68 |
West Virginia’s violent crime rate is lower than the U.S. average, with particularly low rates of murder (0.05) and robbery (0.10) as noted by Neighborhood Scout.
Property Crimes in West Virginia (Comparison)
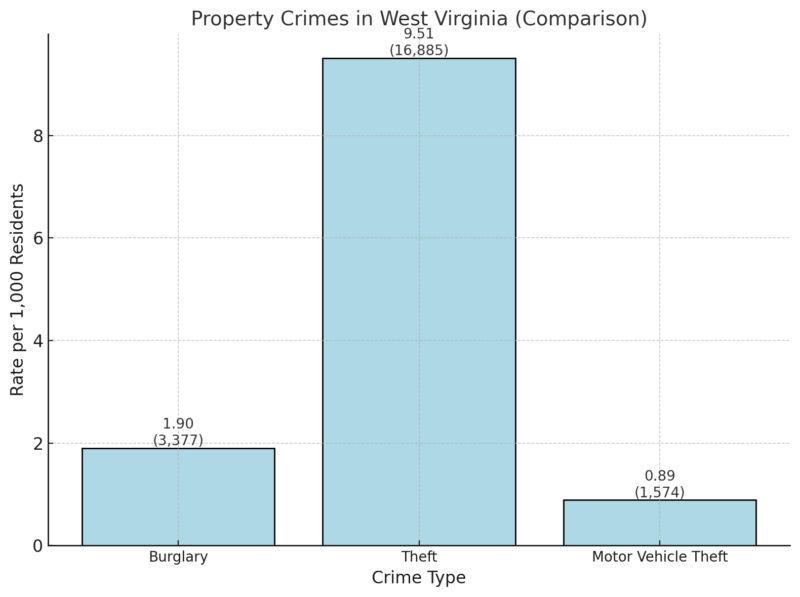
Property crime, particularly theft (9.51 per 1,000), is the most common in West Virginia. The burglary rate is relatively moderate, and motor vehicle theft is less frequent.
Methodology
We gathered information from reliable sources, including government reports, census data, and reputable organizations like the World Population Review and the American Community Survey.
The data was segmented into themes such as demographics, housing, economy, health, immigration, and crime for structured analysis.
Where applicable, state statistics were compared to national averages to provide context and highlight unique trends in West Virginia.
Complex datasets were summarized into concise tables and narratives for clarity and ease of understanding.
Key findings and trends were interpreted to provide insights into economic, social, and population dynamics.
References
- World Population Review – West Virginia Population 2024
- Neilsberg Insights – West Virginia Population by Age
- Neilsberg Insights – West Virginia Population by Gender
- Neilsberg Insights – West Virginia Population by Race
- BLS (Bureau of Labor Statistics) – West Virginia Economic Data
- Redfin – West Virginia Housing Market
- American Immigration Council – Immigrants in West Virginia
- CDC (Centers for Disease Control and Prevention) – West Virginia Health Statistics
- Neighborhood Scout – West Virginia Crime Rates
- U.S. Census Bureau – QuickFacts: West Virgina