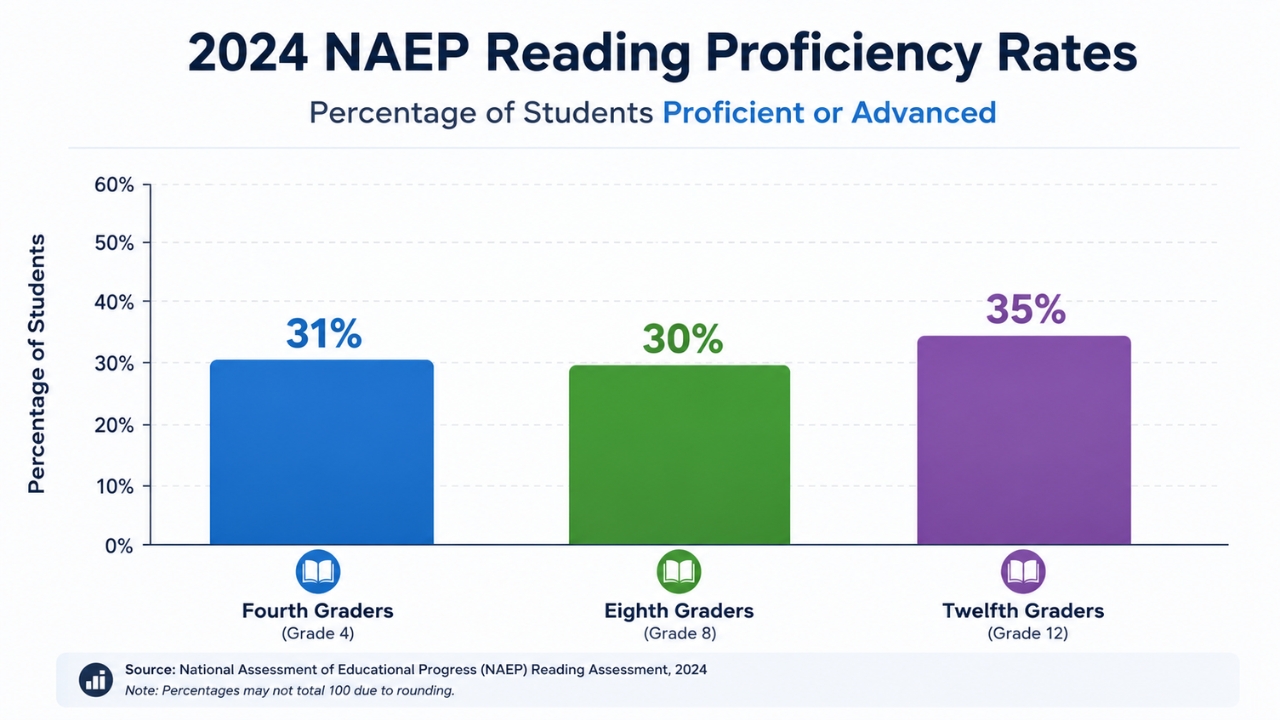
About 31% of U.S. fourth graders scored at or above NAEP Proficient in reading, according to the most recent NAEP reading results.
The most recent results are from 2024; reading proficiency rates were low across tested grades:
Roughly 7 in 10 fourth graders did not reach NAEP Proficient.
In 2024, 69% of fourth graders scored below NAEP Proficient, compared with 70% of eighth graders and 65% of twelfth graders at Basic or below.
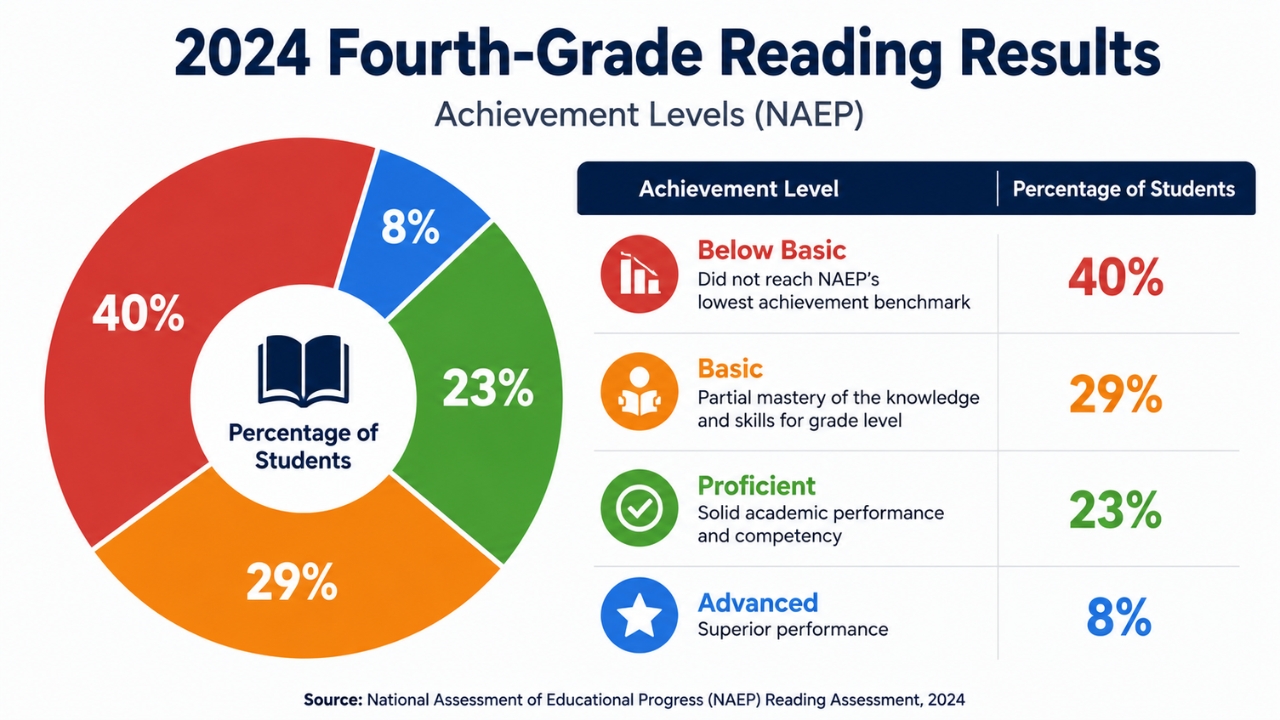
Among fourth graders, 40% scored Below Basic, meaning they did not reach NAEP’s lowest achievement benchmark.
What NAEP Measures
NAEP means the National Assessment of Educational Progress.
Often called The Nation’s Report Card, it tests representative samples of students across the United States.
NAEP assesses reading and math for fourth and eighth-graders about every two years. Twelfth-grade students are assessed about every four years.
Public, private, and charter school students are included, giving the assessment broad national coverage.
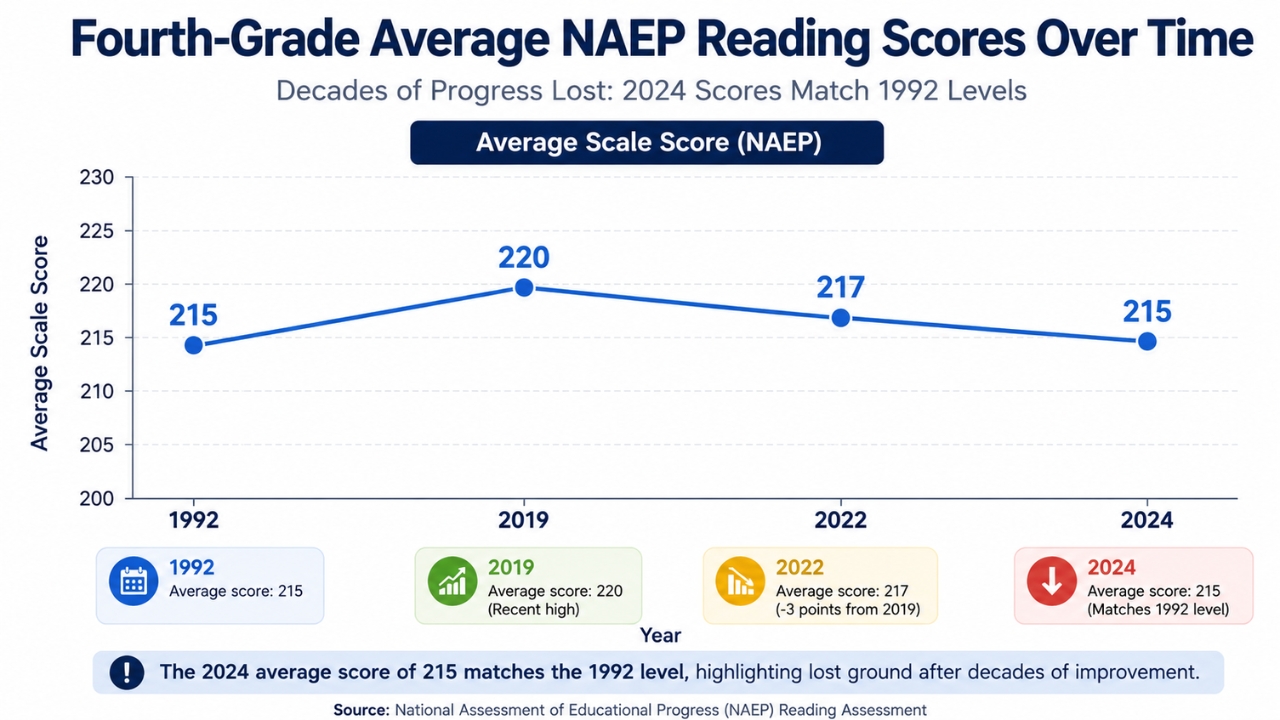
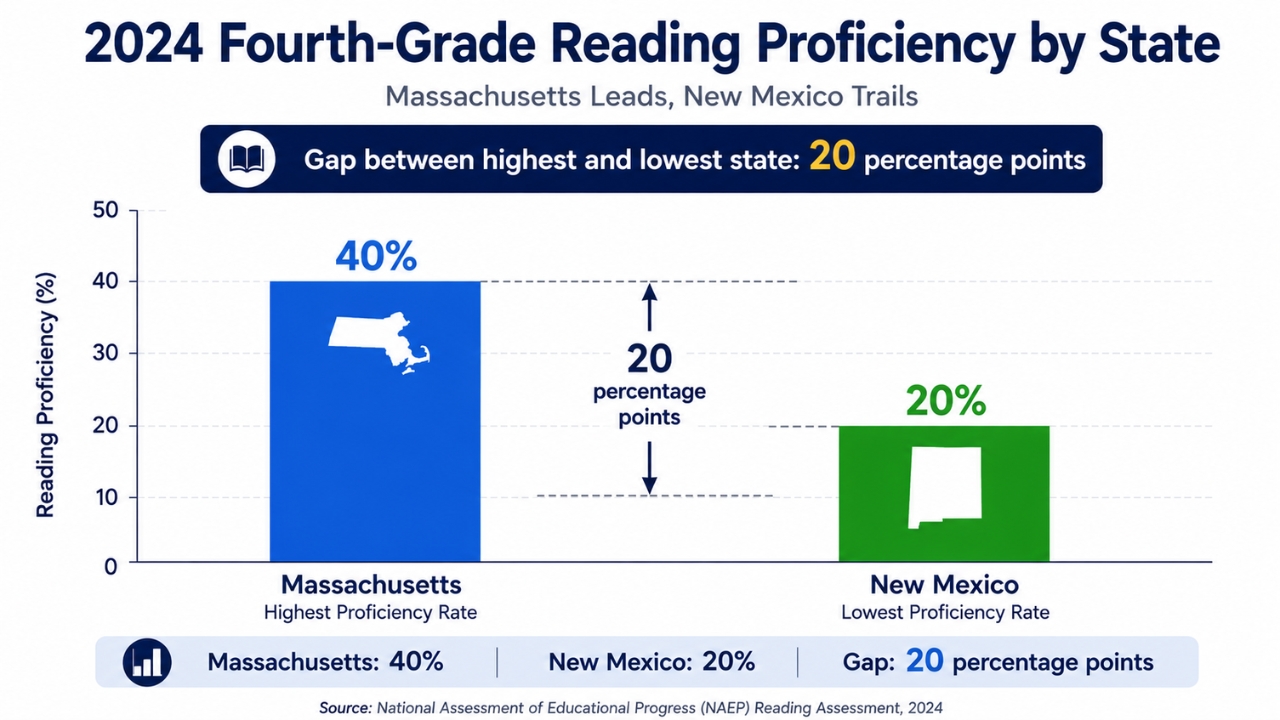
NAEP uses those scores to place students into four achievement levels: Below Basic, Basic, Proficient, and Advanced. Because the assessment uses a consistent national structure, it is one of the clearest tools for tracking reading performance over time. NAEP achievement levels include Below Basic, Basic, Proficient, and Advanced. Each level describes a different degree of academic performance. NAEP Proficient is a high benchmark. It should not be treated as exactly the same as “on grade level.” Students at or above NAEP Proficient demonstrate solid academic performance and competency over challenging subject matter. NAEP results should be read carefully because of those cautions. Even so, the data are valuable because they show how many students meet a nationally consistent reading benchmark. 2024 fourth-grade reading results were divided into four achievement levels: Adding Proficient and Advanced gives the headline figure of 31%. That means less than one-third of fourth graders reached NAEP Proficient or higher. Results also worsened compared with 2022. Below Basic rose from 37% in 2022 to 40% in 2024. Basic stayed at 29%. Proficient fell, falling 24% in 2022 to 23% in 2024. Advanced declined, falling 9% in 2022 to 8% in 2024, although that change was not statistically different. Most concerning, 40% of fourth graders scored Below Basic. Students in that category may struggle to understand a simple story or determine the meaning of familiar words in context. For students who struggle with foundational reading skills, an online reading tutor from Brighterly can provide targeted support in phonics, fluency, comprehension, vocabulary, and writing through one-on-one lessons. According to the 2024 National Assessment of Educational Progress results, only 30 percent of eighth-grade students are reading at a NAEP “proficient” level. Fourth-grade students had similar scores, at 31 percent. Both fourth and eighth- grade scores were not significantly… — Mother Jones (@MotherJones) January 23, 2026 Fourth-grade reading proficiency has fallen compared with earlier years. In 2024, 31% of fourth graders were at or above NAEP Proficient. In 2022, the figure was about 33%. In 2019, it was about 34% to 35%. In 2017, proficiency reached a recent peak of 37%. Average scores show the same pattern: A 2024 average of 215 also matched the 1992 level, suggesting that decades of progress have been lost. Eighth-grade reading also declined. In 2024, eighth-grade reading proficiency was 30%. The average eighth-grade reading score was 258, lower than 260 in 2022 and lower than 263 in 2019. Post-pandemic learning loss may be part of the context, but reading scores had already become a major national concern before the 2024 results. National averages hide major differences among states and jurisdictions. Reading proficiency varies widely across the country. In 2022, fourth-grade public-school reading proficiency was 32% nationally. During that same year, 8 states had a higher percentage of fourth-grade students at or above NAEP Proficient than the nation, while 7 states had a lower percentage. Fourth-grade public-school reading proficiency spanned 21% to 50% across states and jurisdictions in 2022. 2024 results also showed a large state gap: Grade-level patterns also differed by state. In 2024, fourth-grade reading proficiency was higher than eighth-grade proficiency in 37 states and Washington, DC. Nine states had the same rate for fourth and eighth graders. Four states had higher eighth-grade proficiency than fourth-grade proficiency. State results make one point clear: a single national figure cannot show the full scope of student outcomes across the country. Reading proficiency also differs by race, ethnicity, gender, income, disability status, English learner status, and school context. NAEP data can be broken down by race and ethnicity, gender, school type, disability status, and English Learner status, which helps show where achievement gaps have widened or narrowed. Student-group comparisons show large differences in fourth-grade reading performance: Large urban district results show even wider gaps. NAEP gathered 2024 data in 26 large urban school districts. San Diego Unified had the highest fourth-grade reading proficiency rate among those districts at 39%. Detroit Public Schools had the lowest rate at 5%. About 31% of U.S. fourth graders reached NAEP Proficient or Advanced in reading in the most recent reported data. At the same time, 40% scored Below Basic. Fourth-grade reading proficiency also declined over time, falling after a 2017 peak of 37% to 31% in 2024. Average fourth-grade reading scores also dropped, dropping from 220 in 2019 to 217 in 2022 and 215 in 2024. NAEP Proficient is a high standard and is not identical to grade-level reading on state or district tests. Still, the 31% figure points to a major national reading problem, especially as Below Basic rose to 40% and state, district, and demographic gaps stayed wide.
What NAEP Proficient Actually Means
Breakdown of The 2024 Fourth-Grade Reading Results
Trend Over Time – Reading Performance Has Declined
State-By-State Variation
Equity Gaps and Student-Group Differences
FAQs
Summary