

Mortgage rates are back above 7%, and buyers are feeling the difference immediately.
Freddie Mac reported that the average 30-year fixed mortgage rate reached 7.03% on September 24, 2026, up from 6.95% one week earlier. In late February, the same rate had fallen to 5.98%.
That swing changes a monthly payment even when the home price stays exactly the same.
For buyers, the problem is easy to understand. A $400,000 mortgage costs about $2,669 per month at 7.03%, before taxes and insurance. At 5.98%, the payment is about $2,393. The difference is $276 every month.
For sellers, the effect is different. Higher rates remove some buyers from the market, give the remaining buyers more room to negotiate and make it harder for homeowners with older low-rate mortgages to justify moving.
The result is a housing market with more homes for sale and more negotiation, but prices that are still high in much of the country.
Mortgage Rates Have Risen More Than One Percentage Point Since February
The speed of the change is important.
On February 26, the average 30-year mortgage fell to 5.98%, the first reading below 6% in three and a half years. By September 24 it had climbed to 7.03%, according to Freddie Mac’s latest mortgage rate data.
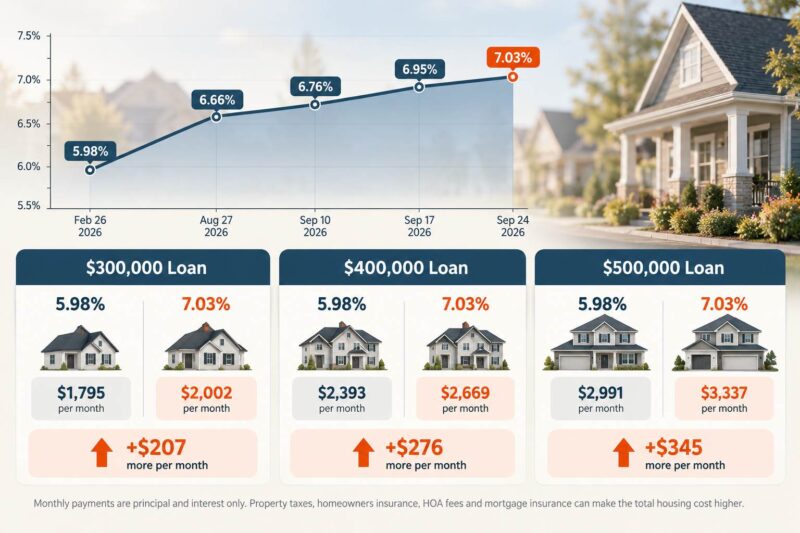
| Date | Average 30-Year Mortgage Rate |
|---|---|
| February 26, 2026 | 5.98% |
| August 27, 2026 | 6.66% |
| September 10, 2026 | 6.76% |
| September 17, 2026 | 6.95% |
| September 24, 2026 | 7.03% |
A move from 5.98% to 7.03% adds about $207 a month to a $300,000 mortgage, $276 to a $400,000 mortgage and $345 to a $500,000 mortgage.
| Loan Amount | Payment at 5.98% | Payment at 7.03% | Difference |
|---|---|---|---|
| $300,000 | $1,795 | $2,002 | +$207 |
| $400,000 | $2,393 | $2,669 | +$276 |
| $500,000 | $2,991 | $3,337 | +$345 |
Those figures cover principal and interest only. Property taxes, homeowners insurance, HOA fees and mortgage insurance can push the actual housing bill much higher.
Earlier this year we covered the brief improvement when mortgage rates dropped below 6%. The September increase has erased that relief for anyone who did not lock in a loan during the spring.
Buyers Are Not Just Paying More, They Are Qualifying for Less
The monthly payment is only part of the story.
Lenders also use income and existing debts to decide how large a mortgage a borrower can carry. When the rate rises, the same monthly budget supports a smaller loan.
A household comfortable with about $2,400 a month in principal and interest could support a mortgage close to $400,000 when rates were near 6%.
At just over 7%, the same payment supports closer to $360,000.
For some buyers, that means looking at smaller homes, moving farther from expensive neighborhoods or increasing the down payment. Others simply leave the market.
Affordability was already stretched before the latest increase. Our recent analysis found that a household needed about $109,796 a year to comfortably afford the typical U.S. home when mortgage rates were still below their current level.
The estimated typical household income was $87,599.
A return above 7% widens that gap unless home prices fall, incomes rise or buyers bring more cash to closing.

Mortgage Applications Are Already Falling
Buyer activity weakened as rates moved higher in September.
The Mortgage Bankers Association reported that mortgage applications fell 1.5% in the week ending September 18. Purchase applications declined 1%, and refinancing applications fell 3%.
MBA measured the average conforming 30-year rate at 7.12%, slightly higher than the Freddie Mac survey because the two reports use different methodologies.
More borrowers also started looking at adjustable-rate mortgages. ARMs accounted for 9.8% of mortgage applications, with the average 5/1 ARM rate more than one percentage point below the fixed 30-year rate.
The full figures are available in the Mortgage Bankers Association survey.
The lower starting payment explains the renewed interest in ARMs, but the rate does not remain fixed forever. Buyers using one need to calculate what the payment would look like after the fixed period ends, not only what they pay during the first few years.
Home Sales Were Weak Before Rates Reached 7%
The market was already slow before the latest jump.
Existing-home sales fell 2% in August to an annualized rate of 3.98 million. That was also 1.2% below August 2025.
At the same time, the number of homes available for sale increased to 1.62 million, the first reading above 1.6 million since November 2019.
The National Association of Realtors reported 4.9 months of supply, the highest level in more than a decade.
| Existing-home sales | 3.98 million annualized |
| Homes for sale | 1.62 million |
| Months of supply | 4.9 months |
| Median existing-home price | $429,100 |
| Annual price change | +1.6% |
The important part is that supply has improved without producing a large national drop in prices.
Buyers have more choices, but the typical existing home still sold for $429,100 in August.
7% Rates Do Not Mean Home Prices Automatically Fall

It would be easy to assume that expensive mortgages must lead directly to cheaper homes.
The U.S. market has spent several years showing why that relationship is more complicated.
Millions of homeowners bought or refinanced when mortgage rates were far below current levels. Federal Reserve Governor Michael Barr said in September that about half of outstanding mortgages still carry rates of 4% or less, while nearly 80% are below 6%.
The Federal Reserve describes the resulting lock-in effect as a force that reduces both selling and buying. A homeowner with a 3.5% mortgage may want another home but face a much larger payment simply by replacing the old loan with a new one near 7%.
Some of those owners stay put instead.
That removes a potential buyer from the market, but it also removes a potential listing.
Research published by the Philadelphia Fed in July reached a similar conclusion. Higher rates reduce transactions because owners delay selling, even when buyer demand is also weaker.
The Philadelphia Fed study found that buyers are more sensitive to higher rates than sellers are to lock-in, which helps explain why sales can collapse without a matching national price collapse.
Sellers Have More Competition Than They Did a Year Ago
Lock-in is still holding some homes off the market, but sellers who do list are facing more competition.
Redfin found that sellers gave concessions in 44.7% of U.S. home sales in August, up from 42.6% one year earlier. About 15% of buyers received both a concession and a price reduction.
Redfin said August was its strongest buyer’s market in data going back to 2013.
Concessions can include money toward closing costs, repairs or mortgage-rate buydowns.
For sellers, that creates a choice. A home may still sell near the desired headline price, but getting the deal closed can require several thousand dollars of help elsewhere.
In local markets with a large increase in listings, buyers have even more room to negotiate.
New Homes Tell a Different Story
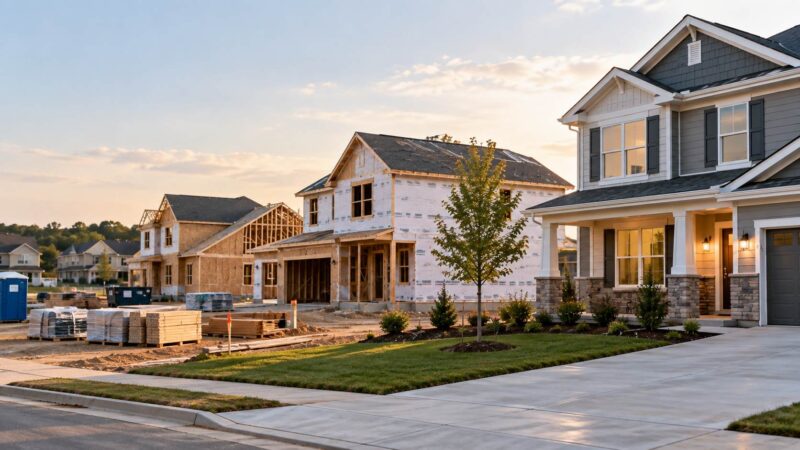
Builders cannot wait indefinitely for market conditions to improve. They have land, construction loans, completed houses and new projects that need to move.
That pressure is already affecting prices.
The Census Bureau reported 684,000 new single-family home sales at an annualized rate in August, up 6.4% from July.
The median price was $393,700, down 5.8% from August 2025. New homes available for sale represented 8.5 months of supply.
The latest figures are available in the Census Bureau’s August new-home sales report.
New-home prices are now below the $429,100 median reported for existing homes, although the two series measure different groups of properties and should not be treated as identical comparisons.
The direction is still useful. Builders have more ability than existing homeowners to change the deal through smaller homes, price reductions, closing-cost assistance or subsidized mortgage rates.
Two-Thirds of Builders Are Already Using Sales Incentives
The pressure is visible in builder surveys as well.
NAHB reported that 66% of homebuilders used sales incentives in September, the highest share since December. Another 38% said they had cut prices, with an average reduction of 6%.
Builder confidence fell to 32, its lowest level since September 2025.
NAHB linked the decline to higher mortgage rates, weaker buyer traffic and rising construction costs.
For a buyer comparing an existing house with a new development, the advertised home price is therefore not enough.
A builder offering a permanent mortgage-rate buydown can sometimes produce a lower monthly payment than an existing homeowner offering a modest price reduction.
Homeowners Still Have Record Equity, but Recent Buyers Are More Exposed
Another reason the current market looks different from the housing crash of the late 2000s is homeowner equity.
ICE reported that mortgage holders had a record $18 trillion in total equity in the second quarter of 2026. About 47.5 million borrowers held $11.7 trillion that ICE classifies as tappable equity.
That gives many long-term homeowners a large financial cushion even if prices stop rising.
The risk is more concentrated among people who purchased recently.
ICE counted about 813,000 underwater borrowers, up 44% from a year earlier. Negative equity was concentrated among FHA and VA borrowers, households that purchased between 2022 and 2025, and parts of Texas and Florida where prices have already fallen from their peaks.
For most owners, 7% mortgage rates are a mobility problem. For a smaller group of recent buyers in weaker markets, falling local prices can create an equity problem as well.
National Prices Are Still High, but Local Markets Are Moving in Different Directions
A national housing average is becoming less useful for anyone deciding where to buy.
FHFA’s latest House Price Index shows that national home values remain high, but the pace of appreciation is far below the pandemic years.
Our review of the same long-term data found that U.S. home prices are about 93% higher than they were ten years ago.
That history is important because today’s buyers are combining mortgage rates above 7% with home prices built on almost a decade of appreciation.
A 7% rate was much easier to absorb when home prices were much lower.
Local supply now determines much of what happens next. Markets with a large number of new listings, builder inventory and slower migration have more room for price cuts. Areas where listings remain limited can continue to support prices even with fewer buyers.
Final Thoughts
Mortgage rates above 7% make buying a home more expensive at a time when prices are still high in many parts of the country.
Buyers now have more listings to choose from and more room to negotiate, but monthly payments remain the biggest problem. Sellers face a smaller pool of qualified buyers, while builders are using more incentives to keep sales moving.
The next few months will depend on how long rates stay near current levels and how much inventory continues to build. For now, buyers have more leverage than they did a year ago, but affordability is still difficult.
References
- Freddie Mac, Primary Mortgage Market Survey
- Freddie Mac, Mortgage Rates Drop Below 6% for the First Time in 3.5 Years
- Mortgage Bankers Association, Weekly Mortgage Applications Survey
- National Association of Realtors, August Existing-Home Sales
- Federal Reserve Board, Michael Barr Speech on Housing
- Federal Reserve Bank of Philadelphia, Mortgage Lock-In Research
- U.S. Census Bureau, New Residential Sales August 2026
- NAHB, September 2026 Housing Market Index
- ICE, August 2026 Mortgage Monitor
- Federal Housing Finance Agency, House Price Index
- Redfin, August 2026 Seller Concessions
- The Wall Street Journal, Mortgage Rates Just Hit 7%