Texas continues to attract attention as one of the fastest-growing states in the United States.
The population of Texas reached approximately 31,290,831 residents according to Census data.
Texas added 562,941 residents between July 2023 and July 2024
In the last census of 2020, it had 29,145,505 residents.
According to World Population Review, it will hit the mark of 32 million soon.
With a robust growth rate, the Texas population is projected to reach over 45 million by 2040.
Looking at county population estimates, it is evident that Texas is not only growing but transforming.
These estimates are poised to undergo revisions, further emphasizing the dynamic nature of Texas’s demographic changes.
Key Takeaways
- Texas is growing rapidly, with a current population of about 31.29 million and projected to surpass 45 million by 2040.
- Texas’s GDP in Q3 2023 was $2.6 trillion, representing 9.1% of the U.S. economy, with the tech, healthcare, and energy sectors leading growth.
- The state had a 7.7% GDP growth rate in Q3 2023, indicating a robust economy.
- Texas has a diverse population with 59.14% White, 12.15% Black, and 39.8% Hispanic residents.
- The median age is 35.6 years, reflecting a relatively young population compared to the national average.
- The unemployment rate in Texas was 4.1% in November 2023, higher than the national average.
Demographics of Texas in 2025
View this post on Instagram
Texas population reached approximately 31,290,831 residents. This growth rate of 1.80% ranks Texas third nationally for population increase.
The largest proportion of the population resides in urban areas, such as Houston, Dallas-Fort Worth, and Austin. This urban concentration reflects ongoing trends of economic opportunities in major cities.
Residents are diverse in ethnicity and culture. The demographic breakdown includes a mix of Hispanic, Caucasian, African American, and Asian populations.
Economic Factors
In 2022, the GDP of Texas’ Upper East region was more than that of the entire state of Alaska, yet it only accounted for 2.8% of Texas’ total GDP. pic.twitter.com/hzwqPvlmEW
— Texas Comptroller (@txcomptroller) June 11, 2024
- Major industries: Technology, healthcare, energy, and agriculture
- State GDP: Among the highest in the U.S., $2.6 trillion
- Employment: High job growth rate, especially in tech and service sectors, 1.4%
Education remains a focus, with in-state universities attracting students nationwide. The investment in education fuels Texas’s reputation as a hub for research and innovation.
Age Data
The median age of the population is 35.6 years, which is about 90% of the U.S. median age of 39 years, indicating a younger population compared to the national average, according to Census Reporter.
| Description | Value |
|---|---|
| Median Age | 35.6 years |
| Comparison to U.S. Median Age | About 90% of the U.S. median (39 years) |
Population by Age Range
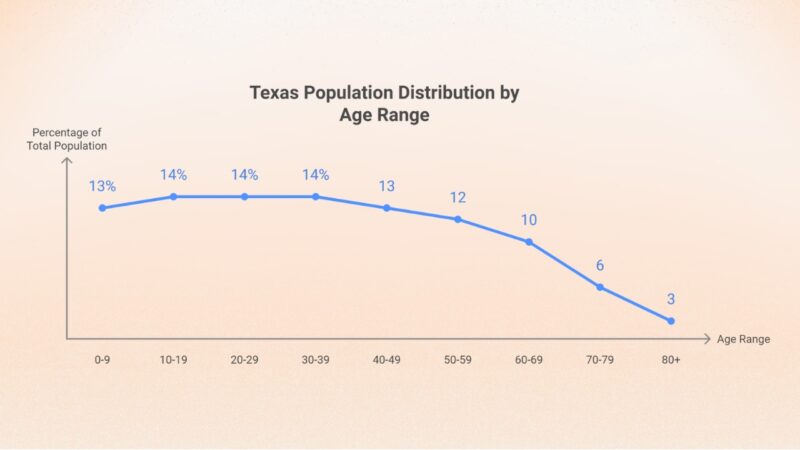
The age distribution is relatively even across the younger adult age ranges (10-39 years), each accounting for 14% of the population. The share decreases for older age groups, with the highest age range (80+ years) making up only 3% of the population.
Population by Age Category
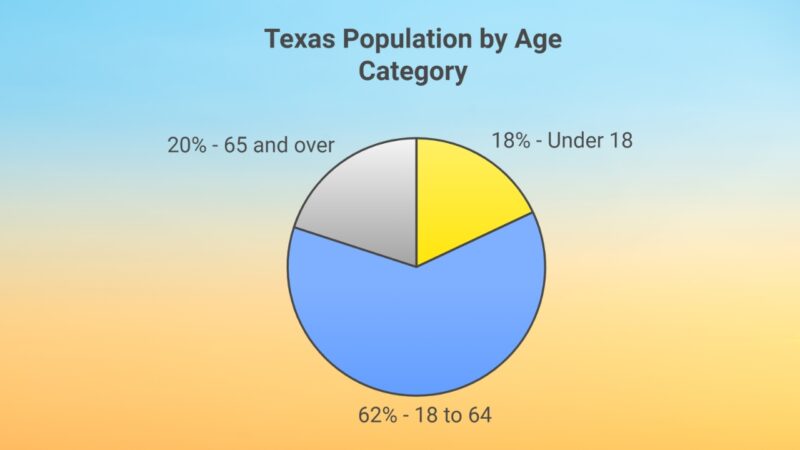
- The majority of the population (62%) falls within the 18 to 64 years category, which is the typical working-age group.
- 18% of the population is under 18, while 20% is 65 and over, indicating a balanced demographic with a significant working-age population and a notable elderly segment.
Sex Data
| Sex | Percentage of Total Population |
|---|---|
| Female | 50.4% |
| Male | 49.6% |
Texas population is split almost evenly between males and females, with each accounting for almost 50% or little above of the population. This is consistent with the overall gender distribution observed across the United States.
Ethnic and Racial Demographics
| Race and Hispanic Origin | Percentage |
|---|---|
| White alone | 76.8% |
| Black alone | 13.6% |
| American Indian and Alaska Native alone | 1.1% |
| Asian alone | 6.0% |
| Native Hawaiian and Other Pacific Islander alone | 0.2% |
| Two or More Races | 2.3% |
| Hispanic or Latino | 39.8% |
| White alone, not Hispanic or Latino | 39.6% |
White Alone (76.8%): This is the largest racial group. However, when excluding Hispanic or Latino individuals, the percentage drops to 39.6%, suggesting a substantial portion of the White population also identifies as Hispanic or Latino according to Census.gov.
Black Alone (13.6%): This is the second-largest racial group in the dataset.
American Indian and Alaska Native Alone (1.1%): This group represents a smaller portion of the population, reflecting indigenous communities’ presence.
Asian Alone (6.0%): The Asian population is a significant minority and likely growing due to immigration trends.
Native Hawaiian and Other Pacific Islander Alone (0.2%): This is the smallest racial group in the dataset.
Two or More Races (2.3%): This group represents a small but notable percentage of the population, reflecting the increasing number of multiracial individuals.
Hispanic or Latino (39.8%): This is a substantial portion of the population, demonstrating the significant influence of Hispanic culture and heritage
Unemployment Rate in Texas
| Month | Civilian Labor Force (in thousands) | Employment (in thousands) | Unemployment (in thousands) | Unemployment Rate (%) |
|---|---|---|---|---|
| July 2024 | 15,353.6 | 14,731.4 | 622.3 | 4.1 |
| Aug 2024 | 15,398.4 | 14,771.4 | 626.9 | 4.1 |
| Sept 2024 | 15,449.8 | 14,819.7 | 630.1 | 4.1 |
| Oct 2024 | 15,497.0 | 14,858.7 | 638.4 | 4.1 |
| Nov 2024 | 15,536.0 | 14,884.5 | 651.5 | 4.2 |
| Dec 2024 | 15,575.9 | 14,922.2 | 653.7 | 4.2 |
The civilian labor force increased steadily from 15,353.6 thousand in July 2024 to 15,575.9 thousand in December 2024, according to BLS.
This represents a continuous expansion in the available workforce.
Employment also showed consistent growth, rising from 14,731.4 thousand in July to 14,922.2 thousand in December.
This suggests job creation and a growing economy.
Despite employment growth, unemployment also rose from 622.3 thousand in July to 653.7 thousand in December.
This indicates that more people are entering the labor force than jobs are being created.
The unemployment rate remained stable at 4.1% from July through October.
In November and December, the rate slightly increased to 4.2%, showing a minor uptick in unemployment.
State Unemployment Rankings (November 2023)
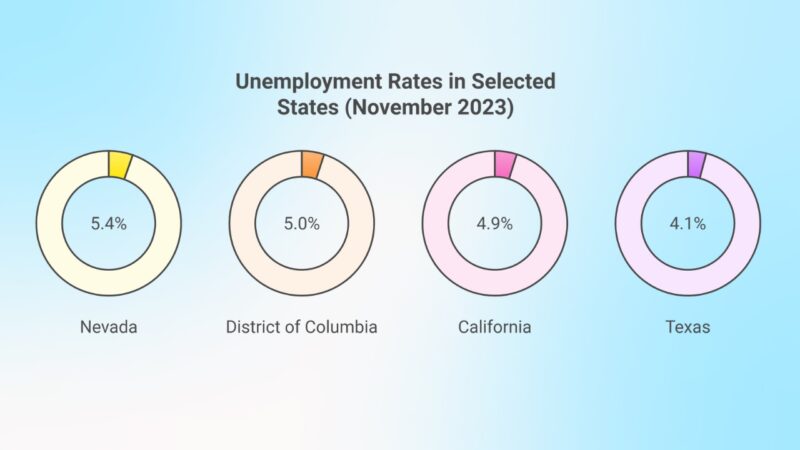
Texas is ranked 13th in terms of the highest unemployment rate, suggesting a significant number of job seekers relative to the workforce. Meanwhile, Arkansas saw a positive shift with its unemployment rate dropping from 3.5% in January to 3.3% by June.
States like Nevada and California face even higher unemployment, while North Dakota has the lowest at 1.8%.
Real Gross Domestic Product (GDP) Growth for Texas
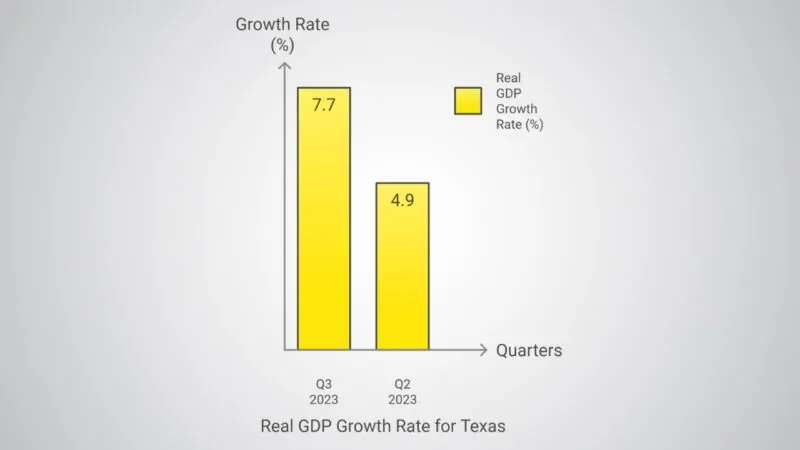
In the third quarter of 2023, Texas saw a real GDP growth rate of 7.7%, higher than the 4.9% growth from the previous quarter, showing strong economic activity. This growth was largely driven by sectors like agriculture, forestry, and construction.
Real GDP Growth by Industry in Texas (Q3 2023)
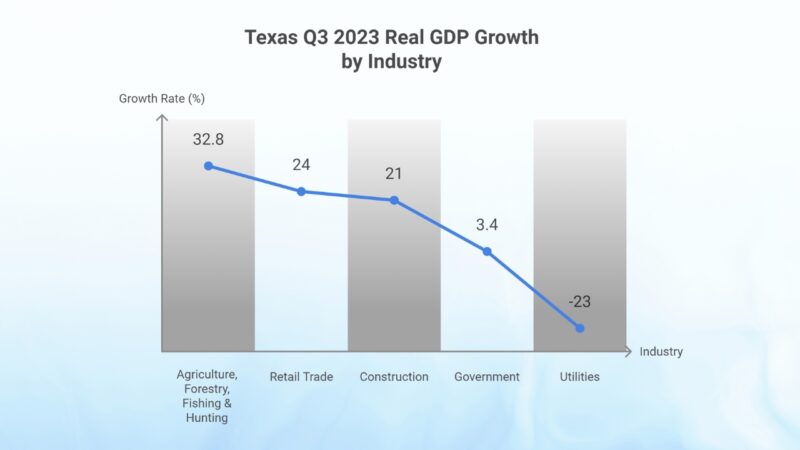
Agriculture, forestry, fishing, and hunting led the economic growth in Texas at 32.8%, while sectors like utilities experienced a decline of -23%. Overall, most industries showed positive contributions, reflecting diversified growth.
Texas’ Real GDP and Share of the U.S. Economy
| Description | Value |
|---|---|
| Real GDP (Q3 2023) | $2.6 trillion |
| Share of the U.S. Economy | 9.1% |
| Economy Size Rank in U.S. | 2nd |
Texas is now valued at $2.6 trillion, based on GDP for 2023 (up from $2.4 trillion in 2022), making Texas the second-largest economy among U.S. states after California, according to the Texas gov.
State Ranking by Share of U.S. Economy (Q3 2023)
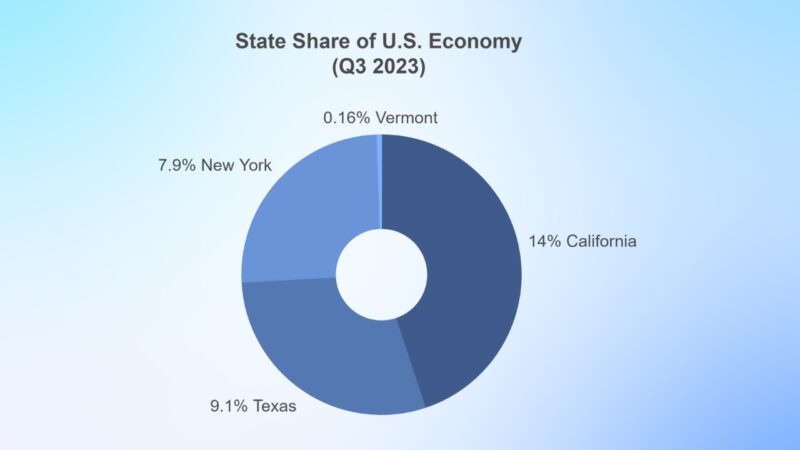
Texas is ranked second in terms of economic contribution to the U.S., behind California at 14%. This indicates Texas’ significant role in the overall U.S. economic landscape, thanks to its size and diverse industries.
Texas Labor Market Report – December 2024
The Texas labor market reached a record high in December, with nonfarm jobs and the civilian labor force hitting new peaks. The state added 37,500 jobs during the month, bringing the total to 14,318,700 nonfarm positions.
Over the past year (December 2023 to December 2024), Texas added 284,200 jobs, reflecting an annual nonfarm job growth rate of 2.0%, which surpassed the U.S. growth rate by 0.6 percentage points according to texas.gov.
December marked the twelfth consecutive month of labor force expansion, reaching 15,575,900 individuals, an increase of 39,900 people in a single month. Over the years, the labor force grew by 445,300 people. The seasonally adjusted unemployment rate stood at 4.2%.
According to TWC Chairman Bryan Daniel, the record-high jobs and labor force figures highlight Texas’s economic strength. He reaffirmed TWC’s commitment to connecting job seekers with employers and expanding job training programs to support continued growth.
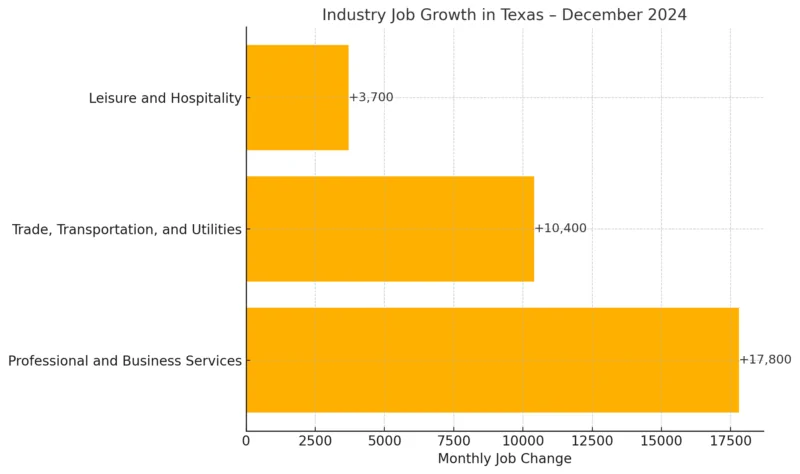
Industry Performance in December 2024
The Professional and Business Services sector experienced the most substantial monthly job growth, adding 17,800 jobs. Other key sectors also saw significant increases:
- Trade, Transportation, and Utilities: +10,400 jobs
- Leisure and Hospitality: +3,700 jobs
- Financial Activities: Grew 3.6% over the year, outperforming the national industry growth rate by 3.0 percentage points.
TWC Commissioner Alberto Treviño III emphasized the strength of Texas’s diverse economy, encouraging job seekers to utilize TWC resources to find rewarding career opportunities.
Texas Metropolitan Statistical Area (MSA) Unemployment Rates
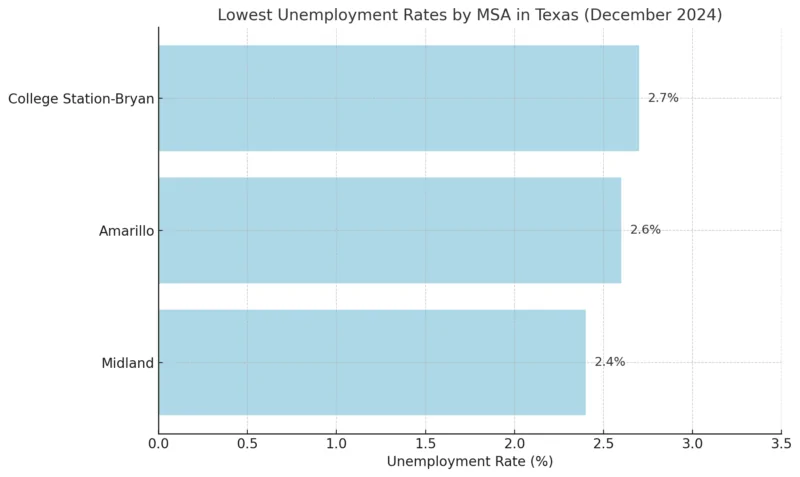
Among Texas MSAs, Midland recorded the lowest unemployment rate at 2.4% (not seasonally adjusted), followed by:
- Amarillo MSA: 2.6%
- College Station-Bryan MSA: 2.7%
TWC Commissioner Representing Employers stated that Texas job creation continues to surpass the national pace, reflecting a strong and expanding economy.
Texas Labor Market Data – December 2024
| Category | December 2024 | Monthly Change | Annual Change |
|---|---|---|---|
| Nonfarm Jobs (in thousands) | 14,318.7 | +37.5 | +284.2 |
| Nonfarm Job Growth Rate (%) | 2.0% | – | +0.6 pp above U.S. |
| Civilian Labor Force (in thousands) | 15,575.9 | +39.9 | +445.3 |
| Unemployment Rate (%) | 4.2% | – | – |
Industry Job Growth – December 2024
Lowest Unemployment Rates by MSA (December 2024)
This report highlights Texas’s economic resilience, strong labor market performance, and ongoing job opportunities across multiple industries.
Housing Market Trends
| Category | December 2024 | Year-over-Year Growth (%) |
|---|---|---|
| Median Sale Price | $350,600 | +2.5% |
| Number of Homes Sold | 25,733 | +12.3% |
| Homes for Sale | – | +13.6% |
| Median Days on Market | 65 days | +9 days |
Home prices increased by 2.5% year-over-year, with the median home price at $350,600 according to Redfin.
The number of homes sold rose significantly (12.3%), indicating increased buyer activity.
Homes for sale grew by 13.6%, suggesting more inventory availability in the market.
The median days on the market increased by 9 days, bringing the total to 65 days.
This indicates that while sales are increasing, homes are taking slightly longer to sell compared to last year.
Home Sales and Listings
Texas saw a 15.4% increase in home sales from June to July, with 27,049 homes sold statewide, as per TRERC. Major cities like Houston and Dallas experienced sales increases of 21.7% and 18.1% respectively.
However, new listings across the state have been declining, which suggests a tightening housing supply.
For instance, Houston saw a 24.7% drop in new listings, while Austin reported an 18.8% drop.
Top 10 Metros in Texas with the Fastest-Growing Sales Prices
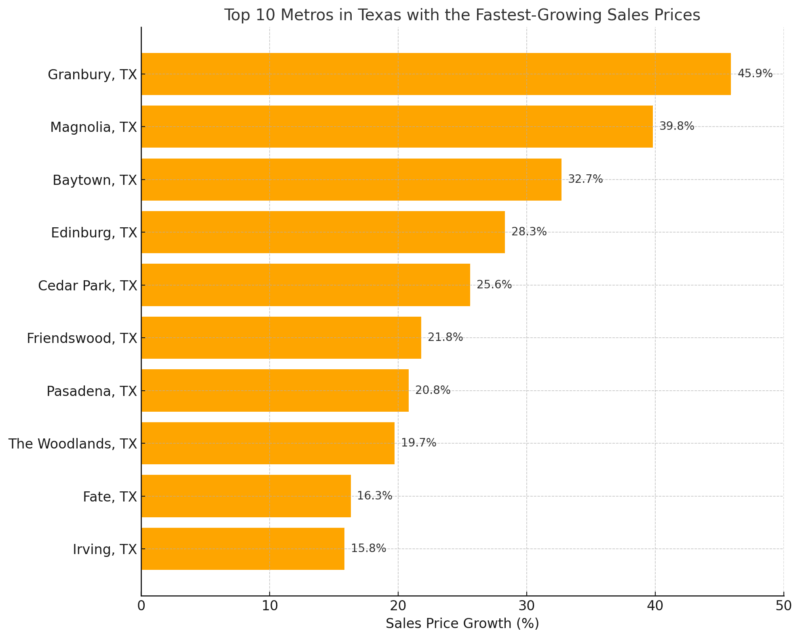
Granbury, TX saw the highest price growth at 45.9%, followed by Magnolia, TX (39.8%) and Baytown, TX (32.7%).
Smaller and suburban cities are experiencing rapid appreciation, likely due to increased demand and affordability compared to major metro areas.
Social and Political Implications
The population of Texas has grown more diverse, with 91% of new Texans being people of color.
This demographic shift is likely to influence voting patterns, making Texas a more competitive electoral battleground.
As more newcomers participate in the voting process, political parties are adjusting their strategies to engage these new voters.
Healthcare System and Services

According to the Texas Health and Human Services Commission, healthcare services include a variety of critical care offerings such as immunizations, maternal care, and specialized treatment centers for chronic conditions like diabetes and cancer.
Many regions, especially rural areas, continue to face shortages of healthcare professionals and essential facilities, putting pressure on urban centers that are already strained with increasing demands for specialized care.
Public clinics and maternal health services are increasingly essential, especially in regions with a high percentage of births, as 5.7% of women aged 15-50 gave birth within the past year—higher than the national average of 5.2% according to Census Reporter.
For those without insurance or those requiring specific health services like immunizations, the 2-1-1 Texas program provides support and direction, connecting residents to public clinics and offering essential medical services, including immunization clinics, rehabilitation, and maternal care.
Education System Challenges
View this post on Instagram
The Texas Higher Education Coordinating Board (THECB) data shows a renewed focus on enrollment trends in higher education, with specific emphasis on expanding access to underrepresented groups to meet the state’s evolving economic needs.
The educational attainment in Texas is slightly below the national average, with 86.1% of the population having a high school diploma or higher compared to 89.6% nationwide. Similarly, only 33.9% hold a bachelor’s degree or higher, compared to 35.7% nationally as per Census Reporter.
Comparison With Other States

Texas is currently the second most populous state in the United States, boasting a population of over 30 million residents as of 2024. This significant number is only surpassed by California, which remains the most populous state, with a population of nearly 39 million.
Population Growth Rates: Texas Vs Some States
- Texas: The population of Texas is growing at an approximate annual rate of 1.8%. This growth rate reflects the state’s booming economy and continued influx of both domestic and international migrants. Texas has also become a popular destination for businesses and individuals seeking a lower cost of living compared to California.
- California: By contrast, California’s population growth has stagnated, with some estimates even indicating a decline in certain years. This slowdown is attributed to multiple factors, including the rising cost of living, housing shortages, and an increasing trend of residents moving to other states. In 2021, California experienced its first recorded population decline, and growth has remained sluggish since then, at a rate well below 0.5% annually.
- Florida: Florida is the third most populous state in the U.S., with a population of around 22 million as of 2024. Florida has maintained steady growth, driven by both domestic and international migration, particularly among retirees and those attracted to its favorable tax environment. Florida’s growth rate is approximately 1.3% per year, which, while significant, does not match the rapid expansion observed in Texas.
Projected Population Growth

- Texas is expected to continue its strong growth trajectory, with projections indicating that the population could exceed 45 million by 2040. This expansion will significantly impact infrastructure needs, healthcare, education, and political representation.
- North Texas continues to be the most populous area in the state, exceeding 8.3 million people, fueled by rapid growth in Collin, Tarrant, Denton, Rockwall, and Kaufman counties, based on recent data from the Texas Demographic Center.
- California’s growth outlook remains less robust. Challenges such as high housing costs and migration outflows are expected to keep the growth modest, with some estimates suggesting its population may stabilize rather than increase substantially over the coming decades.
- Florida is also projected to grow, reaching 26 million by 2040. The state’s aging population and a steady influx of new residents will continue to fuel its growth, albeit at a slower rate compared to Texas.
Policy Responses and Recommendations
As the population has increased by 40% since 2000, with a significant rise among people of color, policymakers must address these changes with nuanced strategies for representation and resource allocation.
Reliable demographic data should inform redistricting to ensure fair political representation. The existing political maps have not kept pace with demographic shifts, leading to disproportionate representation. This can be addressed through transparent redistricting processes that reflect the diverse population of Texas.
Education and infrastructure require urgent attention. As population densities rise in urban and suburban areas, education systems need additional funding to accommodate student influxes.
Recommendations
- Conduct detailed studies on population shifts for informed policy development.
- Increase funding for public education to meet the needs of growing student bodies.
- Prioritize infrastructure improvements to handle urban and suburban expansion.
Incorporating these recommendations into state policies will address the evolving needs of Texas’s dynamic demographic landscape. Such measures can ensure that all Texans benefit equitably from economic and social opportunities in the state.
FAQ
Methodology
To craft this article, we employed a comprehensive methodology, beginning with an analysis of demographic data from reputable sources such as the U.S. Census Bureau and World Population Review to highlight Texas’s rapid population growth and diverse demographics.
We then examined recent economic statistics, including GDP and employment data, to capture the state’s economic dynamism and industry drivers.
Trends in social factors, including education, healthcare, and infrastructure, were identified using government reports and recent studies to understand population impacts.
Finally, we integrated comparative analysis with other U.S. states to provide context on Texas’s unique growth trajectory and the implications for future policy considerations.
References:
- U.S. Census Bureau – QuickFacts Texas
- World Population Review – Texas Population 2024
- Demographics Texas – Texas Population Estimates Program
- Census Reporter – Texas Profile
- Neilsberg – Population by Race in Texas
- USA Facts – Economy of Texas
- Texas Government – Texas Economic Snapshot
- Dallas Federal Reserve – Texas Economy Overview
- Dallas Federal Reserve – The Labor Market May Be Tighter Than It Seems
- Texas Tribune – Texas’ Population Has Changed Faster Than Its Political Maps
- Texas Real Estate Research Center (TRERC) – Texas Housing Insight July 2024 Summary
- Redfin – Texas Housing Market Overview
- Bureau of Labor Statistics (BLS) – Texas Employment & Unemployment Data
- Texas Workforce Commission (TWC) – Texas Labor Market Growth
- Texas Higher Education Coordinating Board (THECB) – Texas Higher Education Enrollment Data
- 211 Texas – Healthcare and Social Services in Texas
- Texas Demographic Center – Population Projections for Texas