
Kentucky’s current population in 2025 is approximately 4,540,740, making it the 26th most populous state in the U.S. according to the World Population Review.
The state’s population growth rate is 0.47%, ranking 34th among all states.
Formerly part of Virginia, Kentucky became the 15th state to join the Union in 1792.
Kentucky shares borders with seven states: Illinois, Indiana, and Ohio to the north, West Virginia and Virginia to the east, Tennessee to the south, and Missouri to the west.
Key Takeaways
Kentucky Population by Age
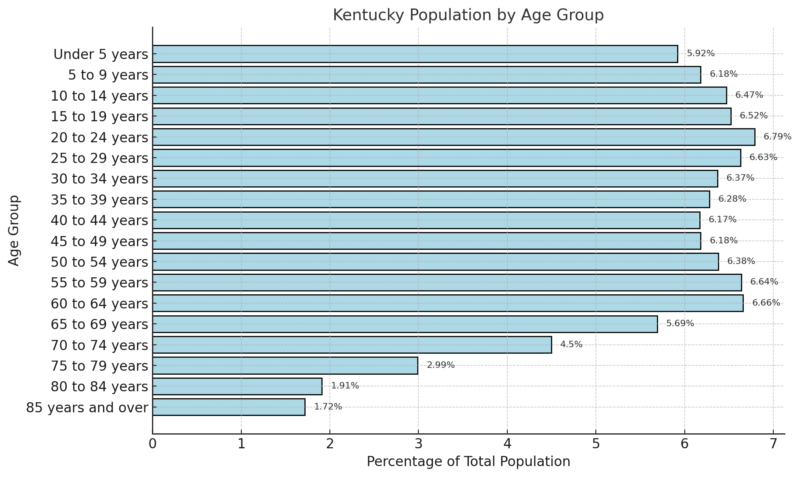
According to the 2018-2022 ACS 5-Year Estimates, Kentucky’s median age is 39.1 years. The population distribution shows that 18.57% are under 15 years old, 19.94% fall within the 15 to 29 age range, 44.68% are between 30 and 64 years, 15.09% are aged 65 to 84, and 1.72% are 85 years or older.
Population by Gender
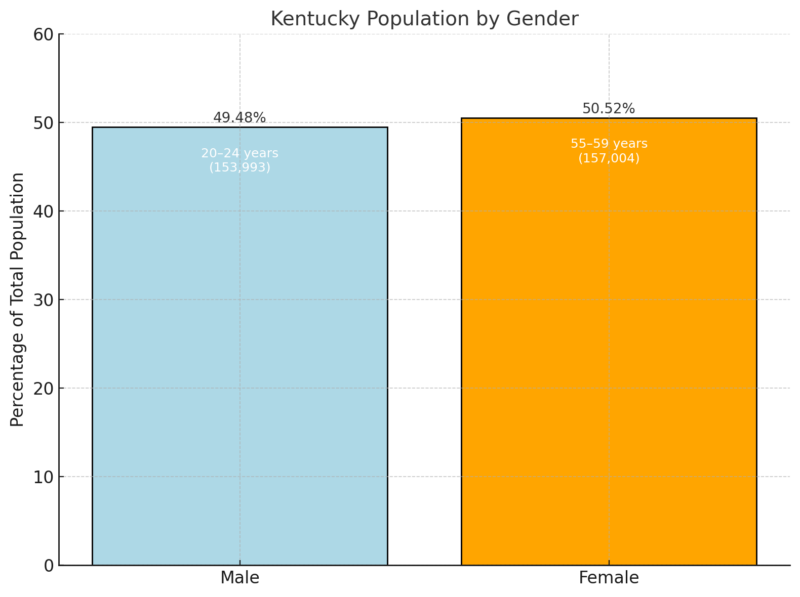
Kentucky has a slightly higher proportion of females (50.52%) compared to males (49.48%), resulting in a gender ratio of 97.9 men per 100 women as per Neilsberg Research.
The largest male age group is 20–24 years, while for females, it is 55–59 years.
This gender distribution highlights a balanced population with slight female dominance, especially in older age groups.
Population by Race/Ethnicity
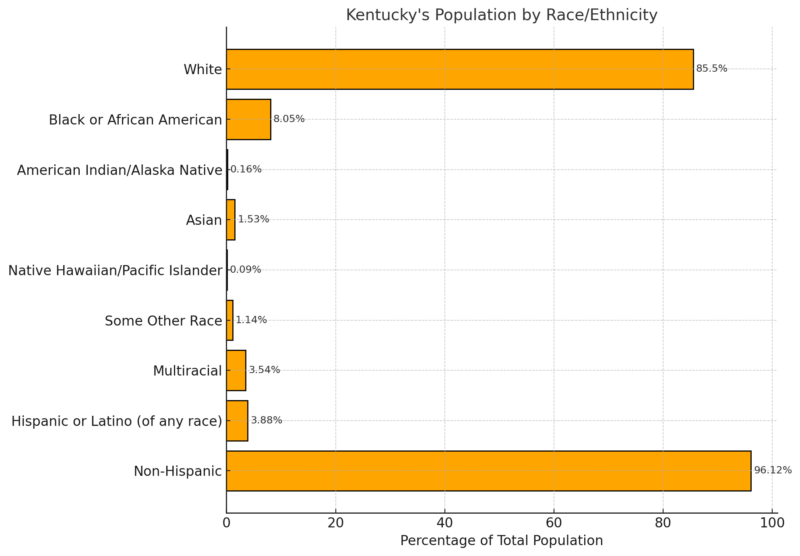
Kentucky’s population is predominantly White, making up 85.5% of residents, followed by Black or African American individuals at 8.05%.
Other racial groups, including Asian (1.53%) and multiracial (3.54%), contribute to the state’s increasing diversity.
Hispanic or Latino residents account for 3.88%, showcasing a smaller yet growing ethnic community.
This racial breakdown underscores Kentucky’s primarily White population but hints at gradual diversification.
Kentucky Counites 2025
County
Population
County
Population
County
Population
County
Population
Jefferson County
771,193
Fayette County
320,027
Kenton County
172,362
Warren County
144,412
Boone County
141,947
Hardin County
112,803
Daviess County
103,727
Madison County
98,319
Campbell County
94,132
Bullitt County
85,952
Christian County
71,778
Oldham County
70,922
McCracken County
67,490
Pulaski County
66,615
Laurel County
63,713
Scott County
61,259
Jessamine County
55,798
Pike County
55,629
Franklin County
51,740
Shelby County
50,188
Nelson County
48,101
Boyd County
47,593
Barren County
45,144
Hopkins County
44,932
Henderson County
44,206
Calloway County
38,467
Clark County
37,616
Whitley County
36,742
Graves County
36,429
Greenup County
35,067
Floyd County
33,928
Marshall County
31,698
Boyle County
31,125
Muhlenberg County
30,440
Meade County
30,252
Knox County
29,815
Logan County
28,710
Montgomery County
28,697
Woodford County
27,483
Grayson County
27,007
Perry County
26,899
Taylor County
26,490
Carter County
26,389
Grant County
25,764
Lincoln County
25,133
Harlan County
24,996
Anderson County
24,953
Rowan County
24,446
Ohio County
23,756
Mercer County
23,294
Bell County
23,023
Allen County
22,293
Johnson County
21,997
Breckinridge County
21,287
Spencer County
20,850
Simpson County
20,442
Bourbon County
20,159
Letcher County
20,019
Marion County
19,920
Hart County
19,854
Harrison County
19,725
Wayne County
19,526
Adair County
19,431
Clay County
19,422
Russell County
18,373
Garrard County
18,092
McCreary County
17,317
Mason County
16,779
Henry County
16,186
Rockcastle County
16,155
Casey County
15,925
Lawrence County
15,903
Fleming County
15,606
Larue County
15,456
Pendleton County
14,917
Morgan County
14,420
Trigg County
14,390
Estill County
13,848
Knott County
13,471
Jackson County
13,219
Bath County
13,122
Union County
13,108
Lewis County
13,009
Powell County
12,903
Webster County
12,713
Edmonson County
12,594
Todd County
12,594
Breathitt County
12,548
Caldwell County
12,494
Washington County
12,474
Butler County
12,385
Green County
11,544
Owen County
11,332
Monroe County
11,259
Magoffin County
11,108
Carroll County
11,035
Martin County
10,760
Metcalfe County
10,556
Leslie County
9,679
Lyon County
9,275
Clinton County
9,157
McLean County
9,001
Crittenden County
8,957
Livingston County
8,816
Hancock County
8,813
Gallatin County
8,811
Trimble County
8,687
Bracken County
8,417
Nicholas County
7,586
Ballard County
7,522
Lee County
7,313
Elliott County
7,198
Menifee County
6,336
Fulton County
6,305
Wolfe County
6,148
Cumberland County
6,031
Carlisle County
4,689
Hickman County
4,460
Owsley County
4,044
Robertson County
2,379
WPR notes that Jefferson County is Kentucky’s largest, with 770,517 residents (3.84% growth since 2010), followed by Fayette County (323,780), Kenton County (166,051), Boone County (131,533), Warren County (131,264), Hardin County (110,356), and Daviess County (101,104). Warren County had the fastest growth at 14.82%.
Robertson County is the smallest, with 2,315 residents (-6.15% growth). Other small counties include Hickman (4,421), Owsley (4,472), and Carlisle (4,771), all experiencing population declines, with Hickman County seeing the largest decrease (-9.01%).
Scott County leads with an 18.51% increase, followed by Warren (14.82%), Shelby (14.79%), and Jessamine (10.75%).
Martin County experienced the steepest drop, losing 12.31% of its residents.
Educational Attainment
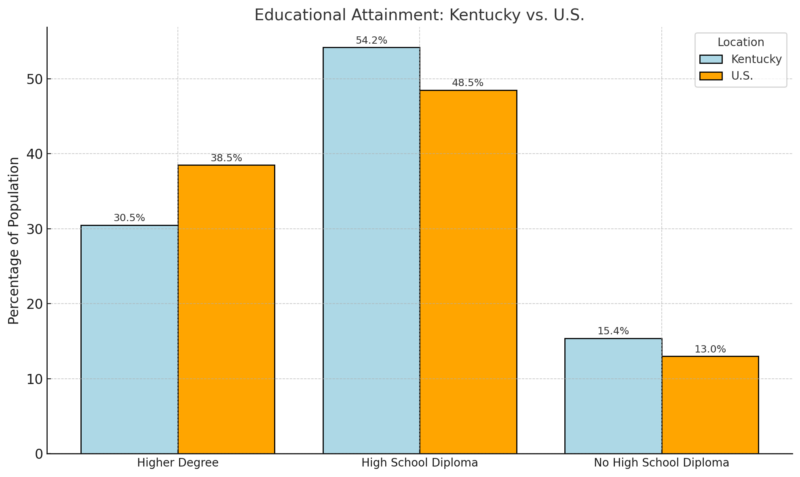
- Kentucky has a lower percentage of residents with a higher degree (30.5%) compared to the U.S. average of 38.5%.
- The majority (54.2%) of Kentuckians have a high school diploma as their highest educational attainment, above the national average (48.5%).
- A larger share of Kentuckians (15.4%) lack a high school diploma compared to the national average (13.0%).
The Kentucky Department of Education today announced that 31 Kentucky high schools have received the prestigious College Success Award from https://t.co/bRG98Mz8Tb, the nation’s leading nonprofit school information site.
Read more: https://t.co/y7uXIXWgS3 pic.twitter.com/oIZZLXBLe3
— KY Dept of Education (@KyDeptofEd) November 21, 2024
Employment and Unemployment Rates
Month
Civilian Labor Force (in thousands)
Employment (in thousands)
Unemployment (in thousands)
Unemployment Rate (%)
May 2024
2,040.7
1,946.1
94.6
4.6
June 2024
2,047.7
1,953.0
94.8
4.6
July 2024
2,054.2
1,957.7
96.4
4.7
Aug 2024
2,061.6
1,962.5
99.2
4.8
Sept 2024
2,069.0
1,967.4
101.6
4.9
Oct 2024
2,075.1
1,972.1
103.0
5.0
The civilian labor force increased steadily, from 2,040.7K in May 2024 to 2,075.1K in October 2024 as per BLS.
Employment also rose gradually, from 1,946.1K in May 2024 to 1,972.1K in October 2024.
Despite employment growth, unemployment numbers climbed from 94.6K in May 2024 to 103.0K in October 2024, leading to a rise in the unemployment rate from 4.6% in May to 5.0% in October.
Labor Market
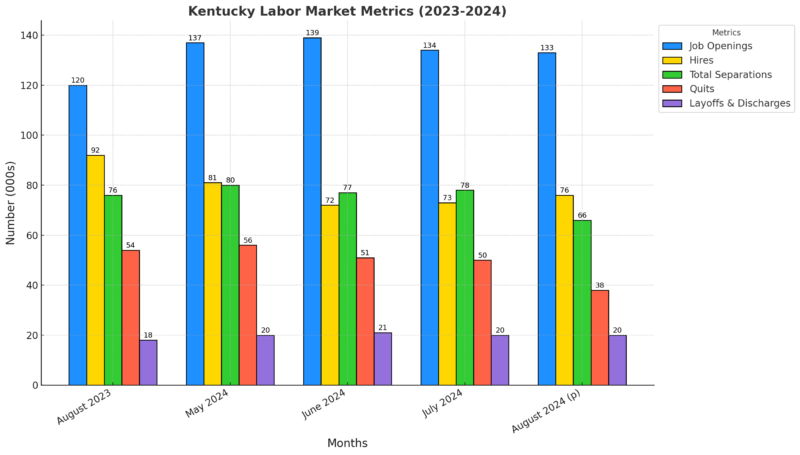
In August 2024, Kentucky experienced a minor decline in job openings, from 134,000 in July to 133,000, reflecting a 0.1% decrease in the job openings rate.
However, hiring activity increased by 3,000, indicating an uptick in employer recruitment efforts.
Total separations dropped significantly by 12,000, led primarily by a decrease in quits, signaling potentially fewer workers leaving jobs voluntarily. Layoffs and discharges remained constant at 20,000 during the same period.
Kentucky Job Openings and Turnover Rates (Seasonally Adjusted)
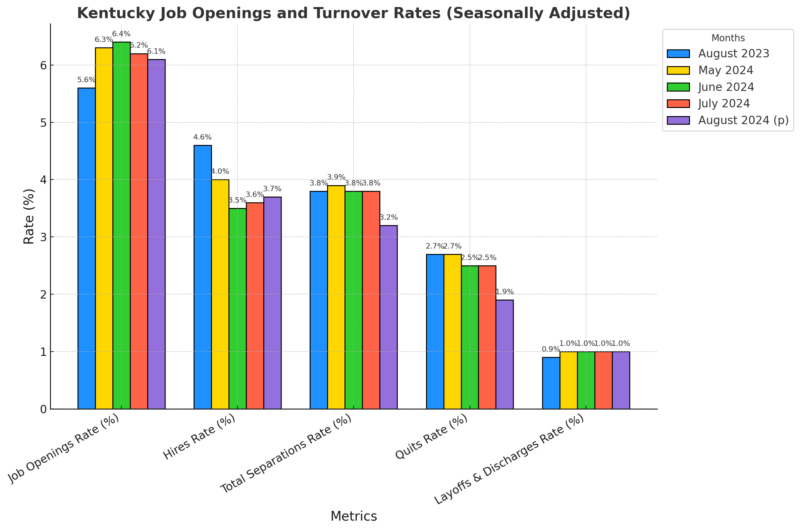
The job openings rate in Kentucky showed a slight decline in August, dropping from 6.2% in July to 6.1% as noted by the Bureau.
Despite this, the hiring rate rose modestly to 3.7%, indicating improved recruitment efforts by employers.
The overall separations rate saw a sharp decline to 3.2%, largely driven by a decrease in the quits rate, which fell to 1.9%.
Layoffs and discharges remained stable at 1.0%, suggesting that involuntary terminations were not a significant factor in labor market changes.
Health and Wellness Statistics
Indicator
Value
Fertility Rate
63.5 (births per 1,000 women aged 15-44)
Teen Birth Rate
27.3 (births per 1,000 females aged 15-19)
Infant Mortality Rate
5.8 (infant deaths per 1,000 live births)
Marriage Rate
6.8 (marriages per 1,000)
Divorce Rate
3.5 (divorces per 1,000)
Leading Cause of Death
Heart Disease
Drug Overdose Death Rate
30.9 (per 100,000)
Firearm Death Rate
16.9 (per 100,000)
Homicide Rate
6.1 (per 100,000)
Key health indicators in Kentucky reveal specific areas of concern.
The state has a fertility rate of 63.5 births per 1,000 women aged 15-44 and a teen birth rate of 27.3 per 1,000 females aged 15-19, reflecting notable birth trends according to the CDC.
Infant mortality stands at 5.8 per 1,000 live births, aligning closely with the national average.
However, Kentucky faces higher rates of drug overdose deaths (30.9 per 100,000) and firearm-related deaths (16.9 per 100,000), indicating pressing public health challenges.
Heart disease remains the leading cause of death, underscoring the need for focused health initiatives.
Birth Data
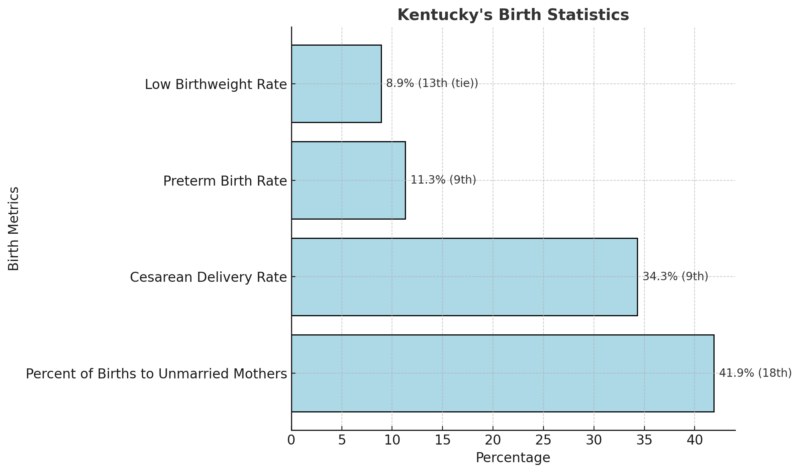
Kentucky’s birth statistics highlight challenges and trends in maternal and neonatal health.
The state ranks 18th nationally for the percentage of births to unmarried mothers, with 41.9% of births occurring outside of marriage.
The cesarean delivery rate of 34.3% places Kentucky 9th nationally, reflecting a high reliance on surgical deliveries.
Additionally, preterm births (11.3%) and low birthweight rates (8.9%) place Kentucky among the top 15 states for these indicators, suggesting the need for enhanced prenatal care and maternal health programs.
View this post on Instagram
Migration Patterns
Metric
Value
Immigrant Share of Population
4.0%
Number of Immigrant Residents
179,800
Immigrant Spending Power
$4.6 billion
Taxes Paid by Immigrants
$1.6 billion
Share of U.S.-Born Residents with Immigrant Parents
1.8%
Immigrants constitute 4% of Kentucky’s population and make significant economic contributions, including $4.6 billion in spending power and $1.6 billion in taxes.
Their involvement in the labor force, representing 5.4% of workers and 9.6% of STEM professionals, underlines their integral role in key sectors according to the American Immigration Council.
Furthermore, 7.3% of Kentucky’s entrepreneurs are immigrants, driving innovation and job creation.
Immigrant families contribute to the state’s demographics, with 1.8% of U.S.-born residents living with at least one immigrant parent.
Immigrant Age Distribution Compared to U.S.-Born Residents
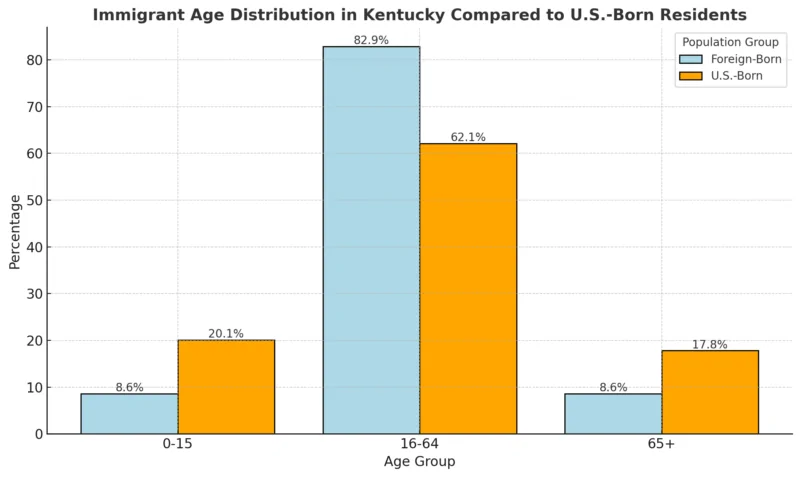
Immigrants in Kentucky are predominantly working-age (82.9%), a significantly higher proportion compared to U.S.-born residents (62.1%). This age distribution highlights immigrants’ critical role in the state’s labor force, contributing as taxpayers and economic participants.
The lower percentage of immigrant children (8.6%) and seniors (8.6%) suggests that immigrants are less dependent on public services like education and healthcare than their U.S.-born counterparts.
Immigrant Demographics and Language Proficiency
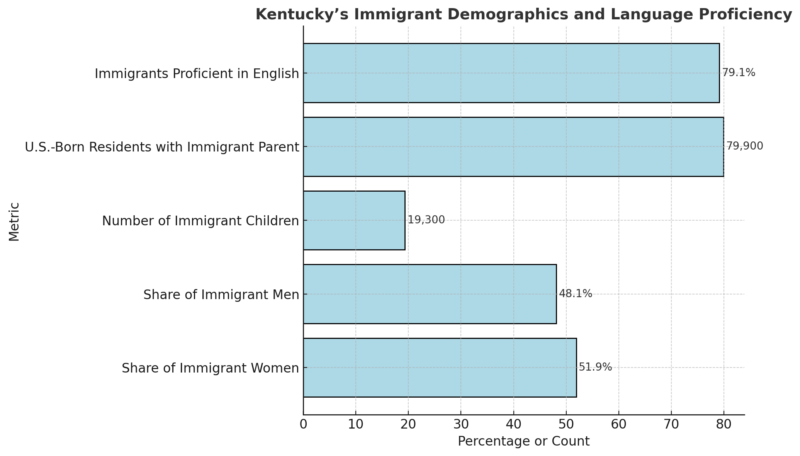
Kentucky’s immigrant community is balanced in gender, with slightly more women (51.9%).
A substantial majority (79.1%) of immigrants report proficiency in English, easing their integration into society and the workforce.
The presence of 79,900 U.S.-born residents with immigrant parents highlights the long-term contributions of immigrant families to the state’s demographic and cultural landscape.
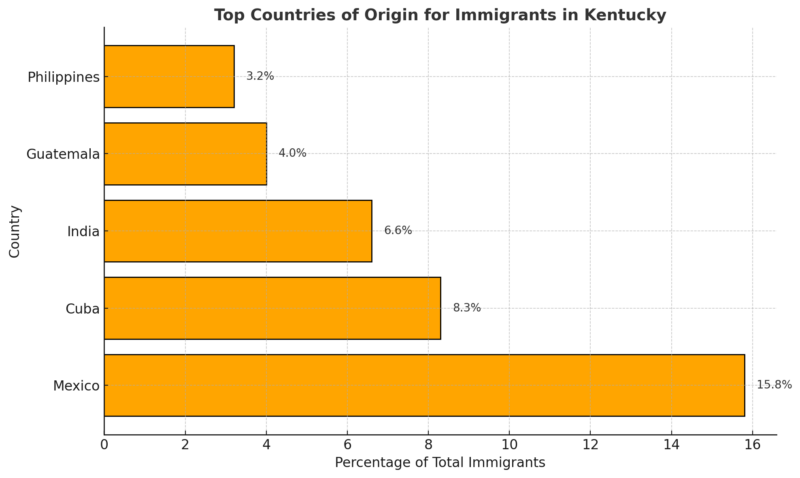
Top Countries of Origin for Immigrants in Kentucky
Housing Market Overview
Metric
Value
Year-over-Year Change
Median Sale Price
$265,800
+7.1%
Number of Homes Sold
3,921
+6.2%
Median Days on Market
41 days
+7 days
Redfin notes that the Kentucky housing market demonstrated strong growth in October 2024, with a 7.1% year-over-year increase in the median home sale price, reaching $265,800.
Additionally, home sales increased by 6.2%, reflecting robust demand in the state.
However, homes lingered on the market longer, with a median of 41 days, up by 7 days compared to the previous year.
This trend may indicate that while prices are rising, the pace of sales is slightly slowing.
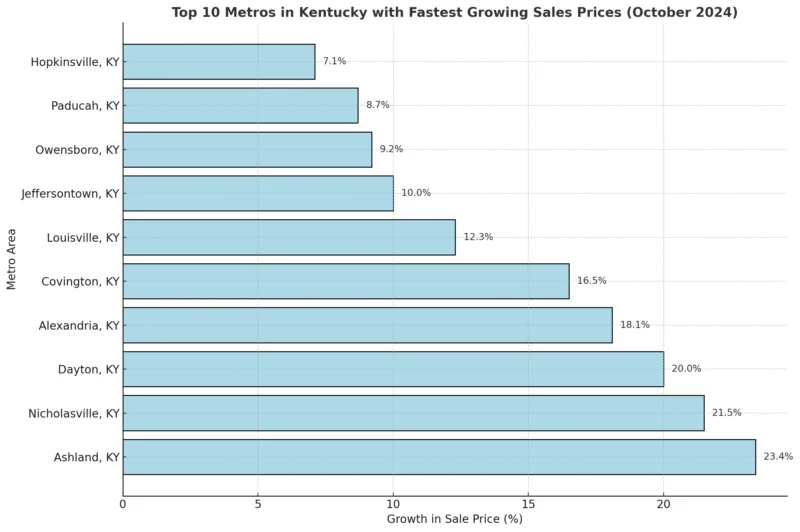
Top 10 Metros in Kentucky with Fastest Growing Sales Prices (October 2024)
Kentucky Annual Crimes Overview
Crime Type
Number of Crimes
Rate per 1,000 Residents
National Rate per 1,000 Residents
Violent Crimes
9,663
2.14
4.80
Property Crimes
65,375
14.49
19.55
Total Crimes
75,038
16.63
–
Kentucky’s total crime rate is 16.63 per 1,000 residents, lower than the national average. Violent crimes, at 2.14 per 1,000 residents, also fall significantly below the national rate.
Property crimes are more prevalent, with theft accounting for the majority of cases at a rate of 9.90 per 1,000 residents as per Neighborhood Scout.
Kentucky’s overall lower crime rate suggests a relatively safer environment compared to the U.S. as a whole.
Violent Crime Breakdown (per 1,000 Residents)
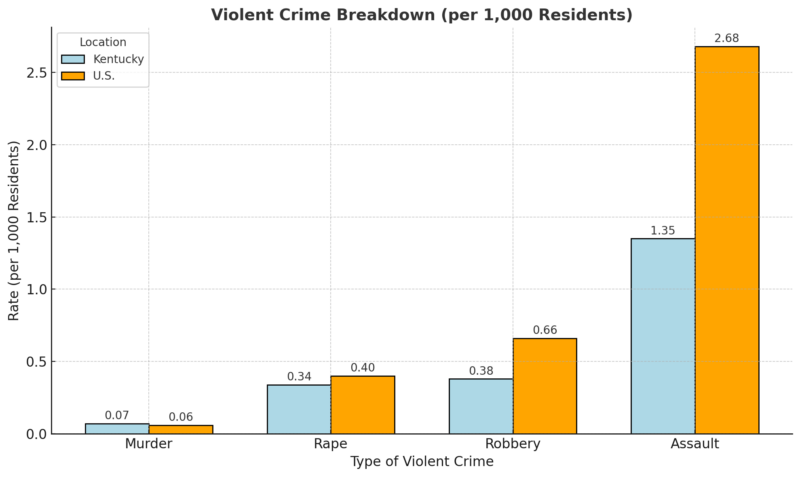
Murder rates in Kentucky are slightly higher than the national average, while other violent crimes like robbery and assault are considerably lower.
Assault remains the most common violent crime in Kentucky, reflecting broader trends nationwide.
Property Crime Breakdown (per 1,000 Residents)
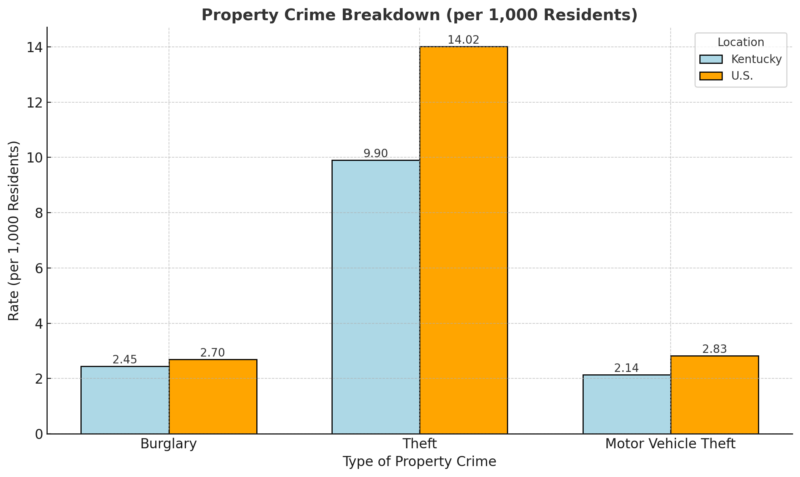
Property crime rates in Kentucky are below the national averages across all categories.
Theft is the most frequent type of property crime, though Kentucky’s rate is significantly lower than the U.S. average, indicating relatively fewer incidents of major property-related offenses.
Crime Rate Comparison: Kentucky vs. National Average
Metric
Kentucky
U.S.
Chances of Violent Crime
1 in 467
1 in 208
Chances of Property Crime
1 in 69
1 in 51
Residents in Kentucky have a lower likelihood of becoming victims of violent or property crimes compared to the national average.
For violent crime, the odds are 1 in 467 in Kentucky versus 1 in 208 nationwide.
Similarly, the chances of property crime victimization are 1 in 69 in Kentucky, significantly lower than the U.S. average of 1 in 51.
Methodology
We compiled data from trusted sources like the U.S. Census, BLS, and Redfin, analyzing population, housing, and crime metrics. Economic, educational, and health indicators were reviewed alongside migration trends and labor market statistics.
Comparative analyses with national averages highlighted Kentucky’s unique trends. The data was structured into concise categories for clarity and ease of understanding.
Interactive charts, tables, and official statistics were used to visualize the findings. The article aims to provide accurate, well-sourced insights into Kentucky’s demographics, economy, and community well-being.
References
- World Population Review – Kentucky Population 2024
- Neilsberg Research – Kentucky Population by Age
- American Immigration Council – Immigrants in Kentucky
- Bureau of Labor Statistics – Kentucky Employment Statistics
- Redfin – Kentucky Housing Market
- CDC – Kentucky Health Statistics
- Neighborhood Scout – Crime in Kentucky