Buying a home in 2016 and buying one in 2026 are two very different financial decisions.
National house prices have risen by about 93% over the last 10 years, based on the latest Federal Housing Finance Agency data available in August 2026. Put another way, a home that followed the national index and was worth $300,000 a decade ago would be worth roughly $580,000 today.
The increase did not happen at a steady pace. Prices rose at a fairly normal rate through the second half of the 2010s, accelerated sharply during the pandemic housing boom, and then slowed once mortgage rates moved back above 6%.
The latest numbers show both sides of the story. Homes remain dramatically more expensive than they were in 2016, but the market is no longer producing the double-digit annual increases seen in 2021 and 2022.
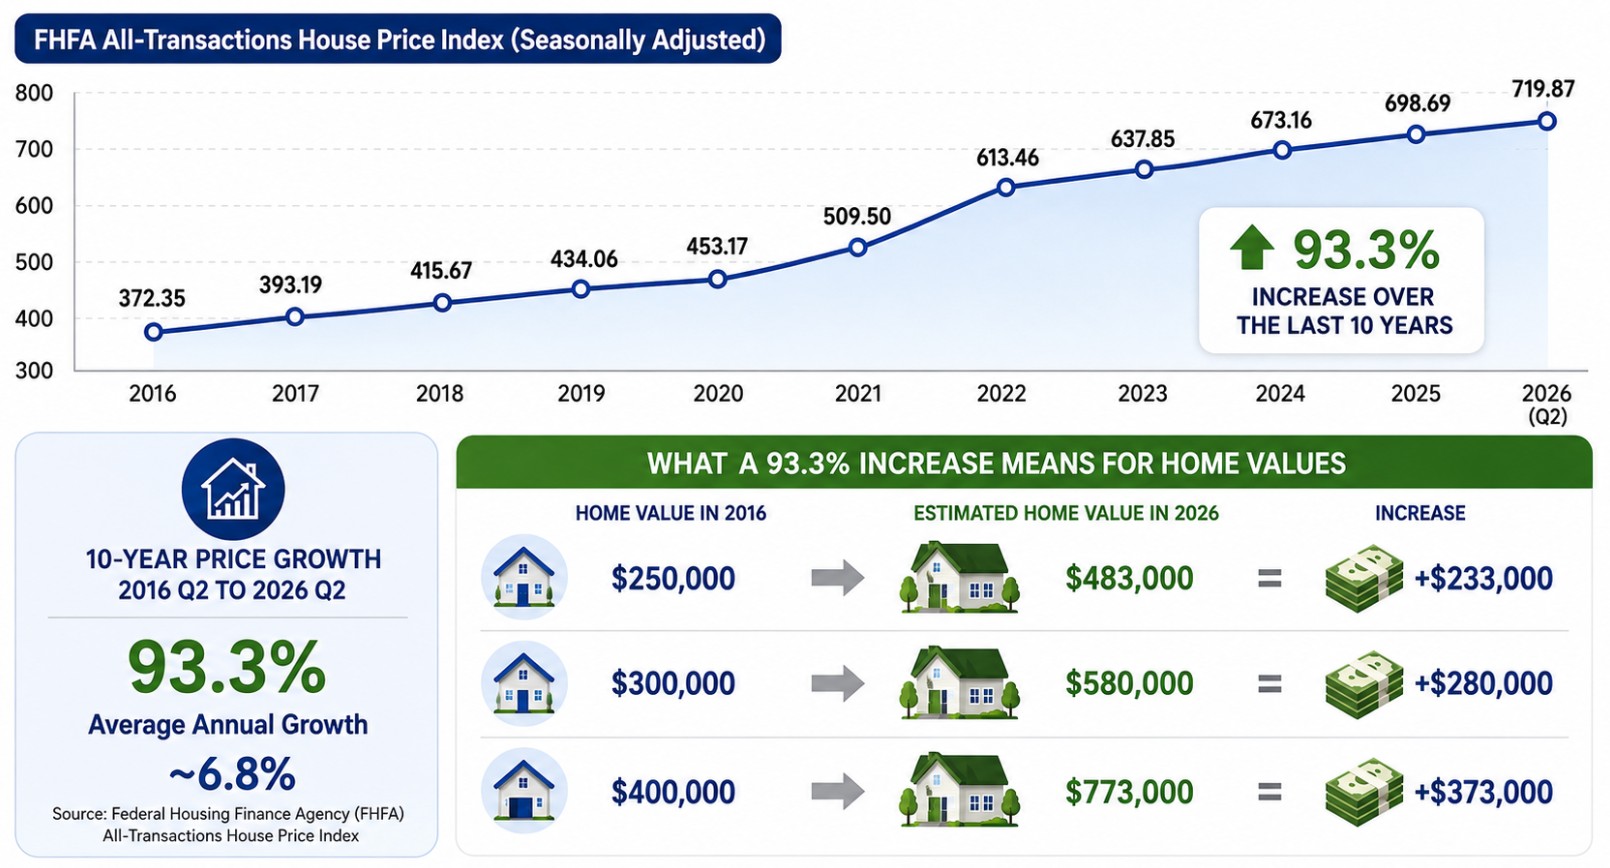
According to the FHFA All-Transactions House Price Index, the national index stood at 372.35 in the second quarter of 2016. By the second quarter of 2026, it had climbed to 719.87.
U.S. Home Prices Have Risen About 93% Since 2016
The easiest way to compare home prices over a long period is to use a house price index rather than a single median sale price.
The FHFA House Price Index follows changes in single-family home values across the country using mortgage, appraisal and sales data.
Its all-transactions index rose from:
- 372.35 in Q2 2016
- 719.87 in Q2 2026
The difference is 93.3%.
Spread across the full decade, that works out to average compounded price growth of about 6.8% per year.
That annual figure is useful, but it should not be read as though homes gained 6.8% every year. Some years were much quieter. Others produced unusually large increases.
| Comparison | 2016 Value | 2026 Value | Increase |
|---|---|---|---|
| FHFA All-Transactions Index, Q2 | 372.35 | 719.87 | 93.3% |
| Home tracking national index | $250,000 | About $483,000 | About $233,000 |
| Home tracking national index | $300,000 | About $580,000 | About $280,000 |
| Home tracking national index | $400,000 | About $773,000 | About $373,000 |
Those examples are illustrations based on the national index. An individual property can perform very differently depending on its location, condition, neighborhood and local housing supply.
Median Existing-Home Prices Tell a Similar Story
A second way to look at the last decade is to compare the prices of homes actually sold.
National Association of Realtors data show that the annual median price of an existing home was $233,800 in 2016.
By July 2026, the median existing-home price had reached $434,100.
That is about 86% higher than the 2016 annual median.
The percentage is a little lower than the 93% FHFA increase because the two measurements answer different questions.
FHFA tracks changes in the value of comparable homes over time. A national median sale price depends on which homes happened to sell during a particular period. If a larger share of expensive homes sells in one month, the median rises even if every individual property did not increase by the same amount.
For a long-term price trend, the FHFA index is therefore the cleaner comparison. The NAR median is useful because it shows what buyers are actually paying in the current market.
Home Price Growth by Year Since 2016
The ten-year increase becomes easier to understand when the period is broken down year by year.
Using the second-quarter FHFA all-transactions index for each year gives the following picture.
| Year | FHFA Index in Q2 | Change From Previous Year |
|---|---|---|
| 2016 | 372.35 | Starting point |
| 2017 | 393.19 | 5.6% |
| 2018 | 415.67 | 5.7% |
| 2019 | 434.06 | 4.4% |
| 2020 | 453.17 | 4.4% |
| 2021 | 509.50 | 12.4% |
| 2022 | 613.46 | 20.4% |
| 2023 | 637.85 | 4.0% |
| 2024 | 673.16 | 5.5% |
| 2025 | 698.69 | 3.8% |
| 2026 | 719.87 | 3.0% |
The table makes the pandemic boom impossible to miss.
Price growth was generally between 4% and 6% during the years before the pandemic. The market then changed sharply in 2021 and 2022.
By 2023, the pace had already dropped back into single digits.
Most of the Extraordinary Growth Came in 2021 and 2022
The biggest change of the decade happened when mortgage rates collapsed and buyers suddenly had much more purchasing power.
The average 30-year fixed mortgage rate fell below 3% during parts of the pandemic period. For a buyer financing hundreds of thousands of dollars, that made an enormous difference to the monthly payment.
Demand also changed.
Remote work gave some households more freedom to move. Families looking for additional space competed for suburban homes. Existing owners were reluctant to sell. New construction was unable to fill the gap quickly enough.
The result was a market with too many buyers chasing too few homes.
The FHFA index increased more than 12% between the second quarters of 2020 and 2021, then another 20% over the following year.
Zillow calculated that home values rose 45.3% between February 2020 and February 2025.
Many homeowners therefore accumulated equity in a few years that would normally have taken much longer to build.
The COVID-19 pandemic affected nearly every part of the economy, but housing ended up being one of the clearest examples of how differently prices behaved during that period.
The Market in 2026 Is Much Slower
Anyone looking only at the 10-year increase could easily assume that prices are still climbing rapidly.
They are not.
FHFA reported on August 25 that its seasonally adjusted purchase-only index increased just 2.1% between Q2 2025 and Q2 2026.
Prices rose only 0.3% from the first quarter to the second quarter, and the monthly national index was unchanged between May and June.
The country has recorded positive annual appreciation in every quarter since 2012, but current growth is nowhere near the pace of the pandemic boom.
Zillow gives a similar reading.
The typical U.S. home value was $371,774 at the end of July 2026, just 1% higher than a year earlier.
Zillow also reported:
- Median sale price of $381,333 in June 2026
- Median list price of $414,667 in July
- Nearly 1.39 million homes listed for sale
- 50.5% of sales closing below the listing price
- 29.8% selling above the listing price
- Median time to pending of 21 days
Those numbers look very different from the market of 2021, when bidding wars and rapid price increases were common in many cities.
Existing Homes Still Cost More Than $430,000 at the Median
The slowdown has not made homes inexpensive.
National Association of Realtors data for July 2026 put the median existing-home price at $434,100, up 2% from $425,700 a year earlier.
Single-family homes had a median price of $440,300.
Condos and co-ops were lower at $371,800.
Only 4.06 million existing homes were selling at a seasonally adjusted annual rate in July. That was 1.7% lower than June and only 0.7% above July 2025.
Inventory stood at 1.54 million homes, enough for 4.6 months at the current sales rate.
For comparison, NAR data show about 5.45 million existing homes were sold during 2016.
Prices are dramatically higher today even though fewer homes are changing hands.
A Typical Buyer Faces a Much Larger Monthly Payment Than in 2016
The sale price is only one part of the difference between the two housing markets.
Mortgage rates matter just as much.
NAR puts the average mortgage rate during 2016 at roughly 3.7%. In July 2026, the average 30-year fixed rate was 6.54%.
The combination of an 80% to 90% increase in home prices and a mortgage rate almost three percentage points higher has transformed affordability.
Our recent analysis found that a household now needs about $109,796 a year to comfortably afford a typical U.S. home.
The estimated typical household earns $87,599, leaving a gap of more than $22,000.
That explains why a slower rate of home price growth has brought only limited relief.
A buyer does not necessarily benefit much when the price of a home stays flat if the mortgage payment remains elevated because of interest rates.
Mortgage rates briefly fell to 6.06% in January 2026, the lowest level since 2022, as we reported in our look at falling mortgage rates. They later climbed again.
Home Prices Are Now Rising More Slowly Than Inflation
View this post on Instagram
The latest Case-Shiller numbers add another important piece to the story.
The S&P Cotality Case-Shiller U.S. National Home Price Index increased 1.5% in the 12 months ending in June 2026.
Consumer inflation was 3.5% over the same period.
That means national home values were still rising in dollar terms, but falling after inflation.
June marked the thirteenth consecutive month in which home prices lost ground in real terms.
That is almost the opposite of what happened earlier in the decade.
During the pandemic boom, home prices rose much faster than general consumer prices. In 2026, inflation is running faster than home price appreciation.
The Last 10 Years Were Very Different Depending on Where You Live
A 93% national increase does not mean every state doubled in value.
Housing is local.
Migration, employment, construction, taxes, insurance, land availability and local building rules all affect what happens in an individual market.
For several years, Sun Belt states drew much of the attention.
Florida, Arizona and other fast-growing states attracted large numbers of new residents during and after the pandemic. Prices responded quickly.
Parts of those markets are now among the areas where growth has cooled the most.
FHFA reported that the Pacific division recorded almost no annual growth in Q2 2026, while the Mountain division was up less than 1%.
The Midwest and Northeast are currently performing better.
Among the states, the largest annual increases through Q2 2026 were:
| State | 1-Year Increase | 5-Year Increase |
|---|---|---|
| Alaska | 8.3% | 37.3% |
| Vermont | 7.3% | 52.2% |
| Hawaii | 5.8% | 38.0% |
| Illinois | 5.6% | 44.0% |
| West Virginia | 5.6% | 39.7% |
| Wisconsin | 4.8% | 46.0% |
| Connecticut | 4.7% | 49.6% |
| New Jersey | 4.6% | 50.5% |
| Ohio | 4.4% | 41.9% |
New Mexico recorded the largest statewide decline, with prices down 1.2% from a year earlier.
The difference between regions is also clear in NAR sale prices.
In July 2026, the median existing-home price was $622,200 in the West, compared with $342,900 in the Midwest.
A national median therefore says very little about what an individual family will encounter in a particular city.
Some Cities Are Still Rising Quickly
Even within states, price movement varies widely.
FHFA metropolitan data for Q2 2026 show several places recording annual gains well above the national rate.
Urban Honolulu was up 11.1%. Grand Junction, Colorado, rose 8.8%. Bloomington, Illinois, increased 8.7%, while Kenosha, Wisconsin, gained 8.4%.
Rockford, Illinois, recorded a five-year increase of more than 63%.
Syracuse, New York, was up more than 64% over five years.
The current leaders are not necessarily the same cities that dominated housing headlines in 2021 and 2022.
That shift is one reason national housing coverage can be misleading. A buyer in Chicago can be dealing with rising prices at the same time a buyer in Dallas sees home values falling.
Zillow reported Chicago home values up 4.8% from a year earlier in July. Dallas was down 2.2%, Houston was down 1.9%, Atlanta was down 1.5% and Miami was down slightly.
2016 Had Cheaper Homes and Much Lower Mortgage Rates
The housing market of 2016 was not cheap for everyone, but the numbers look very different from today.
The median existing-home price was $233,800.
Mortgage rates averaged about 3.7%.
About 5.45 million existing homes sold during the year.
There were around 1.65 million homes available for sale at the end of 2016.
NAR calculated a housing affordability index of 166.2 for that year. An index value of 100 means a household earning the median income has exactly enough income to qualify for a mortgage on the median-priced home under the methodology.
By the end of 2025, the index was only 108.2.
It improved to 103.3 in July 2026 compared with 98.3 a year earlier, but buyers still have far less breathing room than they did a decade ago.
Why Did Home Prices Rise So Much?
There is no single explanation for a 93% national increase.
Several changes happened at the same time.
There Were Not Enough Homes in Many Markets
The country entered the pandemic with years of underbuilding behind it.
When demand suddenly increased, builders could not produce homes quickly enough.
Housing supply remains a national political issue in 2026. The Senate recently passed a large housing package aimed at local building restrictions, investor purchases and affordable housing supply, which we covered in our report on the 21st Century ROAD to Housing Act.
Mortgage Rates Fell Below 3%
Extremely low interest rates allowed buyers to borrow more money without increasing their monthly payment by the same amount.
More borrowing capacity gave sellers room to ask for higher prices.
When several buyers wanted the same property, bidding pushed prices higher again.
Remote Work Changed Where People Could Live
Millions of workers no longer needed to live within commuting distance of an office every day.
Some left expensive cities for suburbs or lower-cost states.
That created unusually rapid demand in places that had previously experienced slower population growth.
Existing Owners Became Reluctant to Sell
Millions of homeowners refinanced or bought homes with mortgage rates near 3%.
When rates later moved above 6%, selling meant giving up an unusually cheap loan and replacing it with a much more expensive one.
That lock-in effect kept homes off the market and limited supply.
Construction Became More Expensive
Builders also faced higher costs for labor, land, financing and construction materials.
Lumber received much of the attention during the pandemic, but concrete, stone, steel, transportation and site preparation all contribute to the final cost of a home.
Christopher DeFeo, owner of DeFeo Materials, previously explained the connection between basic materials and finished home prices.
“When the cost of base materials like crushed stone or sand rises, it affects everything built on top of them, from foundations and driveways to retaining walls and roadbeds. Those higher input costs eventually make their way into the housing market itself.”
Higher Home Values Created a Huge Wealth Gain for Existing Owners
The last decade has been extremely good for homeowners who already owned property.
Someone who bought before the pandemic benefited from both rising home values and, in many cases, very low mortgage rates.
That created a large divide between existing owners and households still trying to buy their first home.
A family that bought a $300,000 property in 2016 and experienced national-average appreciation could now be sitting on a property worth around $580,000.
That increase does not mean the homeowner has $280,000 sitting in a bank account. Equity becomes available through a sale, refinancing, home equity loan or similar transaction.
Still, it represents a substantial addition to household wealth.
New buyers face the opposite side of the same equation. They have to purchase at the higher 2026 price and finance the home at a much higher interest rate.
Housing Costs Are Affecting More Than Homebuyers
The decade-long increase reaches well outside the real estate market.
Higher home prices affect property taxes, insurance costs, down payments, rents and the amount of money households have left for other expenses.
In areas such as South Florida, housing has become one of the largest reasons living costs have climbed so far above the national average. Our analysis of the South Florida cost of living found that the Miami metropolitan area now ranks among the most expensive large areas in the country.
Rising housing costs also affect when younger adults leave home, get married, have children or move to another state.
That connection between housing and household finances becomes clearer when home values rise far faster than wages over a long period.
Are Home Prices Finally Falling?
Not nationally.
The latest FHFA, Case-Shiller, Zillow and NAR data all show national prices still slightly higher than a year ago.
What has changed is the speed.
FHFA says prices are up 2.1%.
Case-Shiller reports 1.5%.
Zillow reports roughly 1%.
NAR puts the July median existing-home price 2% above the same month last year.
Individual markets can still fall even when the national figure remains positive.
Dallas, Houston, Atlanta and several other large metropolitan areas have already recorded year-over-year declines in Zillow data.
A national downturn therefore does not need to occur for buyers in an individual city to see lower prices.
Could Homes Double Again Over the Next 10 Years?
A repeat of the last decade would require another gain close to 93%.
That would put a $400,000 home near $773,000 after 10 years.
No current data can tell us that will happen.
The previous decade included circumstances that were highly unusual, especially mortgage rates below 3% and the pandemic housing rush.
The present market starts from much higher prices and far worse affordability.
Zillow currently forecasts national home value growth of around 1.1% over the next year.
NAR has also been expecting much slower price gains than those recorded during the pandemic.
Long-term appreciation is entirely possible, but assuming another immediate doubling would require ignoring how different current conditions are.
Where Home Prices Stand in 2026?
Ten years of housing data leave us with a market that is expensive but no longer moving at pandemic speed.
National prices are roughly 93% above their Q2 2016 level on the FHFA all-transactions index.
The median existing home that sold in July cost $434,100.
The typical home value is about $372,000.
Mortgage rates remain above 6%.
Annual price growth has fallen to roughly 1% to 2% depending on the index.
Homeowners still have the benefit of a decade of enormous appreciation, but new buyers are entering a market where prices remain near record levels and cheap financing has disappeared.
The biggest gains of the last decade are already behind us. The next phase of the housing market is being shaped much more by affordability, mortgage rates and local supply than by nationwide bidding wars.
People researching an individual property should also look past national averages. Services such as Information.com can help buyers review available address and property information, including assessed values, tax records and previous sales data.
References
- Federal Housing Finance Agency, FHFA House Price Index datasets
- Federal Reserve Bank of St. Louis, All-Transactions House Price Index for the United States
- Federal Housing Finance Agency, House Price Index report archive
- Federal Housing Finance Agency, U.S. House Price Index release
- Zillow, Pandemic home value growth analysis
- Zillow, Home values during the pandemic period
- Zillow, United States home values and housing market data
- National Association of Realtors, Existing-Home Sales data
- S&P Dow Jones Indices, S&P Cotality Case-Shiller June 2026 results