
Every year, roughly 75,000 to 100,000 children in the United States are adopted, whether through the public foster-care system, private domestic arrangements, or in-country processes.
This figure has remained remarkably stable in recent years, even as the balance among adoption types has shifted.
At the same time, another family-building route, surrogacy, has quietly expanded, producing thousands of births through assisted reproductive technology (ART). Together, these statistics reveal not only how American families grow but also how policy, science, and culture have changed since the 1990s.
U.S. Adoption in Numbers – The Most Recent Totals (2022–2024)
Adoption type
Year
Children adopted
% of total adoptions
Trend since 2010
Foster-care (public)
FY2023
50,193
65%
▼ Down 24% since 2019
Private domestic (non-stepparent)
CY2022
25,503
33%
▲ Slightly up from 2010
Intercountry (international)
FY2024
1,172
1–2%
▼ Down 90% since the 2004 peak
The latest figures confirm a stable but changing picture. Public foster-care adoptions remain the backbone of the system, accounting for about two-thirds of all finalized cases.
Private domestic adoptions make up most of the rest, while intercountry placements, once a major pathway, have nearly vanished.
The decline in foster-care adoptions since 2019 reflects broader systemic changes: fewer children entering care, longer case durations after the pandemic, and growing emphasis on family reunification before adoption is considered.
Meanwhile, the modest rise in private adoptions shows the continuing demand among childless couples for newborn placements.
How Adoption Changed Over Time – Decade Overview
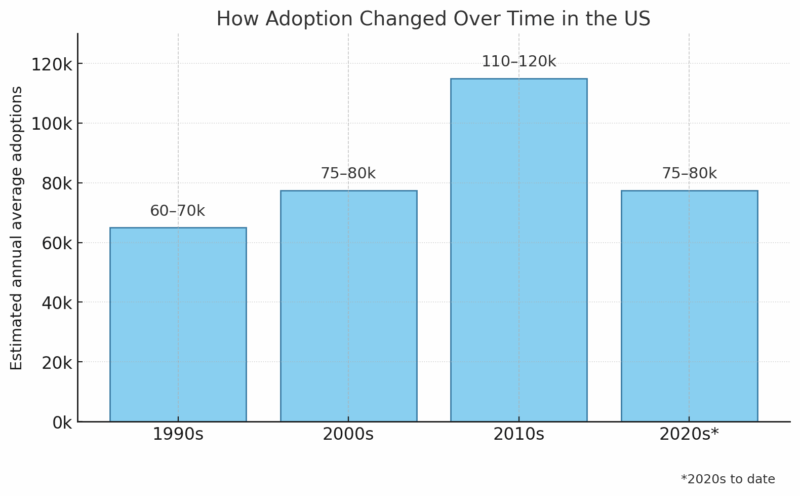
Over the last thirty years, the adoption landscape has expanded and contracted in phases. In the 1990s, the U.S. passed key laws designed to prevent children from spending years in foster care without a permanent home.
By the 2000s, those reforms produced measurable gains: thousands more adoptions from foster care and a surge in international placements from countries like China, Russia, and Guatemala.
However, the 2010s brought a reversal in global adoption policy. Sending countries began closing programs to foreign families, while the U.S. tightened its own oversight through the Hague Convention. At the same time, domestic adoptions became faster and more supported through subsidies.
By the 2020s, with the COVID-19 pandemic disrupting courts and agencies, overall adoption numbers dipped but stabilized near 80,000 per year, about where they stood before 2000, but for entirely different reasons.
Foster-Care Adoptions (Public System)
Foster-care adoption is the most publicly visible form of adoption because it involves children who were removed from unsafe homes and made legally free for adoption by the courts.
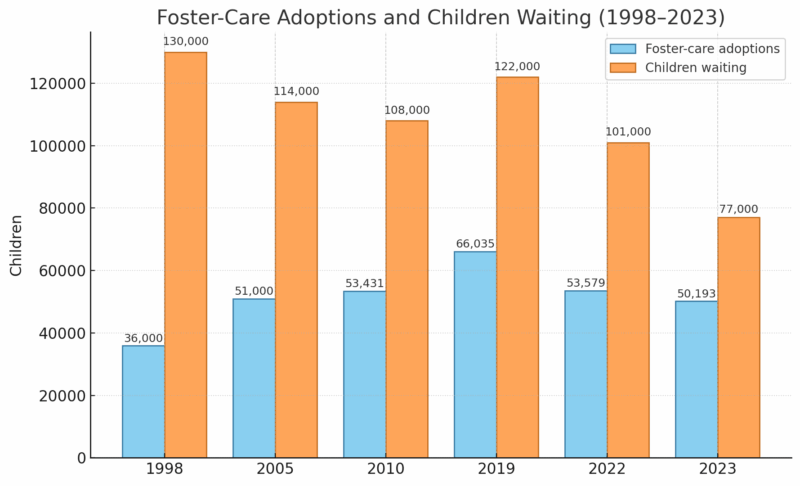
Between the late 1990s and 2019, annual foster-care adoptions rose by nearly 85%, thanks to federal performance bonuses for states and growing cultural support for adopting from care. But after 2019, the numbers began to slide.
The reasons are structural rather than social. Many states implemented family preservation programs that helped biological families stay together, reducing the inflow of children into care.
Others faced pandemic backlogs that slowed legal finalizations. The result: fewer adoptions, but also fewer children waiting, a sign that prevention and kinship care are working as intended.
Each year, national reports also track how many kids are waiting to be adopted—as of 2023, about 77,000 children in U.S. foster care were legally free or had adoption listed as their permanency goal.
Private Domestic Adoptions
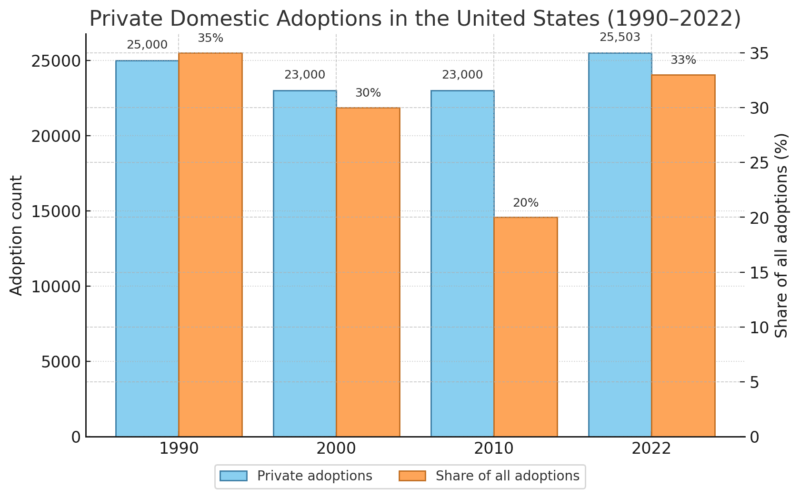
Private domestic adoption operates outside the public welfare system. It typically involves an expectant mother voluntarily placing her newborn with adoptive parents through an agency or attorney.
Unlike foster-care adoption, which primarily involves older children, private adoption overwhelmingly centers on infants; around 95% of placements involve babies under one year old.
The total number of private adoptions has remained surprisingly consistent for more than thirty years, averaging between 23,000 and 27,000 per year. The stability reflects both supply and demand limits: there are far fewer newborns available for adoption than families are seeking.
Still, these adoptions often receive national attention because they involve detailed legal arrangements, open-contact agreements, and lifelong counseling between birth and adoptive families.
For families wondering how much it costs to adopt a child in the United States, the answer varies widely: adopting from foster care can cost little or nothing, while private domestic adoptions typically range from $20,000 to $50,000, depending on agency fees, legal work, and birth parent expenses.
Intercountry Adoptions
Year
Intercountry adoptions to the U.S.
% change vs. 2004 peak (22,989)
Key factor
1999
15,719
,,
China, Russia, and South Korea lead.
2004
22,989
0% (peak)
Highest ever recorded.
2010
11,058
−52%
Hague Convention implemented.
2019
2,966
−87%
Countries close programs.
2023
1,274
−94%
Post-pandemic restrictions.
2024
1,172
−95%
Continued decline.
In the early 2000s, intercountry adoption symbolized global humanitarian outreach. Thousands of children from Asia, Eastern Europe, and Latin America find homes in the U.S. each year. But that era has largely ended.
After 2004, major sending countries either restructured or ended their international programs. Russia, for instance, banned adoptions to the U.S. entirely in 2013. China’s one-child policy and economic changes reduced the number of abandoned infants dramatically.
By 2024, the U.S. recorded just over 1,100 international adoptions, down from nearly 23,000 twenty years earlier. That represents a 95% reduction, marking one of the steepest declines in modern social history.
What remains are mostly cases involving older children, sibling groups, or children with medical needs, handled through heavily regulated international channels.
The Changing Face of Adoption
Age and Demographics
Category
Foster-care adoptions
Private domestic adoptions
Intercountry adoptions
Average child age
6 years
< 1 year
2–4 years
Sibling groups
Common (≈ 50%)
Rare
Sometimes
Special-needs share
40–45%
~5%
25–30%
Race/Ethnicity
Diverse; over-representation of Black & Hispanic youth
The majority of white infants
Diverse, often Asian
Behind the statistics lies a striking demographic reality. Foster-care adoptions are more racially diverse and often involve sibling sets or children with special needs.
Private adoptions, in contrast, tend to feature newborn infants, often in open arrangements where biological and adoptive families remain in contact.
In the global context, intercountry adoptions once brought children from over 90 nations to the U.S., but now primarily involve a handful of countries with specific medical or humanitarian cases.
These distinctions underline the fact that adoption is not one process, is several different systems operating under one word.
Time in Care Before Adoption
The average child adopted from U.S. foster care spends about 33 months in the system before the process is finalized. That number represents a significant improvement over the 1980s and 1990s, when children often waited five years or more.
The reduction reflects faster legal processing and better tracking systems, but the persistence of nearly three years in care still raises concerns about how quickly permanency can be achieved.
In some states, particularly large or rural ones, court backlogs and a shortage of caseworkers prolong that wait substantially.
Policy Shifts That Shaped Adoption
View this post on Instagram
The rhythm of adoption statistics follows the rhythm of legislation. The Adoption and Safe Families Act (ASFA) of 1997 fundamentally restructured U.S. child welfare by requiring states to seek adoption once a child had spent 15 of the last 22 months in foster care, unless strong reasons prevented it.
The Fostering Connections Act of 2008 expanded support for kinship caregivers, helping relatives formally adopt or take guardianship
In the 2010s and 2020s, however, policy emphasis shifted again, from speed to stability. Family preservation programs, subsidized guardianships, and trauma-informed care encouraged keeping children safely with relatives or returning them home.
These efforts reduced the number of children needing adoption but also created a statistical decline that, while seemingly negative, signals progress in prevention.
Surrogacy in the United States: Data and Dynamics
Period
Gestational-carrier (GC) cycles
Births from GC cycles
Notes
1999–2003
~3,400 cycles
~1,600 births
CDC first starts recording data.
2004–2008
~6,200 cycles
~3,000 births
Rising public awareness.
2009–2013
30,927 cycles (total)
13,380 deliveries
Major decade of growth.
2019
7,800 cycles
~4,000 births
Peak before the pandemic.
2021
8,862 cycles
≈ 4,200 births
Record high.
Surrogacy tells a very different story from adoption, one driven by science and shifting social acceptance. Since the late 1990s, when the Centers for Disease Control and Prevention first began recording gestational-carrier data, the number of surrogacy cycles has multiplied many times over.
What was once a few hundred births per year is now several thousand.
Surrogate pregnancies are increasingly popular in tech circles, and the practice is expected to explode globally in the coming decade. It’s also shockingly unregulated. This is a story about what happens when it goes horribly wrong. https://t.co/cNyTBXy6OK
— WIRED (@WIRED) September 14, 2025
Between 1999 and 2013 alone, over 30,000 surrogate pregnancies were recorded in the U.S., leading to about 18,000 infants according to NCBI. The growth stems from better IVF success rates, broader legal frameworks, and demand among both infertile couples and same-sex parents.
Surrogacy now accounts for around 4–5% of all ART cycles, though it still represents less than 0.1% of all U.S. births.
Decade Comparison: Surrogacy Expansion
Decade
Estimated annual surrogacy births
Change the prior decade
Main drivers
1990s
< 300
,,
Experimental medical practice.
2000s
~700–1,000
▲ +200%
IVF normalization.
2010s
~2,000–3,500
▲ +250%
Legalization in many states, celebrity visibility.
2020s
~4,000–5,000
▲ +50%
Same-sex parents demand advanced screening.
By decade, the surrogacy boom mirrors how technology moves from innovation to institution. The 1990s marked the start; cases were few and often controversial. The 2000s saw IVF become mainstream, pushing surrogacy into the public eye.
By the 2010s, high-profile cases and legal recognition in many states had normalized it. The 2020s have pushed numbers to all-time highs, with international intended parents accounting for up to a third of cycles in some clinics.
Geography and Law
Category
States permitting compensated surrogacy
States restricting/prohibiting
Fully legal & regulated
CA, NV, CO, IL, NJ, DC
,,
Limited or judicially approved
FL, TX, UT, OR
,,
Restrictive/unclear laws
MI, NE, LA (until 2024 reforms)
Penalized contracts (MI banned until repeal).
Surrogacy remains largely state-governed, producing a patchwork of laws. California and Illinois are leading examples, offering full legal recognition of surrogacy contracts and parentage orders.
Other states, like Michigan, until 2024, banned compensated surrogacy outright. This uneven legal terrain means surrogacy tends to cluster in states with supportive legislation and advanced fertility centers. For many intended parents abroad, the U.S. remains the most legally secure option.
The rapid globalization of assisted reproduction has also changed where intended parents seek surrogacy services. While the United States offers some of the most established legal and medical infrastructures, the high costs associated with domestic surrogacy have encouraged families to compare frameworks abroad.
In recent years, Latin American jurisdictions have developed regulated pathways for international surrogacy arrangements, often discussed in comparative legal studies and reports such as those referenced on surrogatemexico.com.
These references help illustrate how economic and policy contrasts between countries influence where intended parents choose to begin the process, without implying that one model is superior to another.
Comparing Adoption and Surrogacy
Metric
Adoption
Surrogacy
Annual volume (2024)
~77,000 children
~4,000–5,000 infants
Governing system
Public & private legal adoption laws
Assisted reproduction & contract law
Cost range
$0–$50,000 (foster → private)
$80,000–$150,000+ per journey
Child age
Often older or infant (varies)
Newborn (biological link)
Main motivation
Providing a home to an existing child
Achieving biological parenthood
Regulatory uniformity
Federal–state mix (AFCARS, NCFA)
Highly state-dependent
Long-term trend
Slight decline post-2019
Gradual increase since 2000
The comparison highlights two fundamentally different paths to parenthood. Adoption is an act of integration, bringing an existing child into a family. Surrogacy is an act of creation, bringing into existence through collaboration.
The scale difference is enormous: for every baby born through surrogacy, roughly fifteen children are adopted. But socially, both serve the same purpose, turning intention into family.
What the Data Reveal
From a distance, these statistics might look like simple counts, but together they reveal a deep transformation in American social policy. Fewer children enter the foster system than in the 1990s, showing better early interventions.
Private domestic adoption remains stable, signaling consistent demand despite declining birth rates. International adoption has nearly disappeared, replaced by domestic permanency efforts and local solutions abroad.
Meanwhile, surrogacy’s expansion shows how science has become part of the family story, offering a biological connection to those who could not have it before.
Both systems, adoption and surrogacy, illustrate that family formation in America has never been more diverse. Yet they also expose inequalities: adoption depends heavily on state resources and caseworkers, while surrogacy depends on wealth and legal access.
The intersection of technology, policy, and human longing defines how families form in the 21st century.
At any given moment today, around 80,000 children a year are adopted, while thousands more are born through surrogacy. The numbers alone do not tell the full story. Behind them lies a society that continues to adapt, where love, law, and science intersect to ensure that every child, however they arrive, has a place to belong.