

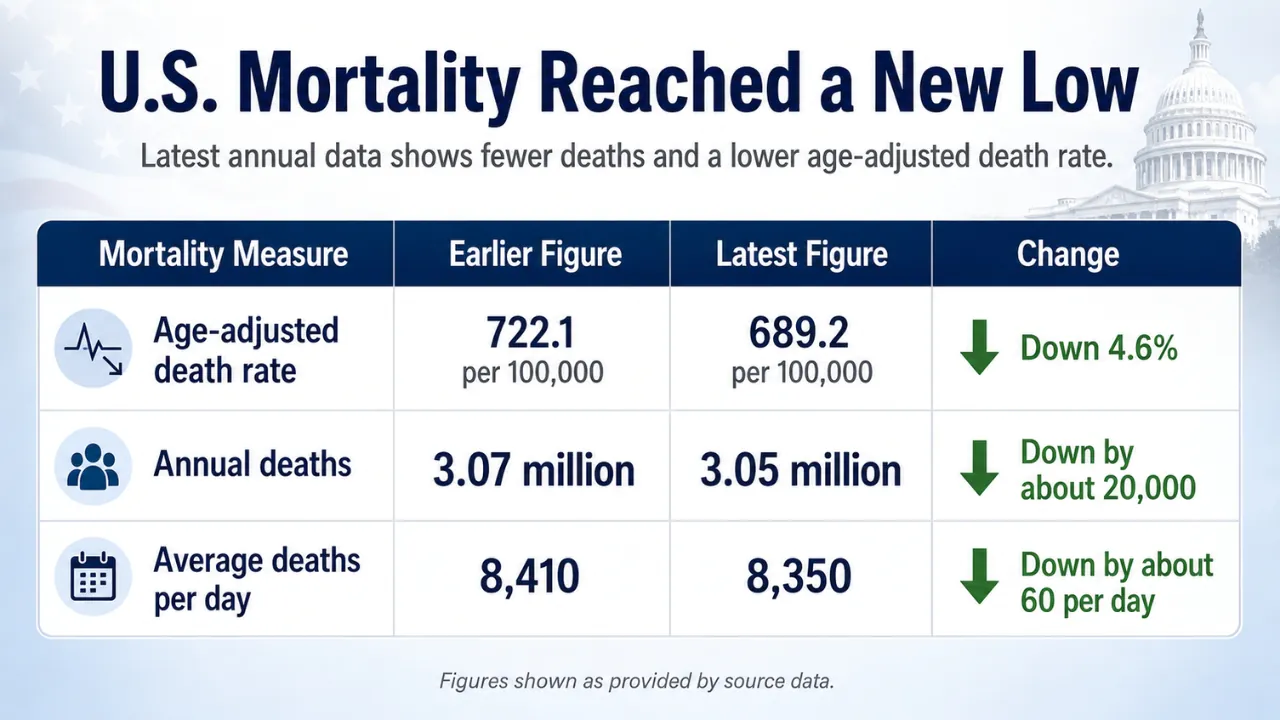
About 8,350 people die on an average day in the United States. That equals roughly 348 deaths every hour, six every minute, and one death about every 10 seconds.
The calculation is based on around 3.05 million deaths recorded in the latest national data available in 2026. The total remains provisional while the Centers for Disease Control and Prevention completes its review of death certificates.
The more important finding is the direction of the death rate. The age-adjusted U.S. death rate fell to 689.2 deaths per 100,000 people, the lowest level recorded in federal mortality data. It was 722.1 per 100,000 one year earlier.
Heart disease remains the leading cause of death. Cancer ranks second, followed by unintentional injuries. Stroke, chronic respiratory disease, Alzheimer’s disease, and diabetes account for another large share of deaths.
Key Takeaways
- Around 3.05 million people died in the United States during the latest provisional reporting year.
- The total equals about 8,350 deaths per day.
- About 348 people die each hour and almost six die each minute.
- The age-adjusted death rate fell 4.6% to 689.2 per 100,000 people.
- Heart disease remains the leading cause of death.
- Cancer is expected to cause 626,140 deaths during 2026, or about 1,715 per day.
- Drug overdose deaths fell to 71,500 during the 12 months ending in October 2025.
- Influenza and pneumonia caused 56,511 deaths and moved into eighth place.
- U.S. life expectancy reached 79.0 years in the latest completed national calculation.
- Women live an average of 81.4 years, compared with 76.5 years for men.
How Many People Die Each Day in the United States?

The daily figure comes from dividing the provisional annual total of around 3.05 million deaths by 365 days.
| Measure | Latest Figure Available in 2026 |
|---|---|
| Annual deaths | 3.05 million |
| Deaths per day | 8,350 |
| Deaths per hour | 348 |
| Deaths per minute | 5.8 |
| Time between deaths | 10 seconds |
| Age-adjusted death rate | 689.2 per 100,000 people |
| Annual change in death rate | Down 4.6% |
The annual total is still provisional. Death certificates can take weeks or months to reach the National Center for Health Statistics, particularly when a death requires an investigation.
The final number may therefore be slightly higher. A moderate adjustment would not materially change the daily average.
Readers can examine the underlying records through the National Vital Statistics System. The CDC also publishes frequently requested national figures through its mortality statistics database.
The U.S. Death Rate Fell to a Record Low
The age-adjusted death rate declined from 722.1 to 689.2 deaths per 100,000 people. That was a reduction of 4.6% in one year.
Age adjustment matters because the American population is getting older. A country with more older residents can record more deaths even when health outcomes at each age are improving.
An age-adjusted rate answers a different question from the raw death total. It shows what the rate would look like if the age distribution remained constant.
Why the Number of Deaths Can Stay High
More than 61 million Americans are now 65 or older. Older adults have much higher mortality rates than children and working-age adults.
The aging population places upward pressure on the total number of deaths. Improvements in treatment and prevention can lower the death rate while the raw annual total remains near three million.
Our examination of Americans aged 85 and older provides more context for the fastest-growing part of the older population.
What Causes the Most Deaths Each Day?
Heart disease and cancer cause more deaths than any other conditions. Together, they account for roughly four in every 10 deaths.
The daily figures below are rounded. Most are calculated from the latest completed national counts. The cancer figure uses the American Cancer Society projection for 2026.
| Rank | Cause | Approximate Deaths per Day | Current Finding |
|---|---|---|---|
| 1 | Heart disease | About 1,800 | Largest cause of death |
| 2 | Cancer | About 1,715 | 626,140 deaths projected in 2026 |
| 3 | Unintentional injuries | About 500 | Includes falls, crashes and overdoses |
| 4 | Stroke | About 440 | Major cardiovascular cause |
| 5 | Chronic lower respiratory disease | About 400 | Includes COPD and related conditions |
| 6 | Alzheimer disease | About 315 | Concentrated among older adults |
| 7 | Diabetes | About 275 | Can also contribute to heart and kidney deaths |
| 8 | Influenza and pneumonia | About 155 | 56,511 deaths in the latest provisional count |
| 9 | Kidney disease | About 150 | Closely associated with diabetes and hypertension |
| 10 | Chronic liver disease and cirrhosis | About 140 | Alcohol and metabolic disease are major causes |
Cause-of-death rankings use the underlying cause listed on the death certificate. A person may have several serious conditions, but only one is selected as the disease or injury that began the fatal sequence.
More figures are available in our review of the leading causes of death in the United States.
The 10 Leading Causes of Death
View this post on Instagram
1. Heart Disease
Heart disease kills about 1,800 Americans on an average day. It has remained the leading cause of death for more than a century.
The category includes coronary artery disease, heart failure, and several other conditions. Coronary heart disease accounts for the largest part of the total.
High blood pressure, smoking, diabetes, high cholesterol, obesity, and limited physical activity all raise the risk. Age and family history also matter.
Access to care can determine whether a heart attack is survivable. Rural residents frequently travel farther to reach emergency departments and specialist cardiac units. Longer travel and ambulance times can delay treatment.
The CDC heart disease statistics explain how coronary heart disease, heart attacks, and related conditions affect mortality. Additional figures appear in our report on heart disease in the United States.
Heart Disease Does Not Affect Every Group Equally
Men have higher heart disease death rates than women. Black adults also face higher rates of hypertension and cardiovascular mortality than several other population groups.
Differences in insurance coverage, preventive care, income, neighborhood conditions, and hospital access contribute to the gap.
2. Cancer

The American Cancer Society expects 626,140 cancer deaths in 2026. That equals around 1,715 deaths per day.
About 2.1 million new cancer cases are expected to be diagnosed during the year.
Lung cancer remains the largest cause of cancer death. Colorectal, pancreatic, breast, and prostate cancers also account for substantial numbers.
Cancer survival has improved. The five-year survival rate for all cancers combined has reached 70%, compared with about 50% during the 1970s.
Better Survival Does Not Mean Equal Survival
Earlier detection and newer treatments have extended life for many patients. Access to screening, specialist care, and effective treatment remains uneven.
Black Americans have higher death rates for several cancers. Native American communities also face high mortality and limited access to specialist services in some regions.
3. Unintentional Injuries
Unintentional injuries include falls, poisoning, drug overdoses, motor vehicle crashes, drowning, fires, and workplace accidents.
The category causes roughly 500 deaths per day. It is the leading cause of death for many younger age groups, even though heart disease and cancer dominate the national total.
Falls Become More Dangerous With Age
Falls are the leading cause of injury for adults 65+, but many falls are preventable. Take our quick self-assessment to learn your risk and get personalized tips to stay safe, strong and independent: https://t.co/4RSR2qf98I pic.twitter.com/1TQ7bqvosC
— Stony Brook Medicine (@StonyBrookMed) June 26, 2026
Falls are a major cause of injury death among adults aged 65 and older. Poor balance, medication side effects, impaired vision, and unsafe home environments can increase the risk.
The CDC fall prevention program recommends medication reviews, strength and balance exercises, vision checks, and removal of household hazards.
Traffic Deaths Remain a Large Part of the Total
Motor vehicle crashes kill tens of thousands of people each year. Speeding, alcohol, distraction, and failure to use seat belts remain major factors.
Current crash data can be found through the Fatality Analysis Reporting System maintained by the National Highway Traffic Safety Administration.
4. Stroke

Stroke kills around 440 Americans per day. It occurs when blood flow to part of the brain is blocked or when a blood vessel ruptures.
Rapid treatment can reduce brain damage and improve survival. Sudden facial drooping, arm weakness, speech difficulty, vision problems, or loss of balance requires an immediate emergency response.
High blood pressure is one of the most important preventable stroke risks. Diabetes, smoking, high cholesterol, and irregular heart rhythms also increase risk.
The CDC stroke statistics provide national mortality, hospital, and risk-factor data.
5. Chronic Lower Respiratory Disease
@learnbyosmosisChronic obstructive pulmonary disease (COPD) refers to a heterogeneous, usually progressive lung condition that results in airflow obstruction and breathing difficulties. It’s often caused by long-term exposure to irritants, such as tobacco smoke. Over time, COPD can lead to irreversible lung damage, making breathing difficult and limiting everyday activities. Watch the full video to learn more about COPD on Osmosis.org! #medtok #nursetok #pasoftiktok #healthtok #chronicobstructivepulmonarydisease #copd #shortnessofbreath #lungs #respiratorysystem #emergencymedicine #pathology #foryoupage #fyp♬ original sound – Osmosis from Elsevier
Chronic lower respiratory diseases cause about 400 deaths per day. Chronic obstructive pulmonary disease, known as COPD, accounts for most of them.
Smoking remains the main preventable cause. Long-term exposure to dust, chemicals, air pollution, and secondhand smoke can also damage the lungs.
More than 11 million American adults have been diagnosed with COPD. Many other cases remain undiagnosed because breathlessness and coughing may be dismissed as ordinary signs of aging.
The American Lung Association COPD report contains current prevalence and mortality findings.
Air Quality Can Trigger Medical Emergencies
Wildfire smoke and fine-particle pollution can cause severe flare-ups among people with COPD, asthma, and heart disease.
The AirNow system provides daily local air-quality readings and smoke alerts.
6. Alzheimer’s Disease

Alzheimer’s disease causes around 315 deaths per day. It is one of the few major causes whose long-term mortality burden has grown substantially as the population has aged.
The disease damages memory, reasoning, and the ability to complete ordinary tasks. Advanced disease can affect swallowing, movement, and the ability to recognize infections.
Deaths attributed to Alzheimer’s disease may understate the full burden. Pneumonia, malnutrition, or another immediate complication can be recorded as part of the fatal sequence.
The Alzheimer’s Association facts and figures provide estimates of prevalence, deaths, caregiving, and financial costs.
7. Diabetes

Diabetes causes about 275 deaths per day as the primary underlying cause. Its wider effect is larger because diabetes also contributes to heart disease, stroke, kidney failure, and infections.
More than 38 million Americans have diabetes. Millions do not know they have it.
Type 2 diabetes accounts for most diagnosed cases. Risk rises with age, family history, obesity, and physical inactivity, although the disease can affect people at any body weight.
The CDC diabetes data include prevalence, complications, and demographic differences.
8. Influenza and Pneumonia
Influenza and pneumonia caused 56,511 deaths in the latest count. That equals around 155 deaths per day.
The category moved from 11th to eighth place among the leading causes of death.
Risk is highest among older adults, infants, pregnant women, and people with chronic heart, lung, or immune conditions.
Deaths can rise sharply during a severe flu season. The annual number depends on the circulating strains, vaccine coverage, vaccine effectiveness, and the number of vulnerable people exposed.
Weekly infections, hospital admissions, and deaths are reported through the CDC FluView surveillance system.
9. Kidney Disease

Kidney disease causes about 150 deaths per day. Diabetes and high blood pressure are the two leading causes of chronic kidney disease.
The early stages often produce no obvious symptoms. Blood and urine tests may detect kidney damage before a person feels ill.
Advanced disease can require dialysis or a kidney transplant. Access becomes difficult for patients who live far from dialysis centers or lack reliable transportation.
The National Kidney Foundation guide explains risk factors, testing, and treatment.
10. Chronic Liver Disease and Cirrhosis

Chronic liver disease and cirrhosis cause around 140 deaths per day.
Heavy alcohol use remains an important cause. Hepatitis infections and metabolic dysfunction-associated steatotic liver disease also account for a growing share.
Fat accumulation in the liver can progress to inflammation, scarring, cirrhosis, and liver cancer. Obesity and type 2 diabetes raise the risk.
More national context is available in our analysis of alcohol-related deaths in the United States. The National Institute of Diabetes and Digestive and Kidney Diseases provides information on the major forms of liver disease.
How Many Deaths Are Caused by Drug Overdoses?
Around 71,500 drug overdose deaths were recorded during the 12 months ending in October 2025. That equals about 196 deaths per day.
The figure is far below the peak of roughly 111,000 annual deaths. It remains an exceptionally high toll.
| Period | Approximate Overdose Deaths | Average per Day |
|---|---|---|
| 2022 peak | 110,900 | 304 |
| 2023 | 109,000 | 299 |
| 2024 | 81,700 | 224 |
| 12 months ending October 2025 | 71,500 | 196 |
The decline has been linked to wider naloxone availability, increased access to addiction treatment, changes in the illicit drug supply, and local programs financed through opioid settlement money.
Fentanyl and other synthetic opioids remain involved in many deaths. Cocaine and methamphetamine are also present in a growing number of fatal overdoses, sometimes in combination with opioids.
The latest monthly estimates are available from the CDC provisional overdose dashboard. Our separate report examines drug overdose deaths in the United States in greater detail.
Why do more Americans Die During Winter?

Deaths are not distributed evenly throughout the year. January and other winter months usually record the highest totals.
Cold weather places additional strain on the heart. Blood vessels narrow, blood pressure rises, and the heart must work harder to maintain body temperature.
Flu, pneumonia, and other respiratory infections also spread more readily when people spend more time indoors.
Also Read: New York Legalized Medical Aid in Dying
Winter Risk Is Not Limited to Cold Exposure
Only a small share of winter deaths are recorded as hypothermia. Most of the seasonal increase appears in heart disease, stroke, and respiratory categories.
Snow and ice can delay ambulances, interrupt home healthcare, and prevent patients from collecting prescriptions. Heating costs can also force low-income households to keep homes at unsafe temperatures.
The Environmental Protection Agency cold-related mortality indicator tracks deaths associated with low temperatures.
Deaths Differ Greatly by Age
Most deaths occur among older adults. People aged 65 and older account for roughly three-quarters of all U.S. deaths.
| Age Group | Causes With a Major Effect |
|---|---|
| Under 1 year | Congenital conditions, complications of pregnancy, and sudden unexpected infant death |
| 1 to 14 years | Injuries, cancer, and congenital conditions |
| 15 to 44 years | Unintentional injuries, overdose, suicide, homicide, and cancer |
| 45 to 64 years | Heart disease, cancer, liver disease, diabetes, and injuries |
| 65 to 84 years | Heart disease, cancer, stroke, respiratory disease, and diabetes |
| 85 years and older | Heart disease, dementia, stroke, cancer, and respiratory disease |
A Cause Can Rank Differently Within Each Age Group
Heart disease leads the national ranking because it causes many deaths among older adults. It is not the leading cause at every age.
Injuries account for a much larger share of deaths among teenagers and younger adults. Cancer becomes more prominent in middle age. Alzheimer’s disease is concentrated among the oldest Americans.
Life Expectancy in the United States
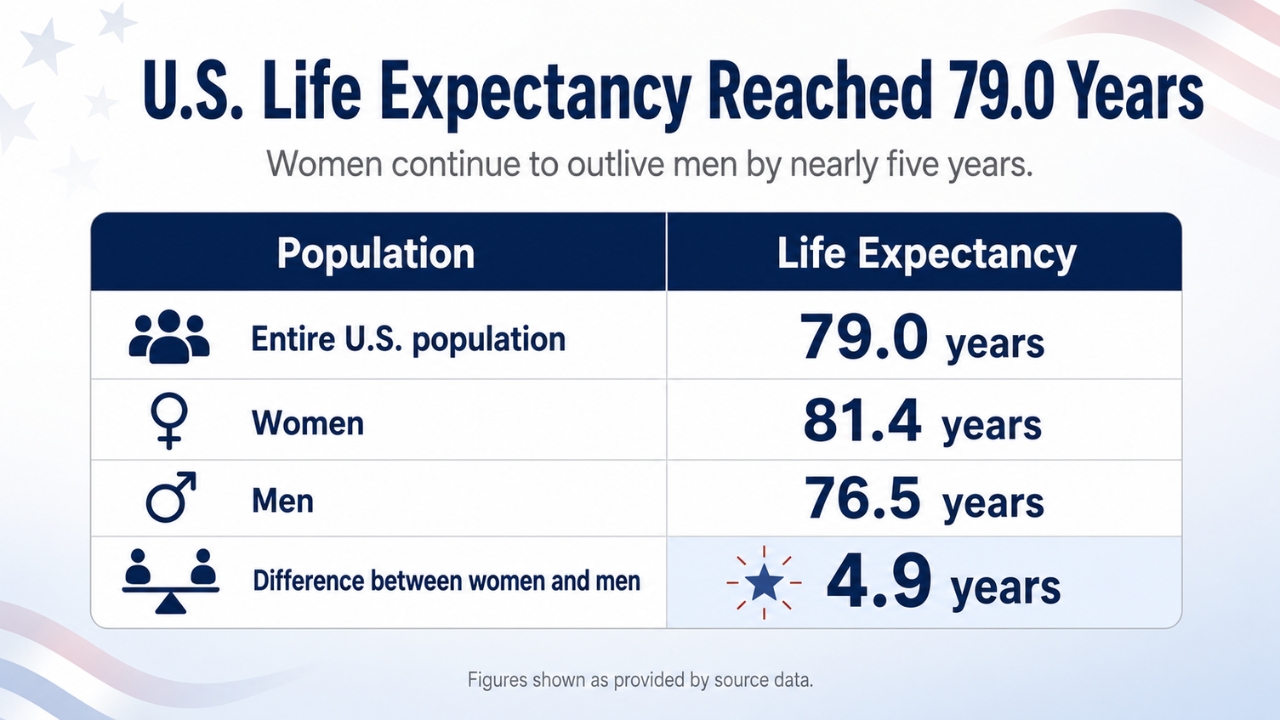
U.S. life expectancy reached 79.0 years in the latest finalized calculation available in 2026.
Life expectancy for women was 81.4 years. The figure for men was 76.5 years, leaving a gap of 4.9 years.
Life expectancy does not predict the exact lifespan of an individual. It summarizes the death rates recorded at every age during a particular year.
The national average can rise when fewer children, younger adults, or middle-aged people die, even if the largest number of deaths still occurs among older residents.
Our review of U.S. life expectancy trends follows the longer historical movement of the national average.
Death Count and Death Rate Are Not the Same
1. Total Deaths Measure the Size of the Loss
The annual death count shows how many people died. It is useful for planning hospitals, funeral services, public health budgets, and survivor support.
2. The Crude Death Rate Accounts for Population Size
The crude death rate divides the number of deaths by the population. It is usually expressed as deaths per 100,000 residents.
A larger population can produce more deaths without having a higher death rate.
3. The Age-Adjusted Rate Supports Fairer Comparisons
The age-adjusted rate controls for differences in age distribution. It is better suited to comparisons between years, states, and demographic groups.
Florida can have a high crude death rate because it has a large older population. A younger state may record fewer deaths even when residents at a given age face similar or higher risks.
How Accurate Is a Daily Death Estimate?

No exact number applies to every day. Daily deaths rise and fall with weather, outbreaks, disasters, holidays, and ordinary statistical variation.
The figure of 8,350 is an annual average. The actual number on a winter day may be substantially higher than the number on a mild summer day.
Death Certificates Take Time to Process
Most deaths are reported quickly, but the underlying cause may remain unresolved when an autopsy, toxicology test, or law-enforcement investigation is required.
Overdose, suicide, and homicide totals are especially likely to change between provisional and final publication.
One Death Can Have Several Contributing Conditions
A death certificate records one underlying cause and may list several contributing conditions.
For example, diabetes may contribute to kidney failure and heart disease. The death may be placed in only one category in the leading-cause table.
Methodology
The daily estimate divides around 3.05 million provisional deaths by 365 days. Hourly and minute figures were calculated from the same annual total.
The age-adjusted death rate of 689.2 per 100,000 comes from national mortality findings released in 2026. The earlier comparison rate was 722.1 per 100,000.
The leading cause of death follows the newest federal mortality ranking. Daily cause figures are rounded because several final cause-specific totals remain subject to certification.
The 2026 cancer estimate comes from the American Cancer Society. Overdose figures come from provisional National Center for Health Statistics records. Life-expectancy figures use finalized national mortality data.
Deaths are counted by place of residence rather than the location where the person died. A resident who dies in another state is assigned to the state where the person lived.
Final Analysis

About 8,350 deaths occur on an average day in the United States. Heart disease and cancer account for the largest share, followed by injuries, stroke, and chronic respiratory disease.
The latest death rate is lower than at any previous point in the federal record. Drug overdose deaths have also fallen substantially, and life expectancy has reached 79.0 years.
Population aging means the annual death count may remain high even as mortality rates improve. More Americans are reaching ages where heart disease, cancer, stroke, and dementia become common.
The national average also hides large differences between states, communities, and income groups. Access to emergency care, preventive medicine, safe housing, and effective treatment continues to shape who lives longer and who dies earlier.
Primary Sources
- CDC National Vital Statistics System mortality records
- CDC FastStats deaths and mortality data
- CDC provisional drug overdose death counts
- American Cancer Society cancer facts and statistics
- CDC heart disease facts and statistics
- CDC stroke mortality statistics
- CDC national diabetes data
- American Lung Association COPD trends
- Alzheimer Association facts and figures
- National Kidney Foundation chronic kidney disease data
- EPA cold-related death indicator
- NHTSA fatal traffic crash records