

Teaching remains one of the most vital professions in America, yet its financial rewards have long been the subject of debate.
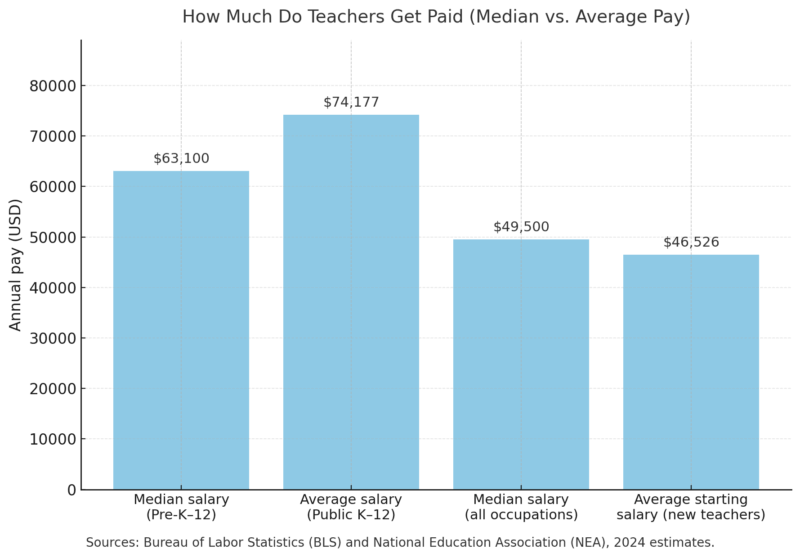
As of 2024, the median annual wage for pre-K through 12th-grade teachers across the United States is about $63,100, according to the Bureau of Labor Statistics (BLS).
That number sits comfortably above the national median wage for all U.S. workers ($49,500), a 21.6 percent difference, but still below many professions requiring comparable education and licensing.
In practical terms, half of American teachers earn less than $63,100, while the top 10 percent make over $102,000 a year.
The National Picture: Median vs. Average Pay
According to the National Education Association (NEA), the average teacher salary, a figure that tends to be higher than the median because it includes long-tenured educators, rose to about $72,030 in the 2024–25 school year, marking a modest 3 percent nominal increase from the previous year.
However, adjusted for inflation, this represents virtually flat growth.
Pay Differences by Grade Level
Teacher earnings rise gradually with the age and grade level of the students they teach.
Preschool educators, who typically require less formal education and work in more varied institutional settings, earn the least; high-school teachers, who manage larger class loads and often teach specialized subjects, earn the most.
Grade Level
Median Annual Wage (2024)
Difference from Preschool Teachers
Preschool
$52,800
,
Kindergarten
$60,000 (est.)
+13.6 %
Elementary School
$63,400 (est.)
+20 %
Middle School
$64,000
+21 %
High School
$64,700
+22.5 %
According to BLS data, high-school teachers out-earn preschool teachers by nearly a quarter, underscoring how teaching older students, and meeting corresponding credential requirements, can significantly affect income.
Public vs. Private School Salaries
Funding structures play a central role in how teachers are paid. Public schools, supported by federal, state, and local tax revenues, tend to follow salary schedules negotiated with teachers’ unions.
Private schools rely primarily on tuition and endowments, leading to more variability and, often, lower pay.
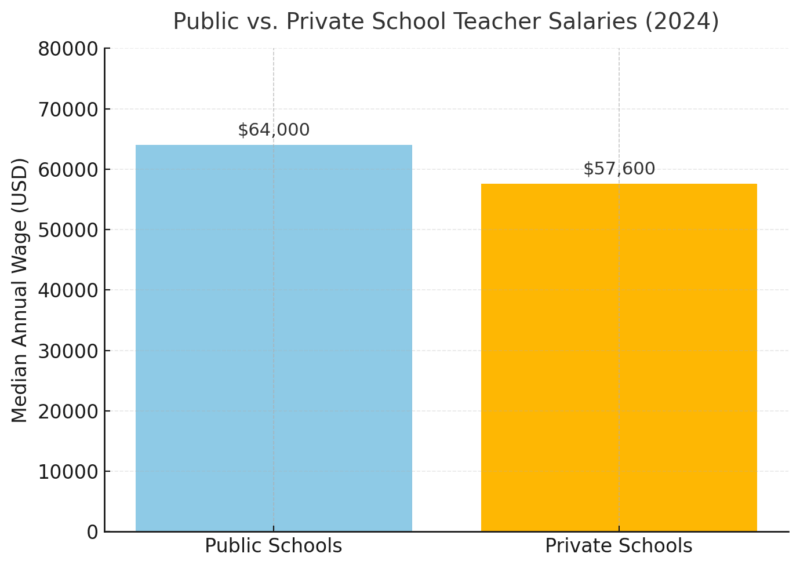
As the NEA notes, this roughly $6,400 pay gap reflects the stronger collective bargaining power of public-school educators and the broader funding base of the public education system.
Special Education and Technical Teachers
Not all teaching roles are compensated equally. Special-education teachers, those serving students with disabilities, consistently earn more at every level. In 2024, their median wages ranged from 4 to 19 percent higher than those of general education teachers.
The largest disparity appeared at the preschool level, where special-education teachers earned $62,700 compared with $52,800 for general preschool educators.
Teaching Category
Grade Level
Median Annual Wage (2024)
% Difference vs. General Ed
Special Education
Preschool
$62,700
+19 %
Special Education
Elementary
$66,000 (est.)
+4–6 %
Special Education
High School
$67,000 (est.)
+5 %
Technical Education
Middle School
$63,600
≈ Same
Technical Education
High School
$64,000
≈ Same
These differences arise from the specialized training and certification required for special-education roles, as well as the challenging classroom environments they often face.
Average Teacher Pay by State (NEA 2024 Data)
According to the National Education Association (NEA), the national average salary for teachers was $72,030 in 2024. However, the average varies dramatically by state.
The table below lists average and starting teacher salaries in all 50 states and the District of Columbia. Note that NEA and Bureau of Labor Statistics data differ slightly in methodology, which may limit direct year-to-year comparisons.
Rank
State
Average Salary (2024)
Starting Salary (2024)
1
California
$101,084
$58,409
2
New York
$95,615
$50,077
3
Massachusetts
$92,076
$52,616
4
Washington
$91,720
$57,912
5
District of Columbia
$86,663
$63,373
6
Connecticut
$86,511
$49,860
7
Maryland
$84,338
$54,439
8
New Jersey
$82,877
$57,603
9
Rhode Island
$82,189
$47,205
10
Alaska
$78,256
$52,451
11
Oregon
$77,130
$44,446
12
Pennsylvania
$76,961
$50,470
13
Illinois
$75,978
$45,061
14
Hawaii
$74,222
$51,835
15
Minnesota
$72,430
$44,995
16
Delaware
$71,186
$48,407
17
Vermont
$69,562
$44,524
18
Utah
$69,161
$55,711
19
Michigan
$69,067
$41,645
20
Colorado
$68,647
$42,421
21
New Mexico
$68,440
$53,400
22
Ohio
$68,236
$40,982
23
Georgia
$67,641
$43,654
24
New Hampshire
$67,170
$42,588
25
Nevada
$66,930
$47,355
26
Virginia
$66,327
$48,666
27
Wisconsin
$65,762
$42,259
28
Wyoming
$63,669
$50,214
29
Arizona
$62,714
$46,128
30
Maine
$62,570
$42,380
31
Texas
$62,463
$48,526
32
Iowa
$62,399
$40,997
33
Alabama
$61,912
$44,610
34
Idaho
$61,516
$45,717
35
Oklahoma
$61,330
$41,152
36
South Carolina
$60,763
$44,693
37
Nebraska
$60,239
$38,811
38
Tennessee
$58,630
$44,897
39
Indiana
$58,620
$45,007
40
North Dakota
$58,581
$43,734
41
Arkansas
$58,337
$50,031
42
Kentucky
$58,325
$40,161
43
North Carolina
$58,292
$42,542
44
Kansas
$58,146
$42,800
45
Montana
$57,556
$35,674
46
South Dakota
$56,328
$45,530
47
Louisiana
$55,911
$46,682
48
West Virginia
$55,516
$42,708
49
Missouri
$55,132
$38,871
50
Florida
$54,875
$48,639
51
Mississippi
$53,704
$42,492
The pattern is clear: states with higher living costs, California, New York, Massachusetts, and Washington, pay teachers the most, while states in the South and Midwest trail behind.
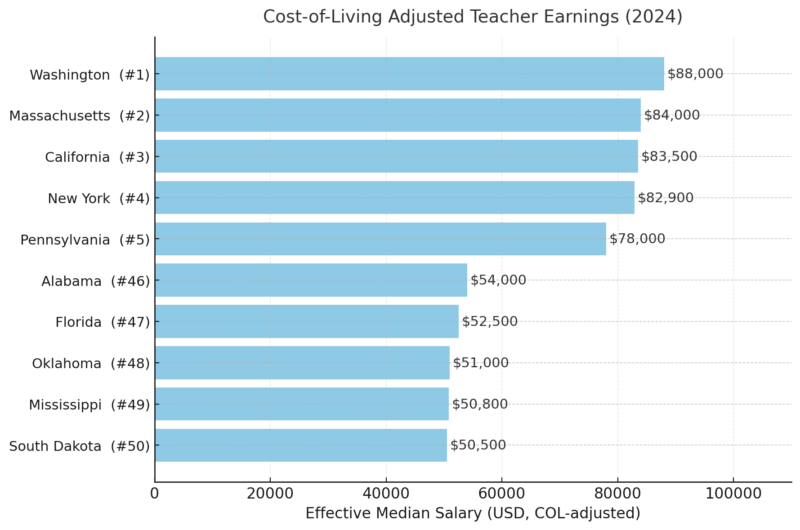
Cost-of-Living Adjustments
Nominal salaries do not tell the full story. A teacher earning $90,000 in Seattle may have less purchasing power than one earning $65,000 in Kansas City once local prices and housing costs are factored in.
Adjusted for cost of living (using Bureau of Economic Analysis regional price parities), Washington state remains the top performer, while Mississippi, Florida, and Oklahoma fall near the bottom even after adjustments.
Trends and Context
Over the past decade, teacher pay has stagnated in real terms despite small nominal gains.
According to NEA data, average teacher salaries increased by about 15 percent between 2014 and 2024, but inflation during that period exceeded 25 percent. When adjusted, most teachers effectively earn less purchasing power today than they did ten years ago.
At the same time, other professions requiring a bachelor’s degree, such as computer systems analysts or registered nurses, have seen real wage growth. As a result, the “teacher wage penalty,” first highlighted by the Economic Policy Institute, persists nationwide.
Why the Pay Gap Persists
Several structural factors keep teacher pay growth restrained:
Despite these challenges, teacher compensation packages often include strong health benefits, pension contributions, and extended leave schedules, partially offsetting the lower base pay compared to private-sector roles.
Conclusion
View this post on Instagram
In 2024, the median U.S. teacher earns about $63,100 per year, with substantial variation by grade level, specialization, and geography. High-school teachers in Washington can approach six-figure salaries, while preschool educators in Utah may earn barely one-third of that.
Public-school teachers earn more than private-school counterparts across every grade, and those in special-education roles command a consistent premium.
Yet even as average pay edges upward in dollar terms, inflation and housing costs continue to erode real purchasing power, leaving many educators feeling undervalued.
As policymakers debate how to attract and retain qualified teachers, one fact remains clear: America’s classrooms run on professionals whose compensation rarely reflects the full weight of their work.