
In February 2025, new data from CEIC and the UN World Population Prospects revealed something fascinating yet sobering: if we divided all the world’s liquid money equally, every person on Earth would have about $15,108.
On the surface, that sounds promising – until you consider how little that actually buys in today’s economy and how unevenly that money is really distributed.
When “money” is defined in a broader sense to encompass total global net wealth, including physical assets such as real estate and gold, along with financial assets like stocks and bonds, minus all liabilities, the estimated total value stands at roughly $400 to $500 trillion USD.
| Category | Definition | Components | Liquidity |
| M0 | Physical currency in circulation | Notes and coins held by the public and central banks | Highest |
| M1 | M0 plus demand deposits | Checking accounts and other instantly accessible funds | Very high |
| M2 | M1 plus near-money assets | Savings deposits, money-market funds, and small time deposits | Moderate |
| M3 | M2 plus large institutional deposits and repurchase agreements | Broadest measure, includes large-scale financial assets | Lower |
Key Takeaways
$123 Trillion Split Among 8 Billion People
By the end of 2024, the total global M2 money supply, which includes cash, savings accounts, and money market funds, stood at approximately $123.3 trillion according to CEIC data.
With the UN estimating the world’s population at 8.16 billion people, a simple division gives us:
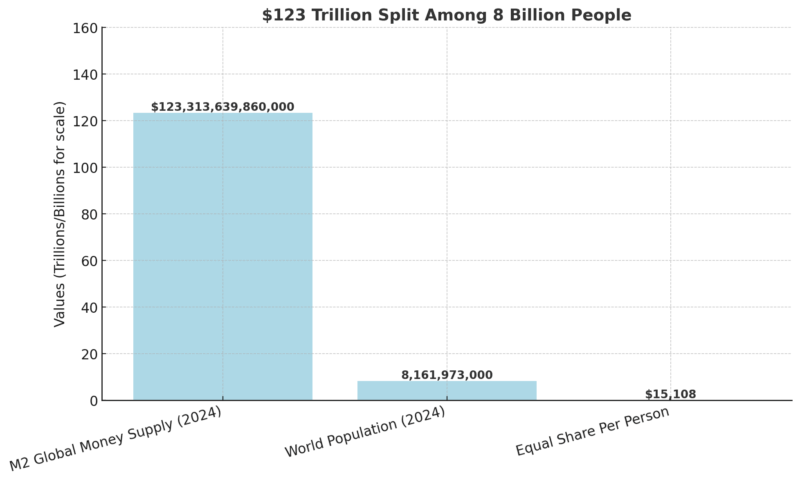
But here’s the catch: this calculation doesn’t include real estate, stocks, crypto, private businesses, or other illiquid assets. It represents only the cash-like wealth in circulation — the liquid fuel that drives everyday economic activity.
What $15,000 Actually Means in 2025
It’s tempting to imagine a world where everyone instantly receives $15,108, but the reality is far less optimistic:
- Housing Costs → In major U.S. cities like New York or San Francisco, $15,000 barely covers 3–4 months of rent according to Inhabit.
- Groceries → The USDA estimates that an average American household spends about $7,500 per year on groceries, meaning $15,000 covers roughly two years’ worth of food.
- Transportation → A decent used car in 2025 averages $12,000–$18,000, depending on mileage and model.
- Technology → One high-end gaming PC or workstation setup can cost nearly $5,000–$6,000.
In many countries with lower costs of living, $15,000 stretches further — but it’s still far from life-changing wealth. More importantly, most people don’t have access to this “average share” because money isn’t distributed equally.
The Reality: Wealth Is Highly Concentrated
46%:
Share of global wealth held by adults worth over $1 million.
These millionaire adults make up 1% of the global adult population.
For more: https://t.co/2gW8qrKgNy pic.twitter.com/PL9FtJIaft
— Inequality.org (@inequalityorg) July 3, 2021
While the hypothetical $15,108-per-person figure looks straightforward, the real distribution of money is drastically uneven:
This inequality means that, in practice, a small portion of the population holds vast pools of liquid assets, while billions survive with very limited access to cash and savings.
| Metric | Value (2023) | Source |
| Top 1 % share of global wealth | 44.5 % | UBS |
| Top 10 % share | 84.8 % | UBS |
| Median wealth per adult | $9,167 | UBS Databook 2023 |
| Adults with < $10,000 in wealth | 52 % of global adults | UBS |
| Adults with > $1 million | 1.1 % | UBS |
Regional differences are equally large: North America and Europe hold nearly two-thirds of total household wealth, while Africa and India combined account for under 3 %.
Financial assets correlate strongly with M2, since higher-income regions maintain deeper banking penetration and broader savings networks.
Understanding M2: Why Economists Track It
The $123 trillion figure is based on the M2 global money supply, a metric economists watch closely because it reflects spending power in the economy.
Category
Included in M2
Excluded from M2
Cash & Coins
Yes
—
Checking Accounts
Yes
—
Savings Accounts
Yes
—
Money Market Funds
Yes
—
Real Estate, Stocks, Crypto
No
Not counted
Private Businesses
No
Not counted
When M2 grows faster than real economic output, it can signal inflation. For example, when governments inject cash into households — as seen during pandemic stimulus waves — it boosts M2 but can also push prices up if production doesn’t match demand.
View this post on Instagram
That’s why central banks around the world, including the Federal Reserve, European Central Bank, and People’s Bank of China, constantly adjust interest rates and lending policies to manage money supply growth.
Global data providers such as CEIC and the IMF track M2 most consistently across countries. It reflects the sum of money available for spending and saving without drifting into long-term or illiquid holdings
M2 excludes physical assets and investments such as real estate, stocks, bonds, and private businesses, focusing strictly on liquid monetary forms.
Because M2 is an aggregate, dividing it by global population gives an average, not a measure of personal wealth. Large inequalities mean that this “per-person” number hides vast differences in actual access to money. According to UBS the global median wealth per adult is about $9,167, far below the mean, illustrating how a few wealthy individuals raise the average while most people hold much less.
Regional Breakdown of M2 (End-2024 Estimates)
| Region | M2 (USD trillion) | Population (billion) | M2 per capita (USD) | Source |
| United States | 21.2 T | 0.341 | 62,200 | fred.stlouisfed.org |
| Eurozone | 16.5 T | 0.347 | 47,550 | tradingeconomics.com |
| China | 44.0 T | 1.42 | 31,000 | en.macromicro.me |
| Japan | 9.6 T | 0.124 | 77,400 | BoJ / IMF |
| India | 6.4 T | 1.43 | 4,475 | RBI / CEIC |
| Rest of World | 41.6 T | 6.05 | 6,874 | Derived |
Currency conversions reflect average 2024 USD exchange rates. Differences stem from banking depth, savings rates, and financial infrastructure.
Inflation, GDP, and the Ripple Effect
An expanding M2 money supply doesn’t necessarily make people richer. If too much money chases too few goods, prices rise, reducing the real purchasing power of cash holdings.
For instance, according to the IMF’s Global Outlook 2025:
This dynamic affects nominal GDP — the dollar value of everything produced — but doesn’t always reflect real improvements in living standards.
IMF forecasts (April 2024 WEO) project global inflation 5.9 %, advanced economies 2.6 %, and emerging economies 8.3 %. Inflation erodes the real purchasing power of money even if nominal M2 rises.
Comparing nominal M2 growth to global GDP shows that liquidity has expanded faster than real production since 2020, partly due to stimulus and debt monetisation.
Average GDP per capita remains higher than M2 per capita in developed nations but lower in many emerging markets, underscoring unequal capacity to convert money supply into consumption or investment.
Comparing the U.S., Europe, and Asia: Who Holds the Most Liquid Money?
M2 money supply isn’t distributed evenly between regions, either. In fact, three economies dominate global liquidity:
Region
M2 Money Supply (2024)
Population (2024)
M2 Per Person
United States
~$21.2T
341M
~$62,200
Eurozone
~$16.5T
342M
~$48,200
China
~$43.5T
1.4B
~$31,000
Rest of World
~$42.1T
6B+
~$7,000
This highlights why global averages can be misleading. Residents of the U.S. or Germany effectively sit on far more liquid money per person than those in India, Nigeria, or Indonesia — widening global financial inequality.
Why This Matters for the Future
Understanding how money is distributed isn’t just a thought experiment — it affects:
- Global Financial Stability → High inequality makes economies vulnerable to shocks.
- Policy Decisions → Governments use M2 trends to decide on interest rates, taxation, and stimulus.
- Personal Finance → Knowing where liquidity pools are growing can influence investment strategies.
- Digital Assets & Crypto → With uneven access to banking, decentralized finance is increasingly being seen as a tool to rebalance liquidity in developing economies.
Final Thoughts

At first glance, knowing there’s enough liquid money for everyone to have $15,000 seems comforting. But once you factor in wealth inequality, cost of living, inflation, and regional concentration, the picture changes dramatically.
The reality is that most people don’t have anywhere near that figure available, and the gap between “average” and “accessible” wealth continues to widen.
In the coming years, economists expect further divergence between those who control liquidity and those who lack it. Whether through policy reforms, technological shifts, or financial innovation, the world’s challenge will be finding ways to make financial systems work for more people, not just a few.