
Michigan’s population dynamics in 2025 is approximately 10.04 million making it a significant part of the population that counts approx. 346 million.
The demographic composition of Michigan also showcases interesting aspects, such as a nearly even gender ratio and a median age of 39.5 years.
Religious preference indicates a strong inclination towards Christian-based faiths for 70% of the population, while 24% remain unaffiliated with any religion.
Demographics

The state of Michigan has a diverse population with notable characteristics.
As of 2025, Michigan’s population is approximately 10.04 million according to Statista.
The median age stands at 39.5 years as per Axios.
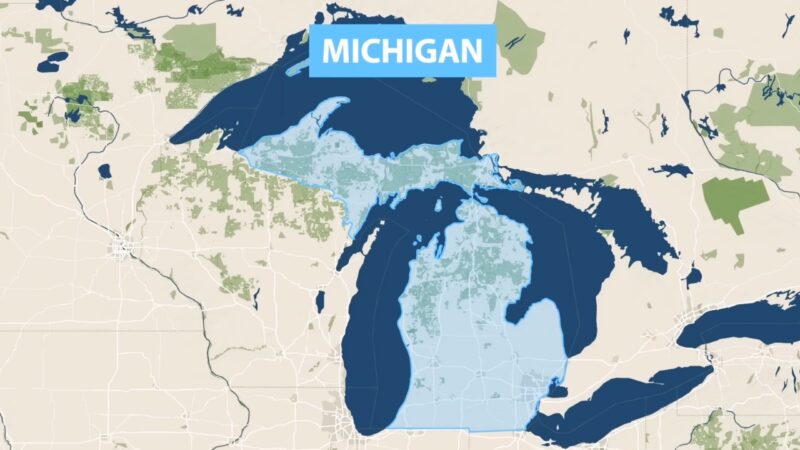
Nestled at the core of the Great Lakes region, Michigan stands out as one of the largest states in the U.S., both in land area and population.
Spanning 96,716 square miles (250,493 square kilometers), Michigan is the eleventh-largest state in the country by area.
The population density is relatively moderate, with an average of 174 people per square mile (67.1 per square kilometer), placing Michigan 18th in terms of population density.
Detroit, famously known as the Motor City, is the largest urban center in the state.
According to the 2010 census, the city’s population stood at 713,862, but by 2015, that figure had dropped to just over 677,000. Detroit has been grappling with a significant population decline since its peak of 1.85 million residents in 1950.
By 2016, more than a million people had left the city, with many relocating to nearby suburbs. However, the city’s challenges, including bankruptcy and urban decay, have likely driven others to leave the state entirely, negatively impacting Michigan’s overall population according to World Population Review.
Beyond Detroit, other notable cities in Michigan include Grand Rapids (population: 195,097), Warren (population: 135,358), Sterling Heights (population: 132,052), Lansing (population: 115,056), Ann Arbor (population: 117,070), and Flint (population: 98,310).
The state is also home to some of the largest counties in the U.S., such as Wayne County, with over 1.7 million residents, and Oakland County, with a population exceeding 1.2 million.
Population By Counties
County
Population
Growth Rate (%)
Area (sq mi)
Density (people/sq mi)
Wayne County
1,743,396
-2.58
236
2,849
Oakland County
1,269,827
-0.21
335
1,465
Macomb County
875,967
-0.49
185
1,829
Kent County
663,788
0.8
328
782
Genesee County
401,121
-1.15
246
630
Washtenaw County
364,568
-1.95
273
516
Ottawa County
305,826
3.0
218
542
Ingham County
285,797
0.39
215
514
Kalamazoo County
263,538
0.67
217
469
Livingston County
197,380
1.76
218
349
Saginaw County
187,191
-1.42
309
234
Muskegon County
177,589
1.6
195
352
St. Clair County
160,080
-0.19
278
222
Jackson County
159,090
-0.71
271
227
Monroe County
154,855
-0.03
212
282
Berrien County
151,687
-1.63
219
267
Calhoun County
133,308
-0.66
273
189
Allegan County
122,588
1.59
318
149
Eaton County
108,786
-0.36
222
189
Bay County
102,362
-1.33
171
232
Lenawee County
96,760
-2.58
290
129
Grand Traverse County
96,544
1.17
179
208
Lapeer County
89,322
0.83
250
138
Midland County
84,316
1.0
200
163
Clinton County
79,788
0.78
219
141
Van Buren County
75,927
0.47
235
125
Montcalm County
69,099
3.7
272
98
Shiawassee County
68,083
0.11
205
128
Marquette County
67,450
2.18
698
37
Ionia County
65,688
-1.77
220
115
Barry County
64,214
2.58
213
116
Isabella County
63,870
-1.0
221
111
St. Joseph County
60,978
0.06
193
122
Tuscola County
52,744
-1.07
311
66
Cass County
51,807
0.48
189
106
Newaygo County
51,488
2.75
324
61
Branch County
45,928
2.33
195
91
Hillsdale County
45,439
-0.64
231
76
Gratiot County
41,632
-0.12
219
73
Mecosta County
41,416
4.09
214
75
Sanilac County
40,254
-0.6
372
42
Houghton County
38,038
2.15
389
38
Delta County
36,799
-0.19
452
31
Chippewa County
36,321
-1.27
602
23
Wexford County
34,226
1.58
218
61
Emmet County
34,031
-0.24
181
73
Clare County
31,325
1.56
218
56
Huron County
30,709
-2.09
323
37
Mason County
29,000
-0.11
191
59
Alpena County
28,975
0.31
221
51
Oceana County
27,042
1.24
208
50
Charlevoix County
26,145
0.4
161
63
Cheboygan County
26,132
2.13
276
37
Gladwin County
26,085
2.79
194
52
Dickinson County
26,021
0.45
294
34
Otsego County
25,933
3.18
199
50
Manistee County
25,759
2.76
209
48
Iosco County
25,273
0.35
212
46
Antrim County
24,553
4.67
184
52
Roscommon County
24,044
2.44
201
46
Osceola County
23,381
2.06
218
41
Leelanau County
23,155
3.8
134
67
Menominee County
22,665
-3.35
403
22
Ogemaw County
21,061
1.35
218
37
Kalkaska County
18,736
4.49
216
33
Benzie County
18,555
3.14
124
58
Missaukee County
15,390
2.16
218
27
Arenac County
15,167
1.11
140
42
Gogebic County
14,071
-1.92
425
13
Crawford County
13,642
5.0
215
25
Presque Isle County
13,227
1.71
254
20
Lake County
12,817
5.98
219
23
Iron County
11,775
1.21
450
10
Mackinac County
10,740
-0.7
394
11
Alcona County
10,581
3.82
261
16
Montmorency County
9,799
6.86
211
18
Alger County
8,741
-1.14
353
10
Oscoda County
8,699
5.63
218
15
Baraga County
8,337
2.39
347
9
Schoolcraft County
8,124
0.83
452
7
Luce County
6,596
2.87
347
7
Ontonagon County
5,891
1.5
506
4
Keweenaw County
2,189
6.26
208
4
WPR notes that Michigan’s most populous county in 2019 was Wayne County (Detroit), with 1,753,616 residents, reflecting a -3.39% decline since 2010. Other populous counties include Oakland (1,250,836), Macomb (871,375), and Kent (648,594). Kent County had the highest growth rate at 7.58%.
The smallest county, Keweenaw, has 2,105 residents (-2.95% growth). Eight counties have populations under 10,000, including Ontonagon (5,881), Luce (6,358), and Schoolcraft (8,049). Ontonagon County experienced the sharpest decline of -13.21%.
Ottawa County leads growth with 8.44%, reaching 286,383 residents, followed by Kent (7.58%), Washtenaw (6.40%), and Grand Traverse (5.56%).
Gender and Age
- Gender ratio: 50.8% female, 49.2% male.
- Median age: 39.5 years.
Religious Preferences
Michigan shows a varied religious landscape. Around 70% follow Christian-based faiths, 5% are affiliated with non-Christian faiths, and 24% are unaffiliated with any religion.
Racial and Ethnic Composition
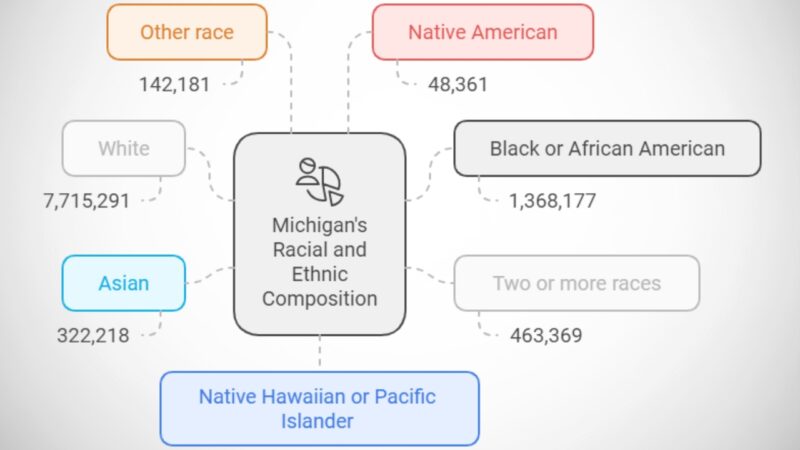
This table represents the racial composition of Michigan’s population. The majority of residents are White, accounting for 76.67% of the population, while Black or African American individuals make up 13.6%.
Smaller percentages are represented by those of mixed race, Asian, Native American, and other racial groups. Native Hawaiians or Pacific Islanders make up the smallest group at 0.03%.
Population Trends
Michigan’s population growth has been slow. From 2022 to 2034, the state is projected to gain around 231,000 people. However, by 2050, the population might decline to around 9.9 million. According to the Michigan government, this projected slow growth and eventual decline are influenced by various socioeconomic factors.
These demographic insights provide a snapshot of Michigan, reflecting its dynamic and shifting population trends.
Urban Population Dynamics
Urban areas in Michigan are characterized by a high concentration of diverse racial and ethnic groups. According to the 2020 census, over 50% of people in major cities identify as people of color. This composition varies by city, with some areas having higher or lower percentages.
The trend of increased diversity in urban centers reflects national patterns. Younger age groups tend to dominate these demographics, contributing to a dynamic cultural landscape. Education levels are typically higher, with a significant portion of residents holding college degrees.
Economic Factors
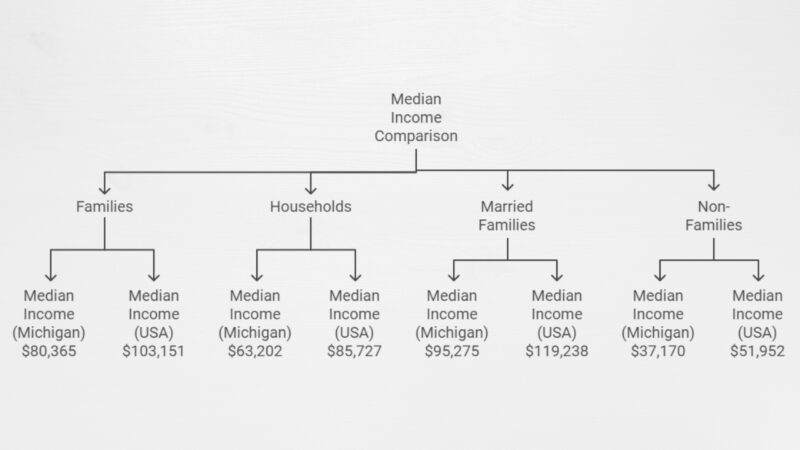
Families in Michigan have a median income of $80,365, which is below the national average of $103,151. Similarly, Michigan households and married families also fall below the national median income levels. Non-families in Michigan, earning a median of $37,170, make significantly less compared to their national counterparts at $51,952.
Housing and Urban Development
Urban developments frequently include efforts to enhance public transportation, green spaces, and community amenities. These projects aim to create more livable and sustainable cities. The Michigan Population Density Map helps urban planners identify areas with high density to better allocate resources and design effective development strategies.
1-Year Market Forecast (July 31, 2024)
- For Sale Inventory: 30,137 homes are expected to be on the market.
- New Listings: 13,092 new homes will be listed by that date.
- Median Sale Price: $248,667 (as of June 30, 2024), reflecting current trends in sale prices.
- Median List Price: Expected to rise to $269,667 by July 31, 2024, showing a potential increase in market pricing.
- Sale-to-List Ratio: A median ratio of 1.000 indicates homes are generally selling for their list price.
- Sales Over List Price: 46.1% of homes are expected to sell above their list price.
- Sales Under List Price: 38.6% of homes are expected to sell for less than the list price.
- Median Days to Pending: Homes are expected to go pending within 8 days of listing, suggesting a fast-paced market.
Zillow Home Value Index (ZHVI)
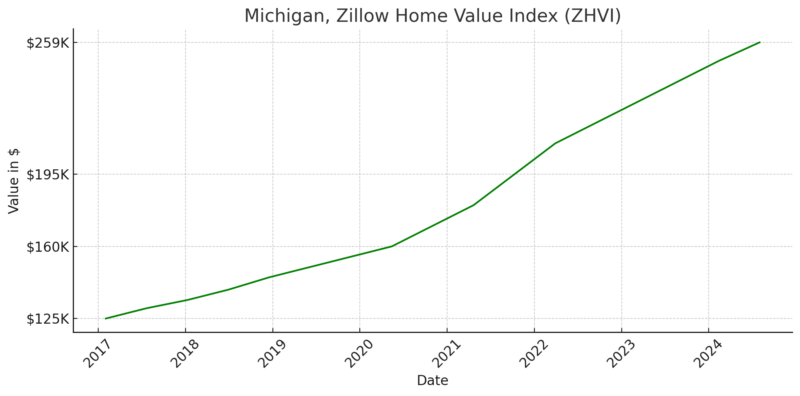
The Zillow Home Value Index tracks home value changes over time. In Michigan, the ZHVI has increased significantly from $126K in January 2017 to $261K by July 2024, highlighting strong market growth.
Specific Areas in Michigan
- High-Value Areas: Some cities in Michigan, particularly in areas near the water, have much higher median home values. For example:
- Leland: $1,088,893
- Lake Leelanau: $800,705
- Suttons Bay: $602,898
- Moderate-Value Areas: Other areas, such as Traverse City ($439,770) and Glen Arbor ($627,682), still exhibit strong values but are more affordable than the highest-tier locations.
How This Data Can Help
- Buyers: By understanding market forecasts, buyers can anticipate price trends and decide when and where to buy. A high percentage of homes selling over list price suggests a competitive market, particularly in high-demand areas.
- Sellers: Sellers can use the median sale-to-list ratio and the short median days to pending to set competitive listing prices and prepare for quick sales.
- Investors: This data helps identify high-growth areas and forecast where home values are likely to appreciate, offering potential for future gains.
Rural Population Trends
Rural population trends in Michigan show a clear decline in many areas, particularly in the Upper Peninsula and northern regions. From 2010 to 2020, 15 out of 16 counties in the Upper Peninsula experienced population decreases, with the region overall seeing a 3.1% decline.
This trend is part of a broader rural population decline across Michigan, especially in counties with limited job opportunities and aging populations. Many young people are leaving these areas, leading to a shrinking workforce and fewer school-age children according to Rural Insights.
Additionally, the state’s rural areas face significant challenges such as limited affordable housing, an aging population, and poor access to infrastructure like broadband internet. These factors contribute to ongoing population loss as younger individuals move to urban or suburban areas for better opportunities as per The Gander.
Healthcare Access
In urban areas like Detroit and Grand Rapids, residents benefit from extensive healthcare infrastructure, including numerous hospitals and specialized care facilities, offering quicker and more advanced medical services.
Rural residents, however, face significant challenges such as fewer healthcare providers and facilities. Many must travel long distances for specialized care, and access to emergency services can be limited, which negatively impacts overall health outcomes as per Michigan Medicine.
Education Systems

Urban schools typically have more resources, driven by a larger tax base, which allows for better facilities, more diverse course offerings, and extracurricular programs. Conversely, rural schools often face funding limitations, leading to outdated resources, fewer technology options, and a limited selection of advanced courses.
Additionally, rural districts may struggle to attract and retain qualified teachers, contributing to a disparity in educational quality according to the Rural Health Information Hub.
Employment
| Metric | May 2024 | June 2024 | July 2024 | Aug 2024 | Sept 2024 | Oct 2024 (p) |
|---|---|---|---|---|---|---|
| Civilian Labor Force (1) | 5,054.4 | 5,053.2 | 5,062.1 | 5,054.7 | 5,055.3 | 5,051.9 |
| Employment (1) | 4,857.6 | 4,848.4 | 4,841.3 | 4,829.2 | 4,826.2 | 4,817.0 |
| Unemployment (1) | 196.8 | 204.8 | 220.8 | 225.5 | 229.1 | 234.9 |
| Unemployment Rate (2) (%) | 3.9 | 4.1 | 4.4 | 4.5 | 4.5 | 4.7 |
- The civilian labor force remained relatively stable, fluctuating slightly between 5,051.9 (October) and 5,062.1 (July) according to BLS.
- The small variations indicate that the labor force participation rate is steady, with no significant entry or exit of workers into the labor market.
- Employment consistently declined from 4,857.6 (May) to 4,817.0 (October), reflecting a net loss of approximately 40.6 thousand jobs over this period.
- The downward trend highlights potential economic challenges, such as layoffs or reduced hiring in key sectors.
- Unemployment increased from 196.8 thousand (May) to 234.9 thousand (October), a rise of 38.1 thousand individuals.
- This suggests that more workers were unable to secure jobs despite being actively engaged in the labor market.
- The unemployment rate rose steadily from 3.9% in May to 4.7% in October.
- This progression reflects an increasing number of unemployed individuals relative to the size of the labor force, possibly signaling economic slowdowns in specific industries.
Policy Implications
Urban areas in Michigan are seeing increased population density, requiring innovative solutions to enhance livability. The state needs to invest in affordable housing to combat rising living costs. Improved public transportation systems can reduce traffic congestion and carbon emissions.
Policymakers should prioritize mixed-use development to create walkable neighborhoods, fostering community engagement. Investment in green spaces also remains critical for improving urban health and well-being. Furthermore, technology and data analytics can help optimize city planning and resource allocation to respond to evolving urban challenges effectively.
Projected Population Trends
Michigan is projected to experience slow population growth until the mid-2030s, followed by a decline through 2050, even with net positive migration. The state’s main forecast predicts an increase of about 230,000 people (2.3%) from 2022 to 2034.
However, by 2050, the population is expected to decline by approximately 130,000 people, resulting in a total of 9,906,000 residents—a 1.3% decrease from 2022. Without positive migration, this decline could be much more severe, with projections showing a potential loss of 692,000 people (6.9%) by 2050 according to government sources.
One of the primary reasons for this trend is Michigan’s shift from a younger, high-fertility population to an older, low-fertility demographic. As birth rates continue to decline and the aging population (particularly baby boomers) enters higher mortality years, the state is expected to experience a “natural decrease” in population (more deaths than births) through 2050.
Migration will play a crucial role in shaping Michigan’s future population trajectory. Historically, the state has had net negative migration, but positive net migration could temporarily offset the natural population decline. Michigan’s ability to attract migrants, especially for employment opportunities as baby boomers retire, will be vital in mitigating the overall population loss.
For more detailed information and projections, refer to the original population projection reports and data tables from the Michigan Center for Data and Analytics.
Conclusion

Michigan’s population trends illustrate the dynamic shifts between urban and rural areas. Urban regions, like Detroit and Grand Rapids, continue to attract residents due to economic opportunities and amenities. Conversely, rural areas face gradual population declines, influenced by limited access to jobs and services.
Key Points
- Urban areas show growth through migration and economic appeal.
- Rural regions experience population decreases.
Table of Urban vs. Rural Trends
Aspect
Urban
Rural
Population
Increasing
Decreasing
Economic Factors
Strong job market
Limited opportunities
Services
More amenities
Fewer services
Policymakers must address these contrasts to promote balanced growth. Initiatives could include improving rural infrastructure and incentivizing businesses to establish operations in these areas.
Efforts should also maintain and enhance urban infrastructure to support growing populations. Such strategies can ensure Michigan’s diverse regions thrive in harmony.
Methodology
References:
- Statista – Michigan Population Data 2024
- Axios – Census Data Shows Michigan’s Aging Population
- World Population Review – Michigan Population Trends and Insights
- Rural Insights – Change in Population in Michigan’s Upper Peninsula
- The Gander – Challenges Facing Rural Michiganders
- Michigan Medicine – Healthcare Access in Rural Michigan
- Rural Health Information Hub – Education Challenges in Rural Michigan
- Zillow – Michigan Zillow Home Value Index (ZHVI)
- Michigan Government – Michigan Population Projections Through 2050
- Planet Detroit – Energy Efficiency in Michigan
- Bureau of Labor Statistics (BLS) – Michigan Labor Force Data


