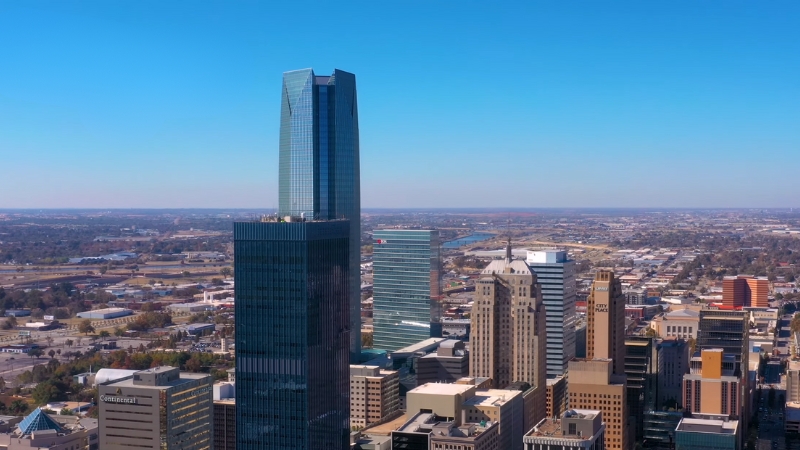
Oklahoma City, located in Cleveland County, Oklahoma, has a current population of 709,330 as of 2025 according to World Population Review.
The city is experiencing an annual growth rate of 0.93% and has seen its population increase by 3.84% since the 2020 census, which recorded a population of 683,078.
Macrotrends notes that as of 2025, the metro area population is estimated to be 1,037,000, reflecting a steady annual growth rate of nearly 1%.
This growth places Oklahoma City in a unique position within the state and the broader region.
Key Takeaways
Historical Data
Oklahoma City has experienced steady growth over the past two decades, particularly in its suburbs.
From 2000 to 2010, the city’s population grew by 8.1%, and in 2012, it became the 29th most populous city in the U.S., surpassing Milwaukee and Las Vegas.
The city attracts residents from across the country and rural areas due to its strong economy, job opportunities, and educational resources.
Founded in 1889 during The Land Run, Oklahoma City quickly grew, doubling its population within a decade. It became the state capital in 1910, replacing Guthrie.
Like many U.S. cities, Oklahoma City saw a population decline in its center during the 1970s and 1980s, as families moved to the suburbs and urban renewal projects left many vacant lots.
In the 1990s, redevelopment through the Metropolitan Area Projects (MAPS) revitalized downtown with attractions like a baseball park, library, fairgrounds, and a water canal.
This public-private partnership spurred significant growth in downtown housing and retail, leading to ongoing development and consistent population increases in every census since the city’s founding.
Age Distribution
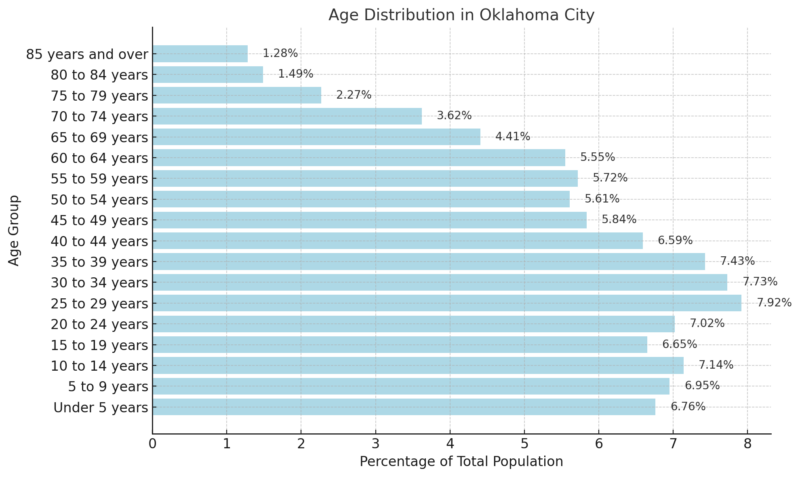
According to the 2018-2022 ACS 5-Year Estimates, the median age in Oklahoma City, OK, is 34.9. Of the total population, 20.85% are under the age of 15, 21.59% fall between 15 and 29 years, 44.47% are aged 30 to 64, 11.79% are between 65 and 84 years, and 1.28% are 85 years or older.
Gender Distribution
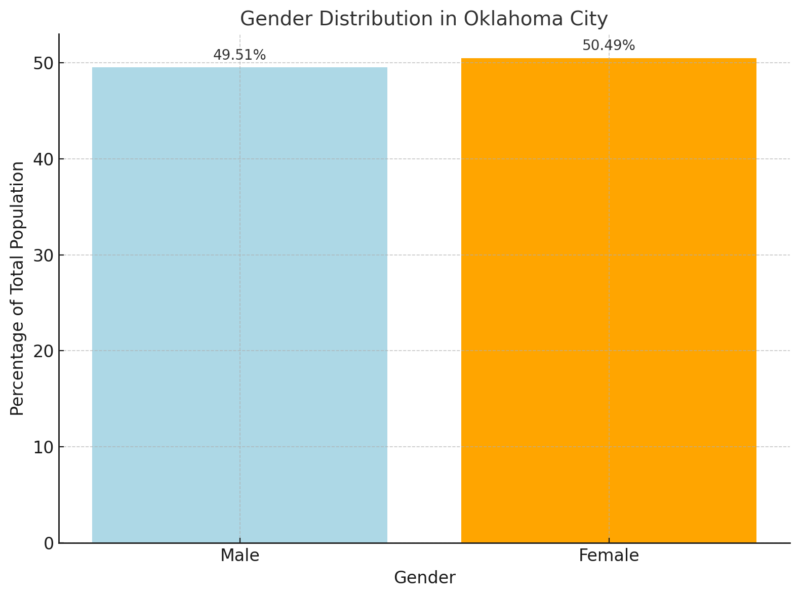
Oklahoma City’s population is almost evenly split by gender, with females making up a slightly larger portion at 50.49% compared to 49.51% for males.
This balanced distribution reflects typical demographic trends in urban areas according to Neilsberg.
Ethnic Composition
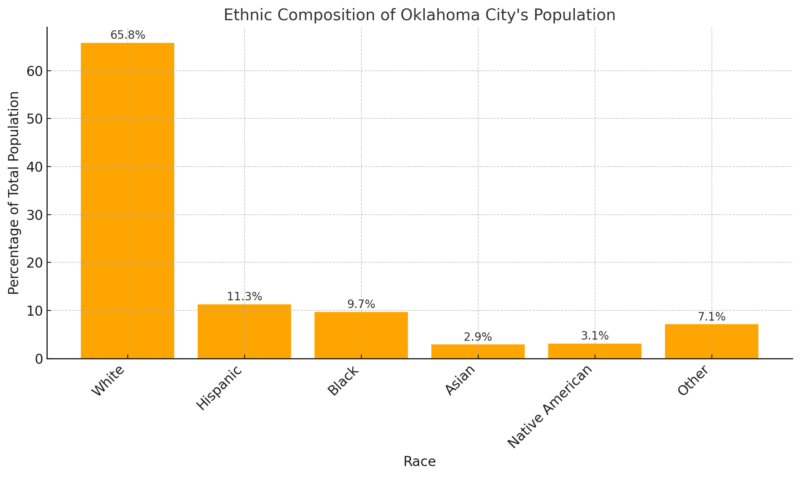
Oklahoma City’s population is predominantly White, comprising 65.8% of the total.
Hispanic residents form the largest minority group at 11.3%, followed by Black residents at 9.7%. Native Americans make up 3.1%, while Asians account for 2.9% according to Best Neighborhood.
An additional 7.1% of the population identifies as belonging to other racial groups. This diverse demographic reflects the city’s role as a cultural and economic hub within the region.
Labor Force Data for Oklahoma City, OK
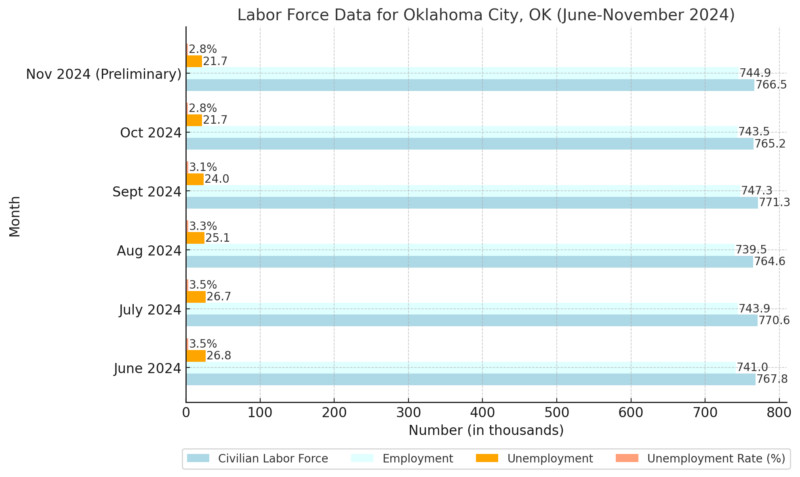
BLS notes that from June to November, Oklahoma City experienced a decline in its unemployment rate, dropping from 3.5% to 2.8%.
The number of unemployed individuals decreased steadily from 26.8 thousand in June to 21.7 thousand in October and November.
Meanwhile, the civilian labor force and employment figures showed relatively stable trends, with slight fluctuations.
This reflects a strong labor market and consistent economic growth in the city during this period.
Housing Market
Metric
Value
Growth (YoY)
Median Sale Price
$259,990
+0.4%
The median sale price of homes in Oklahoma City increased by a modest 0.4% year-over-year, reaching $259,990 in December 2024.
This small but positive growth indicates a stable market with consistent demand, despite broader economic factors that may influence housing trends according to Redfin.
Compared to the national median, Oklahoma City’s home prices remain significantly more affordable, making it an attractive option for first-time buyers and those relocating from higher-cost metros.
The slight increase in sale price could also reflect sustained interest in the area, driven by a combination of economic opportunity and quality of life improvements.
Homes Sold
Metric
Value
Growth (YoY)
Number of Homes Sold
798
+12.2%
The number of homes sold increased by 12.2% year-over-year, with 798 homes sold in December 2024 compared to 711 in December 2023. This growth highlights increased buyer activity and strong demand in the housing market.
The rise in sales volume, despite slightly higher median prices and longer selling times, suggests that the market remains attractive to buyers, possibly due to competitive pricing and favorable mortgage rates.
Additionally, this increase could indicate an influx of new residents, particularly as Oklahoma City continues to draw attention from out-of-state buyers.
Median Days on Market
Metric
Value
Growth (YoY)
Median Days on Market
50 days
+16 days
The median days on the market for homes in Oklahoma City increased by 16 days compared to last year, rising from 34 days to 50 days.
This indicates that homes are taking longer to sell, which may suggest a slight cooling of market activity or a shift towards a more balanced market.
While this could reflect seasonal patterns typical of the housing market in late fall and early winter, it might also point to buyers exercising more caution or being more selective.
Sellers may need to adjust expectations and consider strategic pricing to reduce time on the market.
Sale-to-List Price Ratio
Metric
Value
Growth (YoY)
Sale-to-List Price
97.9%
+0.2 pts
The sale-to-list price ratio of 97.9% shows that homes are selling close to their listing prices, with only minor reductions on average.
This slight 0.2-point increase year-over-year indicates that sellers have maintained pricing discipline, and buyers are generally willing to meet these prices.
However, the gap between the list price and the final sale price could reflect a small degree of negotiation as the market transitions from highly competitive to moderately competitive.
Homes Sold Above List Price
Metric
Value
Growth (YoY)
Homes Sold Above List Price
17.7%
-1.7 pts
The percentage of homes sold above the list price declined by 1.7 points year-over-year, indicating slightly reduced competition among buyers. While some homes still attract multiple offers, the trend suggests that bidding wars are becoming less common, allowing buyers more room to negotiate.
This shift could benefit buyers who were previously priced out of the market during peak competition periods, creating opportunities for those seeking homes in a somewhat less aggressive market environment.
Homes with Price Drops
Metric
Value
Growth (YoY)
Homes with Price Drops
25.6%
+6.1 pts
The percentage of homes experiencing price drops increased by 6.1 points year-over-year, reaching 25.6%.
This trend suggests that sellers are becoming more flexible in pricing as homes spend more time on the market. It also indicates that some sellers may have initially overestimated demand or priced homes too high, requiring adjustments to attract buyers.
This rise in price drops is another sign of a transitioning market, where buyers have slightly more leverage than during the peak seller’s market conditions.
Migration & Relocation Trends
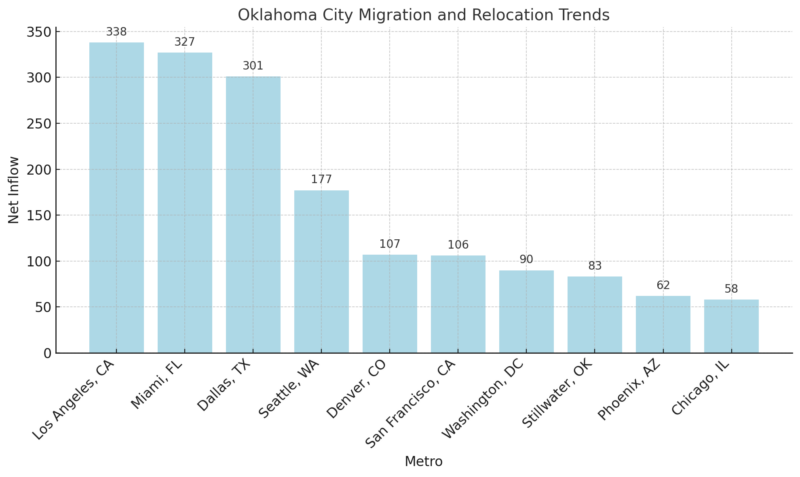
Oklahoma City continues to attract new residents from major metropolitan areas, with the largest inflows coming from Los Angeles (338), Miami (327), and Dallas (301).
This migration trend is likely driven by the city’s affordability compared to these high-cost markets, as well as its strong job market, growing economy, and quality of life improvements.
The influx from tech hubs like San Francisco and Seattle may also indicate a shift towards remote work opportunities, allowing professionals to relocate to more affordable cities while maintaining their careers.
Income Data in Oklahoma City
Metric
Value
Year-over-Year (YoY) Change
Average Household Income
$88,664
+8.2%
Median Household Income
$64,251
+7.7%
Income (Aged 25-44)
$67,060
N/A
Income (Aged 45-64)
$74,337
N/A
Income (Under 25)
$38,753
N/A
Income (65 and Older)
$54,263
N/A
People Below Poverty Level
2
N/A
People Above the Poverty Level
562,130
+1.0%
Point2Homes notes that the average annual household income in Oklahoma City is $88,664, reflecting a healthy increase of 8.2% year-over-year.
The median household income sits at $64,251, also up by 7.7%, indicating improved financial stability for middle-income residents. Income distribution shows higher earnings among individuals aged 45-64 ($74,337), while younger residents (under 25) and those over 65 earn comparatively less, at $38,753 and $54,263 respectively.
The number of people above the poverty level increased by 1.0%, suggesting positive economic growth in the region.
Housing Data in Oklahoma City
Metric
Value
Year-over-Year (YoY) Change
Total Housing Units
298,877
+1.4%
Median Year Built
1981
+0.1%
Owner-Occupied Units
59.52%
N/A
Renter-Occupied Units
40.48%
N/A
Homes with Mortgages
60.71%
N/A
Median Home Value (with Mortgage)
$213,000
N/A
Median Monthly Housing Costs
$1,071
N/A
Oklahoma City has 298,877 housing units, with a slight 1.4% increase year-over-year, reflecting ongoing development in the area. The majority of occupied housing units are owner-occupied (59.52%), while 40.48% are rented.
🗣️ Attention homebuyers 🗣️
With a median home sale price of $213,000, Oklahoma City is one of the top 10 cities to set down your roots, according to @Forbes. https://t.co/0mByldTcDP
— Live In Oklahoma (@liveinokla) December 10, 2024
The median home value for properties with mortgages is $213,000, and average monthly housing costs are $1,071, making Oklahoma City relatively affordable compared to national averages.
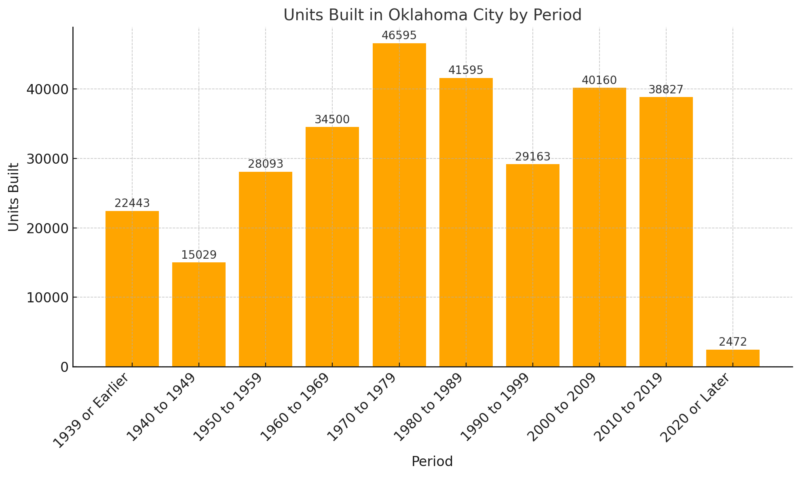
The housing stock is diverse, with a median construction year of 1981. Recent housing developments have been robust, with a significant 163.3% increase in homes built after 2020.
Homes built between 2010 and 2019 saw notable growth (9.9%), while older housing stocks, particularly from before 1959, showed slight declines.
This trend suggests a focus on modernizing and expanding the housing infrastructure to meet growing demand.
Educational Attainment in Oklahoma City, Oklahoma
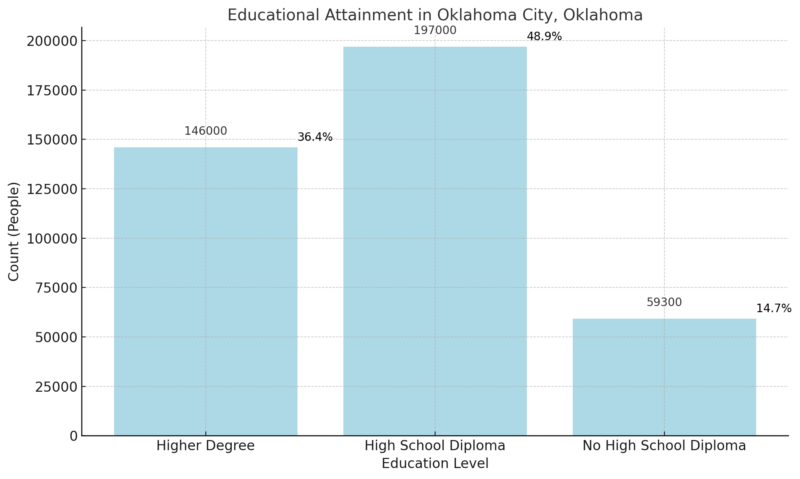
Statistical Atlas notes that among adults aged 25 years and older in Oklahoma City, nearly half (48.9%) have attained a high school diploma as their highest level of education, while 36.4% have pursued post-secondary degrees.
Only 14.7% of the population lacks a high school diploma, reflecting a generally educated workforce with opportunities for further skill development.
Relative Educational Attainment (Compared to Oklahoma Statewide)
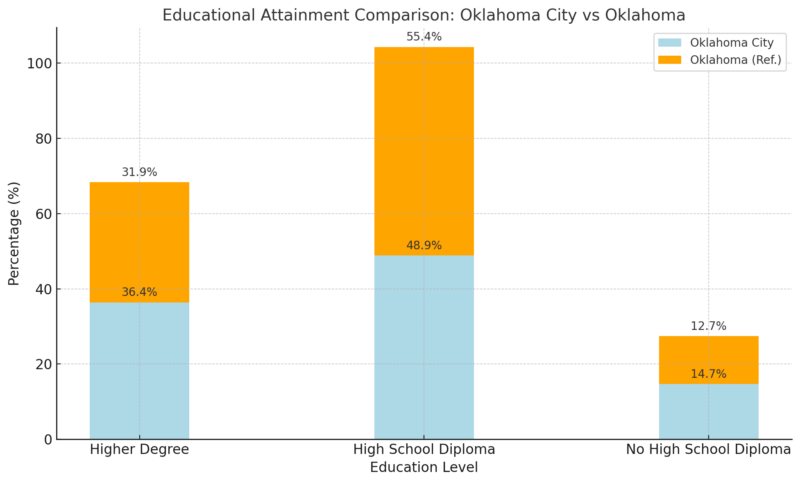
When compared to the state of Oklahoma as a whole, Oklahoma City stands out with a higher proportion of residents holding post-secondary degrees (+14.1%). This suggests that Oklahoma City serves as an educational hub within the state, potentially due to its access to universities, colleges, and other higher education resources.
However, the city has a slightly higher percentage of individuals without a high school diploma (+15.7%) than the statewide average, which could highlight specific areas for educational improvement.
Methodology
- Data was collected from reliable sources like the U.S. Census Bureau, World Population Review, and Redfin.
- Key metrics such as population, income, housing, and education were analyzed for trends and year-over-year changes.
- Comparisons were drawn between Oklahoma City, the state of Oklahoma, and national averages to highlight relative performance.
- Labor market data was reviewed to assess employment trends and economic stability in 2024.
- Migration patterns were studied using inflow and outflow data from major U.S. metropolitan areas.
- Insights were synthesized into concise takeaways to provide a comprehensive overview of Oklahoma City’s demographics and economy.
References
- Oklahoma City Population Data – World Population Review
- Metro Area Growth Trends – Macrotrends
- Age Distribution in Oklahoma City – Neilsberg Insights
- Ethnic Composition Statistics – Best Neighborhood
- Labor Force Data for Oklahoma City – Bureau of Labor Statistics (BLS)
- Oklahoma City Housing Market Trends – Redfin
- Income and Housing Data in Oklahoma City – Point2Homes
- Educational Attainment in Oklahoma City – Statistical Atlas
- City Comparison – Las Vegas Visitor Volume Trends
- Migration Insights – San Francisco Population Loss
- Migration Trends to Oklahoma City – Seattle Population Trends
Related Posts:
- Oklahoma Population in 2025 - Demographics and Trends
- Houston Population 2025 - Growth Trends and Projections
- Jacksonville Population 2025 - Growth Trends and Projections
- Columbus Population 2025 - Growth Trends and Projections
- Portland, OR Population 2025 - Growth Trends and Projections
- Nashville Population 2025 - Growth and Future Projections


