Oklahoma’s population in 2025 is estimated to be 4,088,380, reflecting steady growth over the years according to the World Population Review.
This places Oklahoma on the verge of surpassing the significant milestone of 4.1 million residents.
The state’s growth rate is currently 0.84%, ranking it 24th in the nation for population growth.
The state ranks as the 35th most densely populated in the United States, with an average of 54.7 people per square mile, spanning a total area of 69,898 square miles.
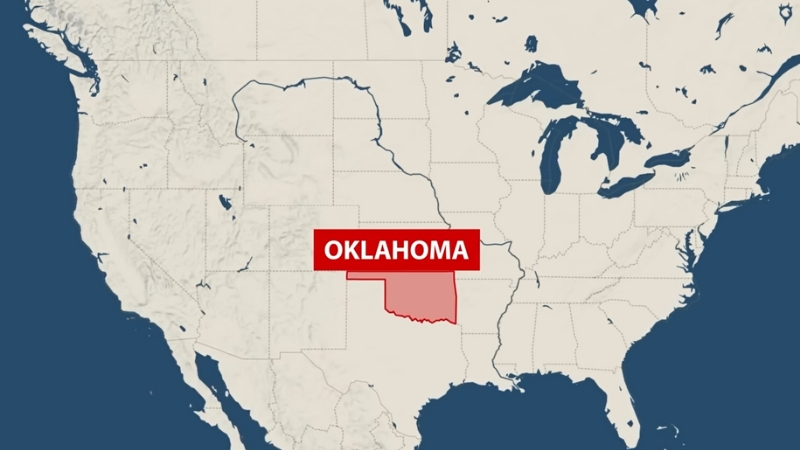
Oklahoma shares its borders with six states: Texas to the south and west, Arkansas and Missouri to the east, Kansas to the north, Colorado to the northwest and New Mexico at its western tip.
These neighboring states, along with Oklahoma’s strong community and economic foundations, contribute to the region’s dynamic population trends.
Table of Contents
ToggleKey Takeaways
Age and Sex Distribution
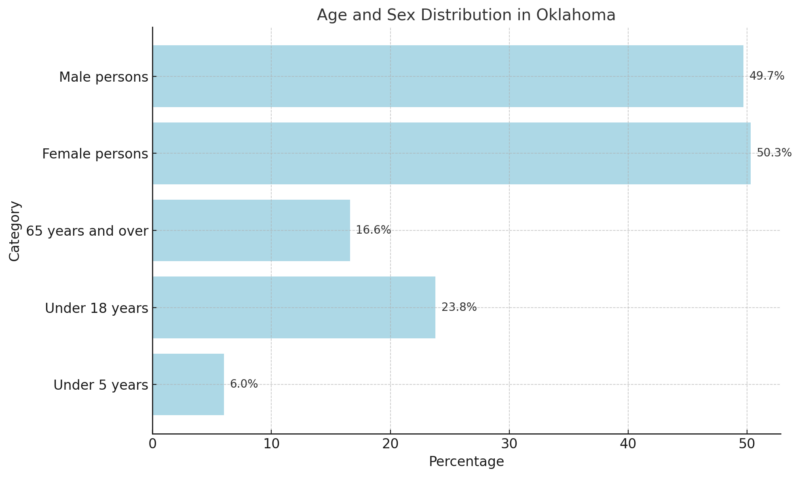
The population distribution shows a balanced gender ratio with females slightly outnumbering males (50.3% vs. 49.7%).
Approximately 29.8% of the population is composed of children under 18 years, suggesting a strong youth demographic.
Meanwhile, the older population (65 years and over) comprises 16.6%, indicating an aging trend alongside a younger generation according to the U.S Census Bureau.
Race and Hispanic Origin
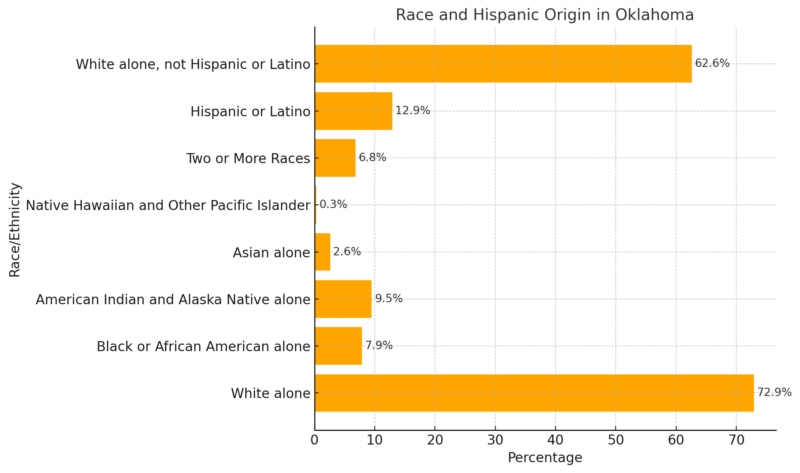
The racial composition of Oklahoma is predominantly White (72.9%), with a diverse mix of minority groups.
The significant Hispanic or Latino population (12.9%) and American Indian and Alaska Native population (9.5%) reflect the state’s cultural and historical diversity.
The presence of multiple ethnic groups enhances Oklahoma’s social and cultural fabric.
Population Characteristics
Characteristic
Value
Veterans (2018-2022)
254,405
Foreign-born persons (2018-2022)
6.1%
Oklahoma has a substantial number of veterans (254,405), reflecting a strong connection to military service.
The foreign-born population, constituting 6.1%, adds to the state’s demographic diversity and highlights the role of immigration in shaping its cultural and economic landscape.
Counties By Population 2025
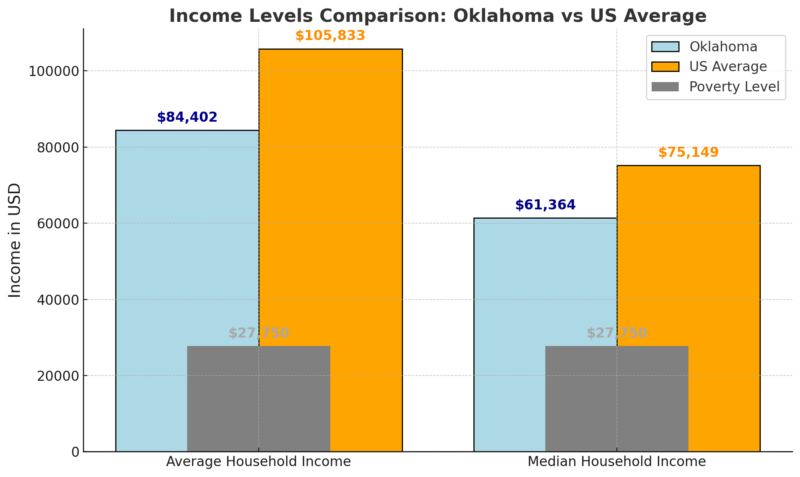
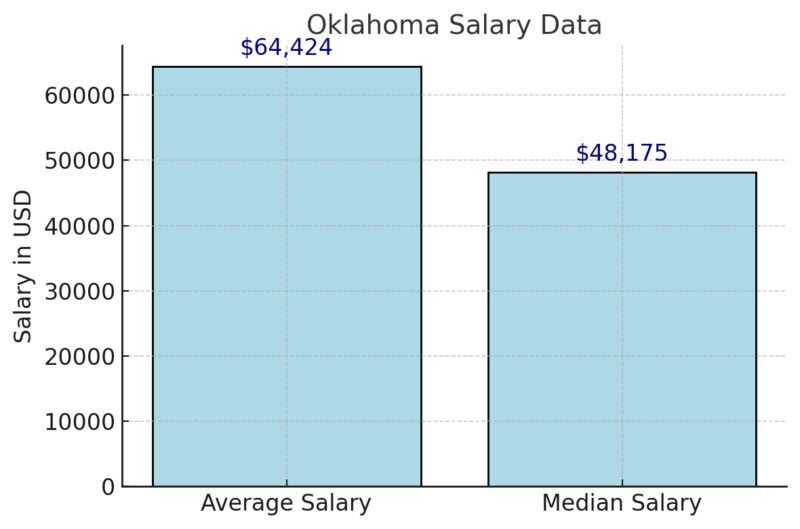
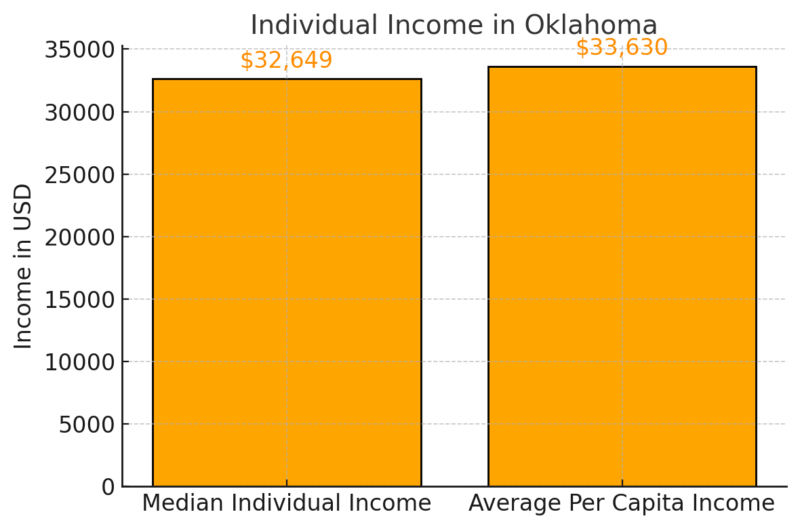
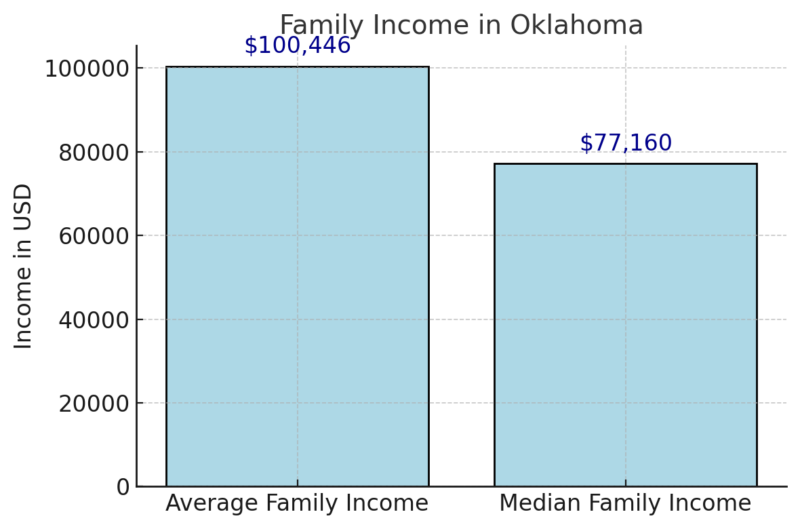
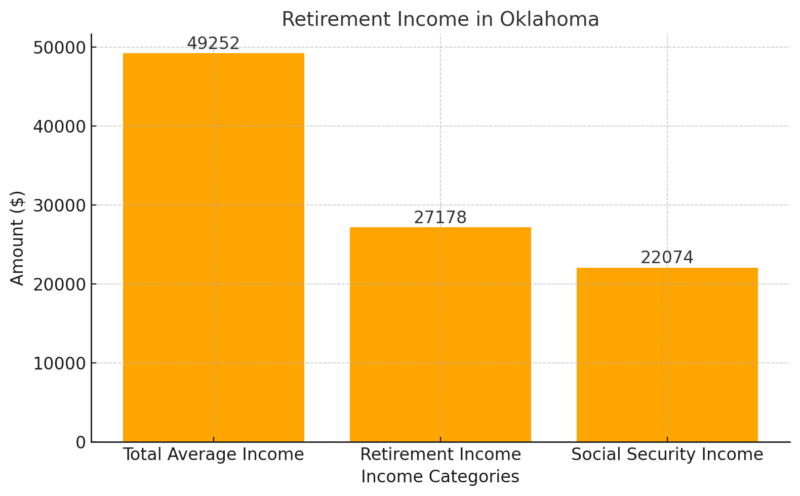
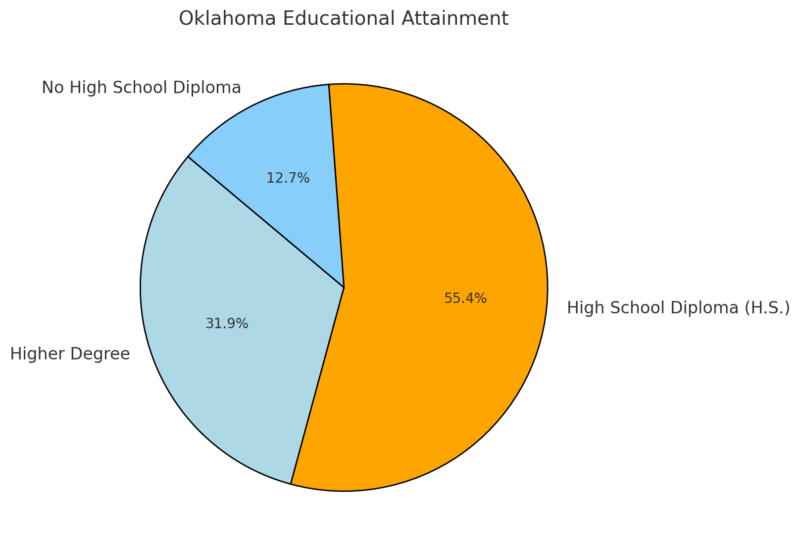
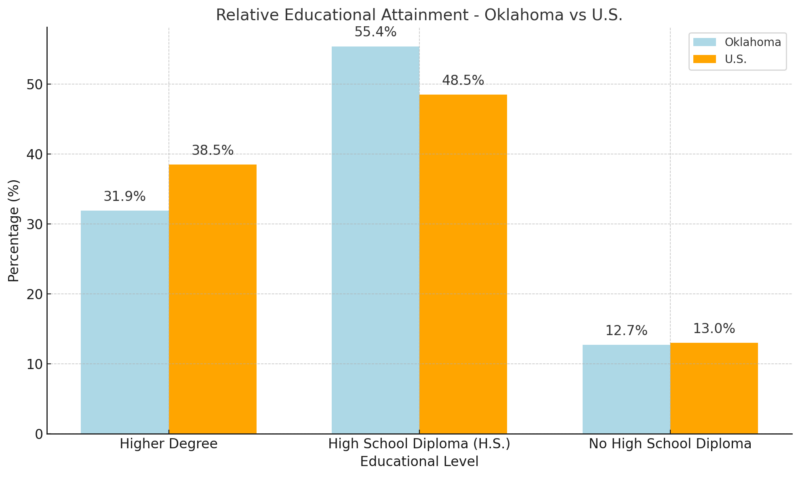
WPR notes that Oklahoma has 77 counties, with Oklahoma County being the most populated at 792,582 residents, showing a 9.96% growth since 2010. Other highly populated counties include Tulsa (648,360), Cleveland (281,669), Canada (144,447), and Comanche (120,422). Canadian County experienced the highest growth rate at 24.16%, while Comanche County saw a decline of 3.97%. The least populated county is Cimarron, with 2,153 residents and a 12.8% decline since 2010. Other sparsely populated counties with fewer than 5,000 residents include Harmon, Roger Mills, Harper, Ellis, Grant, and Dewey. Harper County showed slight growth at 2.7%. Canadian County leads in growth rate (24.16%), followed by McClain (15.11%), Logan (12.45%), and Bryan (10.82%). Cimarron County experienced the largest population decrease. Footnotes: (1) Number of persons, in thousands, seasonally adjusted. (2) In percent, seasonally adjusted. Oklahoma unemployment rate dips to 3.5% in Marchhttps://t.co/QgDQs6n6D0 — KOKH FOX 25 (@OKCFOX) April 19, 2024 Oklahoma’s average and median household incomes are significantly lower than the national averages, by 20% and 18%, respectively according to the Income By Zip Code. This highlights an income disparity between Oklahoma residents and the broader U.S. population. However, the figures remain well above the federal poverty level, indicating a general baseline of economic stability. The wealthiest zip codes in Oklahoma, led by 73025, demonstrate significantly high incomes, with the top zip code averaging $232,751 in household income. These areas reflect concentrated wealth in certain parts of the state, such as the Oklahoma City and Tulsa metropolitan areas. Median household incomes in these regions also remain considerably high, underscoring economic prosperity in these locales. The average salary for full-time workers in Oklahoma is $64,424, while the median is lower at $48,175. This difference indicates the presence of a higher income disparity, where a few high earners significantly pull up the average, leaving the median as a more representative figure for typical workers. Individual income data reflects modest earning levels in Oklahoma, with the average per capita income only slightly above the median individual income. This suggests a relatively equitable distribution of individual earnings among residents, though both figures are lower than household or family income, as they do not include combined earnings. Family incomes in Oklahoma are notably higher than individual or household incomes, reflecting the combined earning power of multiple earners within family units. The average family income surpasses $100,000, indicating strong economic contributions from families, while the median remains below this threshold, signaling income variation among family units. Retirement income in Oklahoma reflects moderate financial stability for retirees, with a significant portion coming from Social Security payments. Combined, these sources provide an average total retirement income of nearly $50,000, ensuring basic economic security for many retirees in the state. The majority of Oklahoma’s population aged 25 and older (55.4%) have a high school diploma as their highest level of education. About 31.9% have achieved a higher (post-secondary) degree, while 12.7% lack a high school diploma as per Statistical Atlas. These statistics show a significant proportion of the population achieving at least a basic education, although there is room for growth in post-secondary attainment. Compared to the U.S. average, Oklahoma has a lower percentage of residents with post-secondary (higher) degrees, at 31.9% compared to the national average of 38.5%, representing a -17.2% difference. However, Oklahoma exceeds the national average for residents with a high school diploma as their highest education level (55.4% vs. 48.5%). The percentage of people without a high school diploma in Oklahoma is slightly lower than the national rate, showing some parity in foundational education levels.
County
Population
Growth Rate (%)
Area (sq mi)
Population Density (per sq mi)
Oklahoma County
814,629
2.05%
274
1,149
Tulsa County
688,675
2.68%
220
1,208
Cleveland County
302,902
2.25%
208
562
Canadian County
182,404
17.35%
346
203
Comanche County
120,923
-0.17%
413
113
Rogers County
101,436
6.34%
261
150
Wagoner County
91,863
12.88%
217
163
Payne County
84,003
2.88%
264
123
Pottawatomie County
74,231
2.30%
304
94
Creek County
73,978
2.97%
367
78
Muskogee County
67,047
1.21%
313
83
Garfield County
62,095
-0.95%
409
59
Grady County
58,102
5.87%
425
53
Washington County
54,174
2.96%
161
130
Logan County
54,134
8.84%
287
73
Le Flore County
50,190
4.14%
613
32
Bryan County
49,896
7.70%
349
55
Carter County
48,856
1.69%
317
59
McClain County
48,734
16.27%
220
85
Cherokee County
48,296
2.55%
289
64
Osage County
46,408
1.36%
867
21
Stephens County
44,412
3.71%
336
51
Kay County
43,544
-0.13%
355
47
Pittsburg County
43,482
-0.70%
504
33
Delaware County
41,926
3.80%
285
57
Sequoyah County
40,781
3.88%
260
61
Mayes County
40,208
2.94%
253
61
Pontotoc County
38,760
1.75%
278
54
Okmulgee County
37,059
1.00%
269
53
Lincoln County
34,990
4.45%
367
37
McCurtain County
30,547
-0.99%
714
17
Ottawa County
30,245
0.08%
182
64
Custer County
28,493
0.15%
382
29
Caddo County
26,191
-2.67%
493
20
Garvin County
25,959
1.22%
310
32
Jackson County
24,679
-0.27%
310
31
Seminole County
23,666
0.63%
244
37
Beckham County
22,108
-1.01%
348
25
Texas County
20,237
-4.94%
788
10
Woodward County
19,879
-2.61%
480
16
McIntosh County
19,803
4.50%
239
32
Adair County
19,738
1.45%
222
34
Pawnee County
16,047
3.15%
219
28
Marshall County
16,019
4.43%
143
43
Kingfisher County
15,734
3.66%
347
18
Craig County
14,812
4.75%
294
19
Atoka County
14,723
3.94%
376
15
Choctaw County
14,145
-0.42%
297
18
Murray County
13,827
-0.35%
161
33
Hughes County
13,438
0.69%
310
17
Haskell County
11,997
3.87%
223
21
Okfuskee County
11,373
0.93%
239
18
Pushmataha County
10,891
0.92%
539
8
Noble County
10,819
-0.99%
283
15
Washita County
10,736
-1.53%
387
11
Love County
10,418
2.56%
198
20
Johnston County
10,086
-1.59%
248
16
Latimer County
9,496
0.18%
279
13
Nowata County
9,463
1.53%
218
17
Blaine County
8,633
-0.78%
358
9
Woods County
8,526
-0.84%
496
7
Kiowa County
8,316
-2.18%
392
8
Major County
7,626
-1.55%
369
8
Tillman County
6,767
-2.59%
336
8
Alfalfa County
5,657
-0.95%
335
7
Cotton County
5,405
-2.35%
244
9
Greer County
5,386
-1.93%
247
8
Jefferson County
5,286
-0.68%
293
7
Coal County
5,241
-0.72%
200
10
Beaver County
5,017
-0.26%
701
3
Dewey County
4,168
-6.86%
386
4
Grant County
4,044
-3.25%
386
4
Ellis County
3,613
-3.37%
475
3
Roger Mills County
3,253
-5.13%
440
3
Harper County
3,215
-1.14%
401
3
Harmon County
2,368
-4.36%
207
4
Cimarron County
2,149
-6.12%
708
1
Employment Rates and Job Openings
Data Series
May 2024
June 2024
July 2024
Aug 2024
Sept 2024
Oct 2024 (p)
Civilian Labor Force (1)
1,992.0
1,992.7
1,994.0
1,995.6
1,998.8
1,998.6
Employment (1)
1,922.7
1,924.0
1,924.9
1,927.1
1,930.4
1,931.8
Unemployment (1)
69.3
68.6
69.1
68.6
68.4
66.8
Unemployment Rate (2)
3.5%
3.4%
3.5%
3.4%
3.4%
3.3%
Metric
Value
Notes
Job Openings Level
7,744,000 (p)
Seasonally adjusted
Hires Rate
3.3% (p)
Seasonally adjusted
Total Separations Rate
3.3% (p)
Seasonally adjusted
Income Levels
Richest Zip Codes in Oklahoma
Rank
Zip Code
Population
Mean Income
Median Household Income
1
73025
16,620
$232,751
$171,171
2
73151
2,198
$218,221
$159,853
3
73116
9,932
$174,743
$82,060
4
74114
16,969
$158,773
$90,282
5
73173
4,241
$153,043
$133,822
6
73007
2,357
$152,950
$117,396
7
74137
28,577
$150,000
$99,497
8
73131
3,392
$149,949
$116,081
9
73165
8,263
$148,170
$126,128
10
73034
46,751
$146,320
$106,367
Salary Data
Individual Income
Family Income
Retirement Income
Educational Attainment
Relative Educational Attainment Compared to U.S.
Health and Welfare
Oklahoma’s healthcare system includes various crucial statistics for its population.
The state’s healthcare framework features systems like the Oklahoma Health Care Information System (HCI), which collects and processes vital health data, such as hospital discharges and outpatient procedures.
The state’s fertility rate is 60.4 births per 1,000 women aged 15-44. Additionally, the teen birth rate stands at 21.2 births per 1,000 females aged 15-19, reflecting important demographic aspects.
Medicaid services are provided through programs like SoonerCare, which regularly publishes statistics about its enrolled healthcare providers and pharmacy usage. As of November 25, 2024, these programs continue to support various health initiatives, including dental care and pharmacy access.
These initiatives reveal the state’s commitment to improving health outcomes and accessibility for its residents by leveraging comprehensive data analysis and targeted health service programs.
Migration Patterns
Metric
Value
Net Population Growth (2022-2023)
+34,553 people
Domestic Migration (2022-2023)
+23,587 people
Total Population Growth (2020-2023)
+94,413 people
Domestic Migration (2020-2023)
+80,064 people
States with Higher Domestic Migration
9 (AL, AZ, FL, GA, ID, NC, SC, TN, TX)
Major Domestic Migration States Losing Population
CA (-1.1M), IL (-364K), NY (-882K)
Oklahoma has emerged as one of the top 10 states in domestic migration, adding over 80,000 residents from other states since 2020. This counters criticism of recent conservative policies, as U.S. Census data shows net positive migration into Oklahoma according to OCPA.
Compared to high outmigration in states like California, Illinois, New York, or Florida, Oklahoma’s policy-driven environment and programs like universal school choice appear to attract residents seeking new opportunities.
Reducing the state’s income tax could further enhance its appeal, competing with states like Texas and Florida that lack personal income taxes.
Metric
Value
Total Immigrant Population (2018)
236,882 (6% of total population)
Gender Distribution
Women: 107,582; Men: 112,178; Children: 17,122
Native-Born with Immigrant Parent
246,550 (6% of population)
Top Countries of Origin
Mexico (45%), Vietnam (5%), India (5%), Germany (3%), Guatemala (3%)
Naturalized Immigrants
88,485 (37% of immigrants)
Eligible for Naturalization (2017)
41,672
Undocumented Immigrants (2016)
85,000 (38% of the immigrant population; 2% of the total state population)
DACA Recipients
Active: 6,110; Total Granted: 7,490
Oklahoma’s immigrant population is a small but integral part of the state’s demographic makeup, with a significant share originating from Mexico.
Many immigrants have achieved naturalization, and a substantial portion of undocumented residents live with U.S. citizen family members, emphasizing mixed-status households’ prevalence.
Deferred Action for Childhood Arrivals (DACA) recipients represent a smaller group but remain vital to the community.
Education
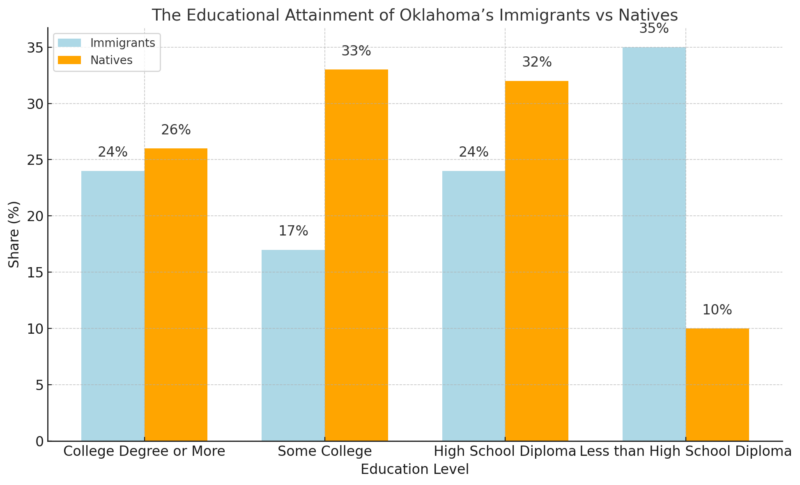
The educational attainment of Oklahoma’s immigrants shows a mix of high achievers with college degrees (24%) and a significant portion lacking high school diplomas (35%) according to the American Immigration Council.
This contrasts with native residents, who have a higher representation in higher education and fewer individuals without high school diplomas, indicating opportunities for educational improvement among the immigrant population.
Economic Contributions
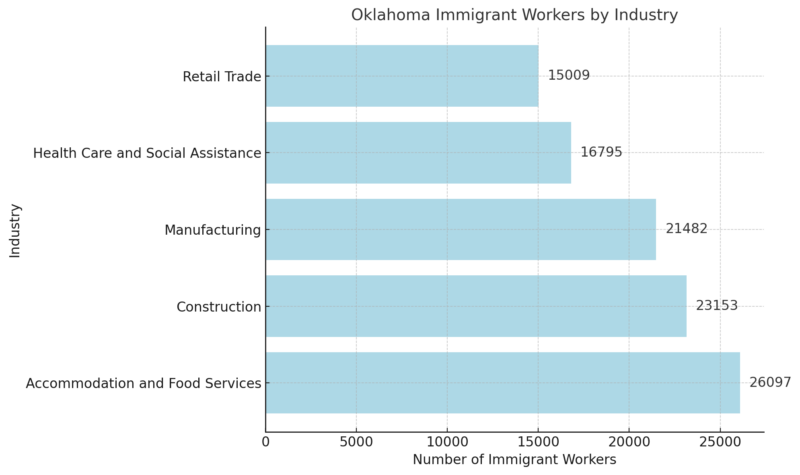
Immigrant workers play a crucial role in Oklahoma’s labor force, comprising 8% of all workers and representing significant portions of key industries.
They are particularly prominent in the accommodation, construction, manufacturing, and healthcare sectors, showcasing their importance in maintaining the state’s economic stability.
Labor Force and Family Statistics
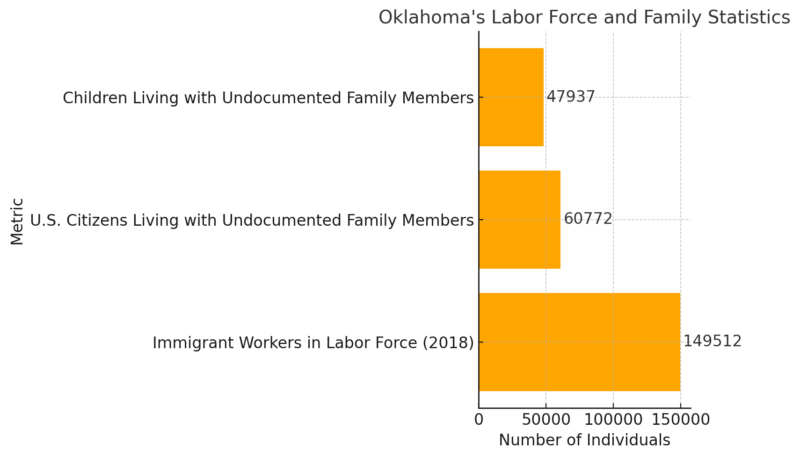
One in 12 workers in Oklahoma is an immigrant, underscoring their vital role in the economy.
Many immigrants also contribute as family members and neighbors, with mixed-status households highlighting the complex dynamics of immigration in Oklahoma.
These contributions benefit all Oklahomans through labor, taxes, and cultural diversity.
Housing Market
Metric
Value
Year-over-Year Growth
Median Sale Price
$244,400
+3.4%
Number of Homes Sold
3,883
+4.6%
Median Days on Market
40 days
+11 days
The Oklahoma housing market is experiencing modest growth, with home prices rising by 3.4% year-over-year to a median sale price of $244,400 as per Redfin notes.
The number of homes sold increased by 4.6%, indicating healthy buyer activity. However, the median days on the market rose by 11 days, suggesting homes are taking longer to sell compared to last year.
Top 10 Metros with Fastest Growing Sale Prices
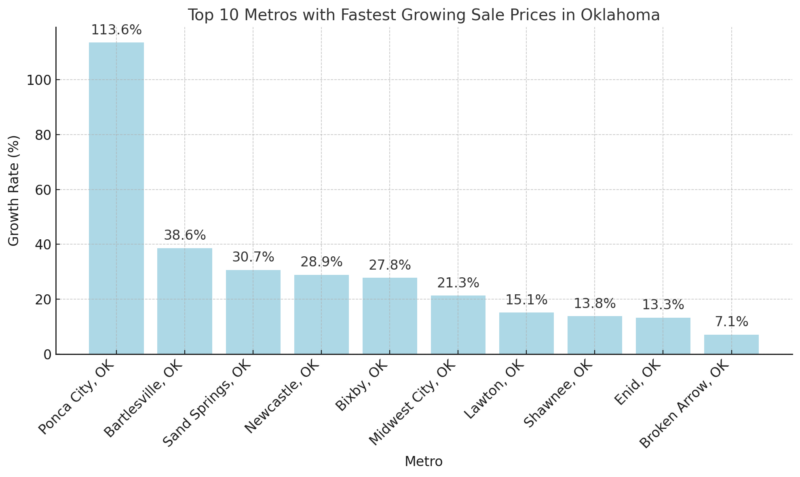
Ponca City leads the state with an extraordinary 113.6% year-over-year growth in home sale prices, far surpassing other metros.
Cities like Bartlesville (38.6%) and Sand Springs (30.7%) also show significant growth, reflecting increased demand and potentially low housing supply in these areas.
This trend highlights varying regional dynamics within Oklahoma’s housing market.
Housing Supply Statistics
Metric
Value
Year-over-Year Growth
Number of Homes for Sale
18,818
+19.9%
Number of Newly Listed Homes
4,914
+7.3%
Months of Supply
4 months
No change
Housing supply has increased notably, with a 19.9% rise in homes for sale, totaling 18,818.
This growing inventory provides more options for buyers, although it could also reflect slower market activity with homes staying on the market longer.
Newly listed homes rose by 7.3%, which may help balance supply and demand.
Despite these changes, the months of supply remain stable at 4 months, indicating a balanced market.
Methodology
This article was crafted using a systematic research approach, leveraging credible data sources such as the U.S. Census Bureau, American Community Survey, and Redfin reports.
We analyzed population demographics, economic metrics, and housing trends through statistical insights.
Additional context was provided by policy analyses and historical data comparisons to highlight migration patterns and economic contributions.
Each data point was corroborated to ensure accuracy, with contextual summaries offering a clear narrative about Oklahoma’s growth, challenges, and opportunities.
References
- Oklahoma Population 2024 – World Population Review
- U.S. Census QuickFacts: Oklahoma – U.S. Census Bureau
- BLS Local Area Unemployment Statistics: Oklahoma – Bureau of Labor Statistics
- Redfin Oklahoma Housing Market – Redfin
- Oklahoma Income Statistics – Income by Zip Code
- Oklahoma Education Statistics – Statistical Atlas
- American Immigration Council: Immigrants in Oklahoma – American Immigration Council
- OCPA Migration Report: Oklahoma Domestic Migration – Oklahoma Council of Public Affairs
- Oklahoma Health Care Information System – Oklahoma Health Department
- SoonerCare Program – Oklahoma Health Care Authority
- CDC Oklahoma Fertility Statistics – CDC National Center for Health Statistics
- World Population Review: Oklahoma Counties – World Population Revie


