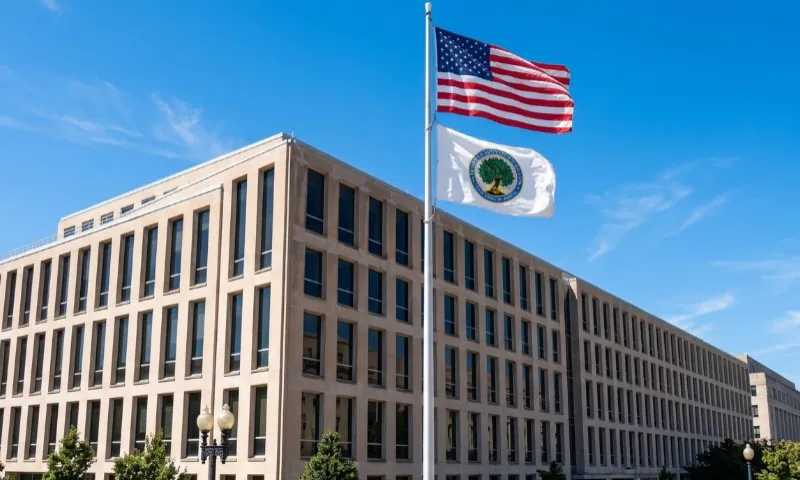

Pittsburgh has an estimated population of 307,668, according to the latest completed city estimate from the U.S. Census Bureau. The figure represents an increase of 4,697 residents, or 1.6%, from the city’s official 2020 census count of 302,971.
The figure is the latest official estimate available in 2026. The Census Bureau has released 2025 estimates for counties and metropolitan areas, but its latest completed estimate for Pittsburgh itself remains dated July 1, 2024.
The city’s recent growth stands in contrast with the surrounding region. Allegheny County had an estimated 1,225,035 residents in 2025, down about 25,500 from the 2020 census. The Pittsburgh metropolitan area had approximately 2.422 million residents in 2025, down more than 33,000 from its revised 2020 estimate.
Pittsburgh is therefore gaining residents inside the city boundary even as the wider region continues to contract. That split is one of the most important facts behind the latest Pittsburgh population figures.
Key Pittsburgh Population Figures for 2026
| Measure | Latest Population | Change Since 2020 |
|---|---|---|
| Pittsburgh city | 307,668 | Up 4,697, or 1.6% |
| Allegheny County | 1,225,035 | Down 25,543, or 2.0% |
| Pittsburgh metro area | 2,421,992 | Down 33,201, or 1.4% |
The metro figure comes from the Census Bureau’s 2025 metropolitan estimates and is also tracked through the Federal Reserve Bank of St. Louis. Estimates published by World Population Review provide another current reference, although official Census figures remain the strongest source for comparing years.
The difference between the city and metro trends also explains why claims that “Pittsburgh is growing” or “Pittsburgh is losing population” can both appear in current reporting. The answer depends on the geographic area being measured.
1. Pittsburgh Population Trends Since 1950
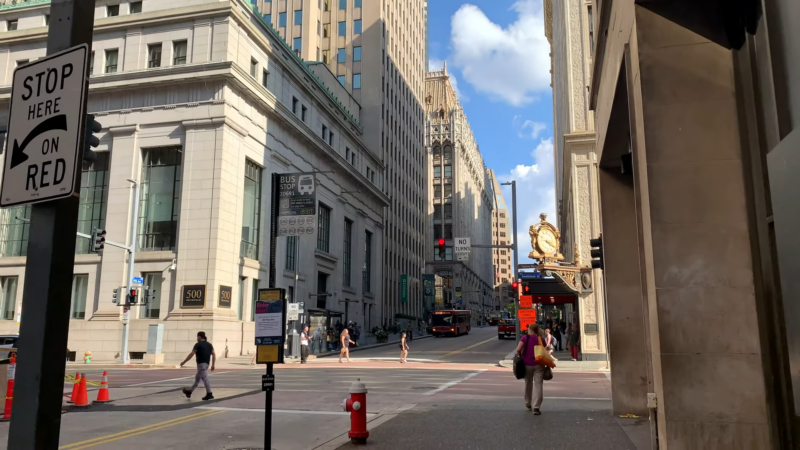
Pittsburgh remains far smaller than it was during the height of the steel industry. The city reached 676,806 residents in 1950, more than twice its current population.
Suburbanization, industrial decline and the collapse of heavy manufacturing drove a long period of population loss. The city fell to 334,563 residents by 2000, 305,704 by 2010 and 302,971 by 2020.
The latest estimate of 307,668 marks a change in direction rather than a return to rapid growth. Pittsburgh has added residents since 2020, but its population remains about 8% below the 2000 count and about 55% below the 1950 peak.
| Year | Pittsburgh Population | Change From Previous Period |
|---|---|---|
| 1950 | 676,806 | Historic peak |
| 2000 | 334,563 | Down 342,243 from 1950 |
| 2010 | 305,704 | Down 8.6% |
| 2020 | 302,971 | Down 0.9% |
| 2024 estimate | 307,668 | Up 1.6% |
Older year-by-year estimates remain available through historical Pittsburgh population data. Annual estimates are revised whenever the Census Bureau releases a new vintage, so figures from older articles may differ slightly from the current series.
2. The City Is Growing While Allegheny County Is Shrinking
Pittsburgh’s recent increase has not reversed the decline across Allegheny County.
The county had 1,250,578 residents at the 2020 census and an estimated 1,225,035 in 2025. That represents a loss of about 25,500 people in five years.
The Pittsburgh metro area followed the same direction. Its population declined from a revised 2.455 million in 2020 to 2.422 million in 2025.
The result is a sharper divide between the central city and the region around it. Pittsburgh added residents, but the gains were not large enough to offset losses elsewhere in the metropolitan area.
Previous regional analysis connected much of the decline to natural decrease, with deaths outnumbering births, along with domestic out-migration. International arrivals offset part of that loss.
The Allegheny Institute’s examination of regional population change provides additional detail on those pressures.
Butler County has remained one of the stronger performers in the region, showing that population change is not distributed evenly across western Pennsylvania. Some residents are also moving between the central city, older suburbs and faster-growing outer counties rather than leaving the region entirely.
3. Pittsburgh’s Current Demographic Profile
The latest Census figures show that 62.7% of Pittsburgh residents identify as White alone and 22.3% as Black or African American alone.
Asian residents account for 6.2% of the population, while 6.8% identify with two or more races. Hispanic or Latino residents, who may belong to any racial group, represent 4.5%.
The demographic profile of Pittsburgh also reflects the influence of universities, hospitals and research employers. Young adults make up a visible share of the population, although the region outside the city is considerably older.
| Population Group | Share of Pittsburgh Residents |
|---|---|
| White alone | 62.7% |
| Black or African American alone | 22.3% |
| Asian alone | 6.2% |
| Two or more races | 6.8% |
| Hispanic or Latino | 4.5% |
| Foreign-born | 9.5% |
Age Profile
Children under 18 account for 14.6% of Pittsburgh’s population, while residents aged 65 and older represent 15.6%.
Those percentages are close, but their effects on city services are different. A smaller child population affects school enrollment and family housing demand. A substantial older population increases demand for accessible homes, health services and reliable public transportation.
Sex Ratio
Women account for 51.3% of Pittsburgh residents. Men account for the remaining 48.7%, producing a relatively even population split.
4. Veteran Population
The Census Bureau estimates that Pittsburgh is home to 11,540 veterans. That city figure should not be confused with the much larger number for the entire metropolitan area.
The wider Pittsburgh metropolitan veteran population includes residents across several counties. Allegheny County alone has an estimated 57,630 veterans.
The distinction between city and metro data matters throughout population reporting. A regional total cannot be used as though it describes people living inside Pittsburgh’s city limits.
5. Migration Is Reshaping the City and Region
Pittsburgh’s population gain since 2020 is significant because it follows decades of decline. The city added nearly 4,700 residents while Allegheny County lost more than 25,500.
International migration has become increasingly important in a region where an older population produces more deaths than births. New arrivals also support universities, hospitals, technology companies, restaurants and small businesses.
Domestic movement remains a challenge. Some graduates leave after completing college, families move to suburban school districts and workers relocate to faster-growing regions. Housing costs, property taxes, employment options and neighborhood conditions all influence those decisions.
Earlier reports found that regional population losses could reduce the available workforce and weaken business investment. That concern remains relevant, but the city’s new growth means the picture is no longer one of uniform decline. The broader economic effects are discussed in regional reporting from PA Town Hall.
6. Housing Costs and Population Growth
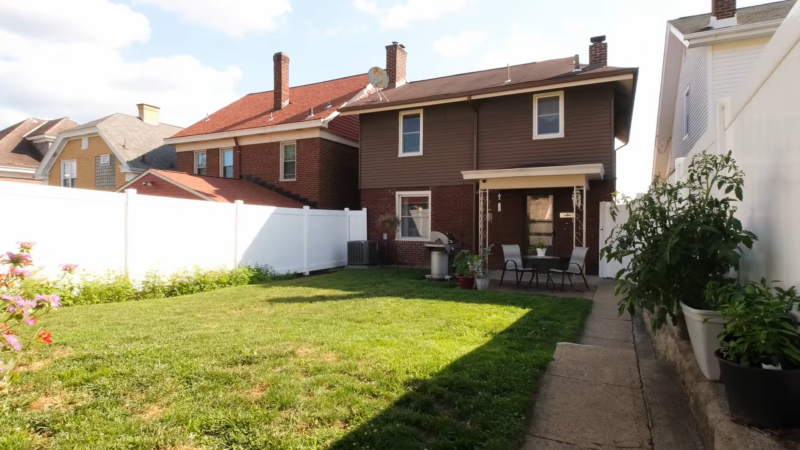
Pittsburgh’s relative affordability remains one of its strongest advantages. Census data place the median value of owner-occupied housing at $205,800 for the 2020-2024 period, with median gross rent at $1,261.
More recent market data show higher asking prices. In June 2026, the median Pittsburgh listing price was approximately $270,000, while the median sold price was $290,000. The median asking rent was about $1,500 a month.
About 47.7% of occupied housing units are owner-occupied. That rate is low compared with Allegheny County as a whole, reflecting the city’s large student population, apartment stock and renter-heavy neighborhoods.
Conditions differ widely across the city. Homes in high-demand Pittsburgh neighborhoods such as Squirrel Hill can cost far more than properties in parts of the North Side, South Side or eastern neighborhoods.
Additional market analysis from Norada Real Estate Investments and neighborhood income estimates from Point2Homes provide further comparisons, although listing data change from month to month.
7. Income, Employment and Poverty
Pittsburgh’s median household income is $65,742, measured in 2024 dollars. Per capita income stands at $45,385.
The city’s poverty rate is 20.1%, considerably higher than the statewide rate. The older claim that Pittsburgh’s poverty rate was 11.8% understated conditions inside the city and more closely resembled a broader regional or state measure.
The gap between the city’s educated workforce and its poverty rate is one of Pittsburgh’s central economic contradictions. Universities, hospitals and technology employers support well-paid professional jobs, but many households remain disconnected from that growth.
Employment
The Pittsburgh metropolitan unemployment rate stood at 3.8% in May 2026, according to the latest available regional unemployment figures.
The metro area supported approximately 1.21 million nonfarm jobs in June 2026. Education and health services remained the largest major sector, with about 267,100 jobs. Trade, transportation and utilities employed about 206,300, while professional and business services accounted for roughly 187,400.
Pittsburgh’s shift away from steel is now firmly established. Health care, higher education, robotics, artificial intelligence, financial services and advanced manufacturing are central to the current economy.
Those industries help attract young professionals, but population growth depends on more than job creation. Workers also consider housing, schools, transportation, public safety and the ability of a partner to find employment.
8. Educational Attainment
Among Pittsburgh residents aged 25 and older, 94.4% have completed high school and 49.1% hold at least a bachelor’s degree.
The bachelor’s degree rate is supported by major institutions such as the University of Pittsburgh, Carnegie Mellon University, Duquesne University and several smaller colleges.
Educational attainment is not equal across all communities. Longstanding racial and neighborhood gaps affect access to advanced courses, college completion and high-paying employment.
Compared with Philadelphia’s population and education profile, Pittsburgh has a smaller population but a higher concentration of college graduates inside the city boundary.
Education also has a clear connection with earnings. Workers with bachelor’s and graduate degrees generally earn substantially more than those with only a high school diploma. The value of those credentials still depends on occupation, experience and access to the strongest parts of the regional labor market.
9. Policies That Could Shape Pittsburgh’s Population
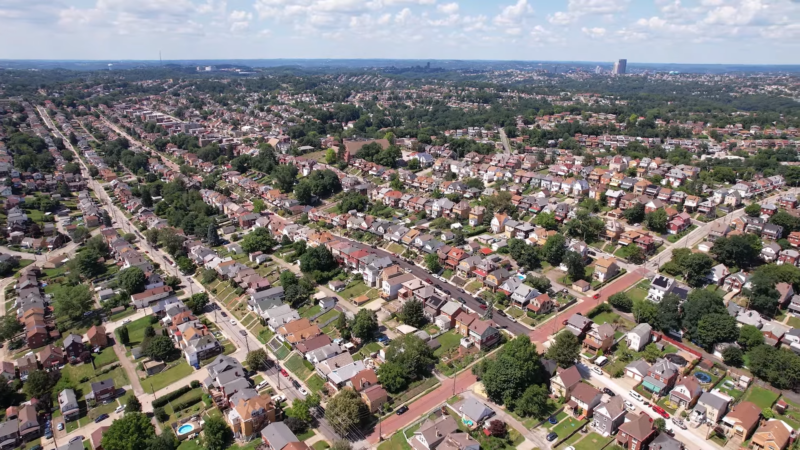
Pittsburgh’s recent growth does not remove the long-term pressures facing the city and surrounding counties.
Population policy now centers on several connected issues:
- Housing construction: Pittsburgh needs enough homes in areas close to employment, universities and public transportation. Limited supply can raise prices even in a city that remains affordable by national standards.
- Vacant property: Abandoned buildings and tax-delinquent parcels reduce neighborhood stability but also create opportunities for new housing when title and financing problems are resolved.
- Graduate retention: Universities bring thousands of young adults into Pittsburgh each year. The city benefits only when enough graduates find jobs and remain after completing their studies.
- International migration: New arrivals offset natural population decline and contribute to the workforce, schools and small-business economy.
- Regional employment: Initiatives such as Pittsburgh Works Together focus on business investment and job creation across western Pennsylvania.
- Affordable housing: Local debates continue over zoning, publicly owned land, subsidies and the barriers to building affordable homes.
Population growth is strongest when residents can connect housing with stable employment and essential services. A city can attract people through jobs and universities but still lose them when housing, transportation or family needs are not met.
10. Pittsburgh Population Projections
Earlier projections expected Pittsburgh to reach 307,422 residents by 2025 and 310,533 by 2030. The city’s official 2024 estimate of 307,668 already moved slightly above that projected 2025 figure.
The original population projection therefore appears conservative in the short term. It does not guarantee that growth will continue at the same rate through 2030.
The wider region faces a more difficult outlook. Allegheny County and the metro area continued to lose residents through 2025, and the aging population will keep natural decrease near the center of regional planning.
Forecasts from Pennsylvania population models point to slow growth or continued decline across many parts of the state rather than the rapid expansion seen in the South and West.
Pittsburgh’s next population milestone is 310,000. Reaching it will depend on maintaining international migration, retaining university graduates, adding housing and extending the city’s recent gains beyond a few strong years.
What Pittsburgh’s Population Numbers Show
Pittsburgh entered 2026 in a stronger demographic position than it held at the start of the decade. The city has 307,668 residents, its highest official estimate in years, and has gained 1.6% since the 2020 census.
The recovery remains local rather than regional. Allegheny County has lost 2% of its population since 2020, and the metropolitan area has fallen to about 2.422 million residents.
That contrast will define the next phase of Pittsburgh’s population story. The city has interrupted its long decline, but the wider region still needs more births, new arrivals and retained workers to achieve sustained growth.
Methodology
The city population figure uses the U.S. Census Bureau’s latest completed municipal estimate, dated July 1, 2024. County and metropolitan totals use Vintage 2025 estimates released in 2026.
Demographic, housing, income, education and poverty figures come from Census QuickFacts and the 2020-2024 American Community Survey. Monthly employment figures come from the U.S. Bureau of Labor Statistics.
Housing-market figures describe active listings and completed sales in June 2026. They are not directly comparable with Census estimates of owner-occupied home values because the two sources measure different groups of properties.
References
- U.S. Census Bureau – Pittsburgh City QuickFacts
- World Population Review – Pittsburgh Population
- Homebuyers of Pittsburgh – Pittsburgh Real Estate Market
- Norada – Pittsburgh Housing Market Trends
- Realtor.com – Pittsburgh Housing Market
- PA Town Hall – Pittsburgh Region Population Decline
- Allegheny Institute – Pittsburgh Area Population Change
- Data USA – Pittsburgh Demographics
- Census Reporter – Pittsburgh Metro Area
- Neilsberg – Pittsburgh Population by Year
- Aterio – Pennsylvania Population Projections
- Statista – Pennsylvania Poverty Rate
- YCharts – Pittsburgh Unemployment Rate