The United States is undergoing a significant demographic shift toward an older society.
A decade ago, seniors accounted for 13% of the population.
Currently, that figure has risen to 16%, and projections from the Pew Research Center indicate it will reach 22% by 2050.
At present, there are 45% more children under 18 than individuals aged 65 and older.
However, this balance is set to reverse well before 2050, with older adults surpassing children in number.
Additionally, the population of those aged 85 and above is expected to more than double, growing to two and a half times its current size.
Table of Contents
ToggleDemographic Transformations
Metric
Today
2050 Projection
Elderly Population Share
16%
22%
Adults 85+
6.9 million
17.5 million (2.5x growth)
Child-to-Elder Ratio
45% more children than elderly
The elderly will outnumber the children
Non-Hispanic White Share
Majority
Declining, minority-majority shift
Immigrant Contribution
26% of population
34% of population
According to Census Bureau projections, the number of non-Hispanic whites is expected to decline, while the African American population will grow by approximately 30%.
The Hispanic population is anticipated to increase by 60%, and the Asian American population is set to more than double.
Currently, immigrants and their children make up 26% of the U.S. population.
By 2050, this share is projected to rise to 34%, though this increase depends largely on future U.S. immigration policies.
Without sustained immigration, population growth would stagnate, as the number of births would nearly equal the number of deaths, leaving little natural growth.
U.S Population Becoming More Diverse
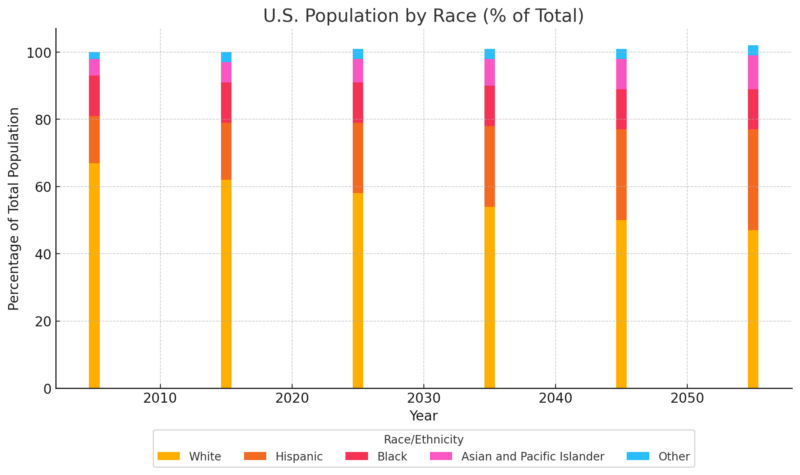
The U.S. population is undergoing a significant transformation that will have profound implications for its social, economic, and political landscape.
By 2050, changes in racial composition and workforce dynamics will redefine what it means to live in the United States.
Economic forces, such as workforce productivity and the allocation of resources, will play a crucial role in determining living standards.
The proportion of non-Hispanic whites is steadily decreasing, from 67% in 2005 to an expected 47% by 2055.
This decline highlights the shift towards a minority-majority society.
The Hispanic population is projected to rise significantly, growing from 14% in 2005 to 30% in 2055.
The Asian American population is expected to double, increasing from 5% in 2005 to 10% by 2055.
The share of African Americans remains relatively constant at around 12% over the projection period.
A small but consistent growth in the “Other” category underscores the increasing diversity of racial and ethnic identities.
Without Immigration Population Will Barely Grow
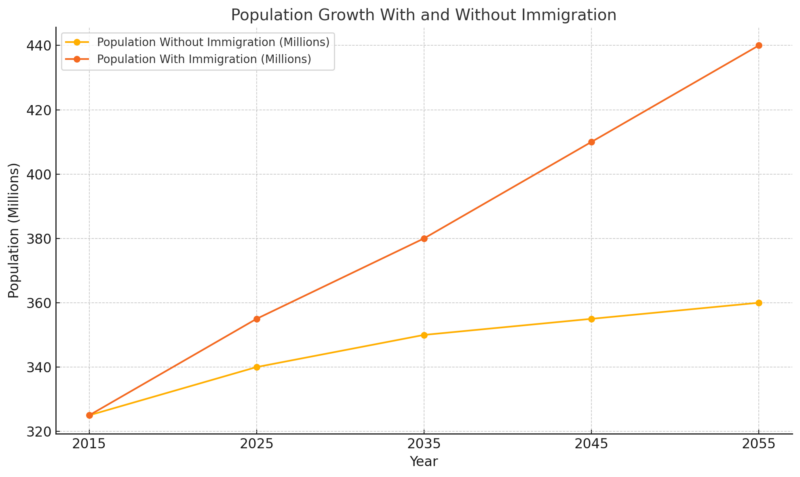
Without continued immigration, the population grows marginally, reaching only 360 million by 2055 according to the United Nations.
However, with sustained immigration, the population significantly increases to 440 million over the same period.
This comparison highlights the crucial role of immigration in sustaining population growth and economic dynamism.
Immigration not only contributes to demographic expansion but also supports labor force growth, which is essential for funding programs such as Social Security and Medicare.
Without this influx, the U.S. risks stagnation, as the natural population growth (births minus deaths) slows.
The data underscores that a steady flow of immigrants is necessary to maintain economic vitality in the face of an aging population.
The Future of the U.S. Labor Force
Factor
Current Status
Key Trend
Fertility Rate
1.8 children per woman (2017)
Declining since the Great Recession
Delayed Parenthood
Rising age of first-time mothers
Women report intentions for 2+ children but delay
Immigration Share
14% of U.S. population
Key driver of 55% of growth since 1965
Immigration Sources
Dominated by Mexico historically
Shift toward Asian immigrants since 2009
Future Growth Risks
Declining fertility among immigrants
Less impact from high-fertility countries
The size and composition of the U.S. labor force in the future will be shaped by fertility rates and immigration.
Our World Data notes that historically, the U.S. has maintained higher fertility rates than other developed nations, with an average of over 2 children per woman from 1990 to 2007.
However, since the Great Recession, fertility has steadily declined, reaching a historic low of 1.8 children per woman in 2017.
Researchers suggest that this decline may stem from economic and societal shifts, as well as changes in family planning preferences.
Women today are having children later in life, with many reporting intentions to have more than two children.
However, fertility intentions among younger women, particularly among Hispanic, Black, and foreign-born populations, have declined.
It’s important to realize that immigration has been the wellspring of innovation and economic growth over the entire history of the U.S. and well back into European history. “American Ingenuity” is heavily a story of immigration. @WhoIsDit @mmuthukrishna https://t.co/HfYF3XJpIx
— Joe Henrich (@JoHenrich) November 9, 2024
Immigration has been a critical driver of U.S. population growth since 1965 according to the studies.
Immigrants currently make up 14% of the population, compared to 5% in 1965, and account for 55% of total population growth since then.
Fertility among immigrants has historically been higher than that of native-born women.
However, declines in immigration from traditionally high-fertility countries and reduced fertility in those nations may limit future population growth through immigration.
The origins of immigrants have also shifted over time, with more arriving from Asia than Latin America since 2009.
Immigration Is A Key Driver of U.S. Population Growth
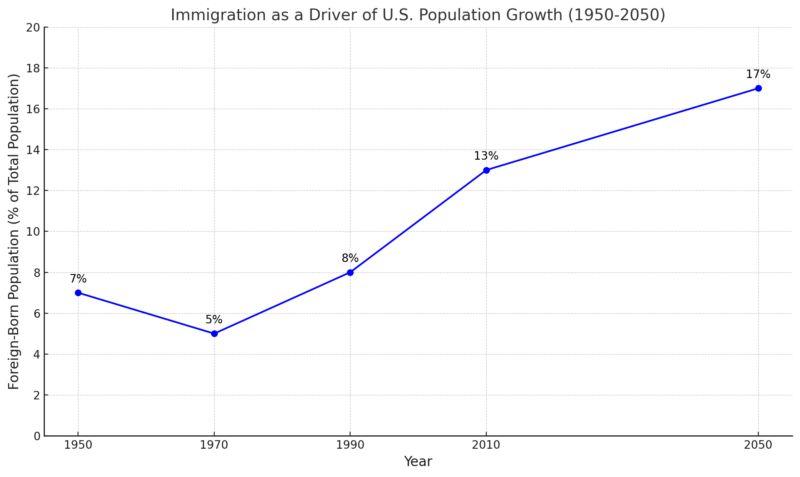
Immigration has become a significant contributor to U.S. population growth, with foreign-born individuals now accounting for a rising share of the total population.
Paw Research Center notes that this share has grown from approximately 5% in 1970 to over 13% today and is projected to reach 17% by 2050.
The composition of immigrant flows has shifted over time, reflecting both global economic changes and U.S. immigration policies.
For example, immigration from India and China increased in the 1990s due to the H1-B visa program, which prioritized high-skilled workers according to ILO.
Conversely, immigration from Mexico slowed after 2000 due to heightened border enforcement following 9/11 and changes in economic demand.
Immigrants often take roles as either low-wage, less-skilled workers or high-wage, highly skilled professionals, leaving a gap in middle-income roles.
Research indicates that immigration slightly reduces wages for low-wage native workers but increases wages for higher-income native workers, as skilled immigrants complement rather than compete with domestic talent.
Despite public debate, immigration has played a minimal role in widening income inequality, with its effects more nuanced and sector-specific.
Will You Be Ready for the Jobs of 2050?
Key Factor
Current Status
Future Challenges and Trends
Education Levels
10% have two-year degrees; ~35% hold four-year degrees
Non-white college graduation rates must increase to sustain growth.
Workforce Composition
Whites and Asians more likely to have bachelor’s degrees than Blacks or Hispanics
A growing non-white workforce risks lower educational attainment overall.
Automation Impact
Minimal effect over the last 15 years
Likely to displace low-paying, automatable jobs in the next two decades.
African American Women
Concentrated in low-wage, low-skill jobs
At higher risk due to automation and lack of training.
Policy Recommendations
Encourage education and training programs
Expand retraining and college access for vulnerable groups.
The job market in 2050 will demand a more educated workforce, leaving less-educated workers increasingly vulnerable.
The divide between high- and low-paying jobs has grown, fueled by factors such as globalization, automation, and a rising demand for skills outpacing supply.
Today, only 10% of U.S. adults have two-year college degrees, and just over a third hold four-year degrees.
Whites and Asian Americans are more likely to have bachelor’s degrees than Blacks or Hispanics, and these disparities persist.
Harry Holzer of Georgetown University projects that slower population growth combined with a rising non-white share of the workforce—groups with historically lower college attendance rates—could reduce the overall percentage of college-educated workers.
Without increased access to education for minorities, the share of adults with four-year degrees may fall by 2.3 percentage points by 2050 as per census.gov.
Policies encouraging workforce participation and training, such as paid family leave and tax incentives, could help mitigate these effects.
Automation will further reshape the labor market, requiring workers to adapt quickly.
Alternative staffing arrangements may benefit some workers by offering flexibility but could reduce wages and training opportunities for others.
Vulnerable groups, particularly African American women, will face significant challenges as they disproportionately work in low-paying, automatable jobs.
Without retraining programs and expanded educational access, these workers risk being left behind in a rapidly evolving economy.
The Care Crisis
Key Factor
Today
2050 Projections
Unpaid Caregivers
10 million Americans provide unpaid care
Demand for care will triple, doubling lost wages to ~$135 billion annually.
Elder-to-Caregiver Ratio
1-to-7
Shifts to 1-to-3, driving demand for institutional care.
Institutional Care Demand
Moderate
3.3 times today’s levels, driven by lower fertility and an aging population.
Foreign-Born Caregivers
8% of elder-care workforce
This will increase to 12%, requiring 2.2 million additional workers.
Most Demanded Jobs
Nursing and caregiving roles critical
Nurses will be among the most sought-after professions.
Chronic Disease Costs
High, due to untreated conditions
Preventing hypertension alone could save $3.5 trillion.
The aging of the Baby Boom Generation (born 1946–1964) and increasing life expectancy are driving a surge in the number of elderly people requiring care.
Currently, 10 million Americans aged 65 and older rely on unpaid caregivers, a figure expected to rise dramatically by 2050 according to NBER.
This growing need for care has significant economic consequences, as caregivers often leave paid employment or reduce their working hours.
Studies estimate caregivers today forgo $67 billion annually in wages, a figure projected to more than double by mid-century.
The burden of caregiving disproportionately affects college-educated minorities, who experience greater declines in labor force participation.
By 2050, the ratio of individuals over 85 to those in prime caregiving years (ages 45–64) will shift from 1-to-7 to 1-to-3, driving a 3.3-fold increase in the demand for institutional care as noted in research by Family Caregiver Alliance.

Declining fertility rates, which lower the average number of children available to provide care, will further exacerbate this trend.
Immigrants will play a crucial role in filling caregiving jobs, with the share of the workforce in elder-care roles projected to grow from 8% today to 12% by 2050, requiring 2.2 million additional foreign-born workers.
Among caregiving roles, nursing will become one of the most in-demand professions, given the increasing reliance on skilled caregivers to manage the complex healthcare needs of an aging population.
Preventive healthcare could alleviate some of the caregiving burden.
Eliminating chronic conditions like hypertension could save the government $3.5 trillion between 2018 and 2050 by reducing disability-related costs.
However, even perfect disease prevention cannot fully address the strain on federal healthcare programs like Medicare and Medicaid, underscoring the need for a sustainable long-term care strategy.
Challenges and Inequalities in the Golden Years
Factor
Current Situation
Future Projections (2050)
Millennials
More educated but affected by Great Recession
Likely to save less due to delayed wealth-building.
Racial Wealth Gap
Black households’ net worth $124K less than Whites
Likely to widen, reducing retirement readiness.
Gig Economy’s Impact
Fewer retirement benefits
Greater reliance on Social Security and personal savings.
Educational Disparities
Non-college grads struggle to save for retirement
Inequality in retirement income persists.
Social Security Dependence
Essential for low-income retirees
Rising reliance among low-income groups.
Middle-Class Fragility
~30% struggle with emergency savings
Increased vulnerability to financial shocks.
Financing the retirement of the growing elderly population will be a significant challenge for both individuals and the federal government.
Millennials, nearing retirement by 2050, face financial headwinds despite being more educated and potentially earning higher wages.
Many entered the workforce during the Great Recession, delaying wealth-building milestones like homeownership and retirement savings.
Furthermore, the gig economy’s lack of robust retirement benefits shifts the burden of saving entirely to individuals.
Racial wealth disparities exacerbate the issue, with Black households having far less retirement savings than White households, even when controlling for education and income.
By 2050, disparities in retirement income will persist, particularly among non-college-educated workers, minorities, and those with lower lifetime earnings.
Social Security provides some equity, but those with less education and lower earnings still depend more on Medicare and disability benefits.
Policymakers must address wage inequality, expand access to employer-sponsored retirement plans, and promote financial literacy to mitigate these challenges.
For middle-income households, the lack of precautionary savings leaves many vulnerable to financial shocks, highlighting the need for better incentives to save for emergencies and retirement.
Methodology
This article was created by analyzing comprehensive research on U.S. demographic, economic, and social trends projected through 2050.
Key data from sources like the Census Bureau, Pew Research Center, and academic studies were synthesized to highlight major shifts in population aging, diversity, and workforce dynamics.
Tables and charts were developed to present complex findings on immigration, fertility, caregiving, and retirement in a clear and concise format.
Overall, it combines data-driven insights with accessible language to inform readers about the future challenges and opportunities facing the U.S.
Summary
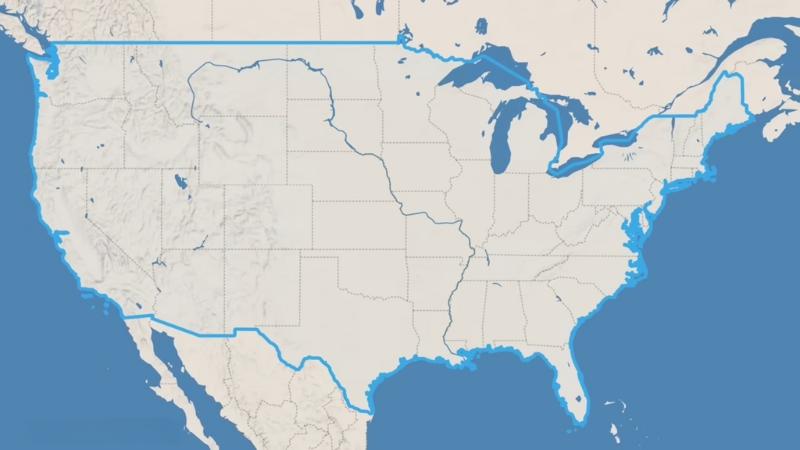
The United States is experiencing profound demographic shifts, with an aging population, declining fertility rates, and increasing racial and ethnic diversity.
By 2050, older adults will outnumber children, and immigrants will play a critical role in sustaining population and labor force growth.
Automation and globalization are reshaping the job market, demanding a more educated workforce and leaving less-educated workers, particularly minorities, at greater risk.
The growing elderly population will significantly increase the need for caregiving, with nursing and elder-care roles becoming some of the most in-demand professions.
Financing retirement for a rapidly aging population will pose major challenges, as disparities in wealth, education, and access to retirement savings persist, particularly among minorities and gig economy workers.
To ensure economic stability and social equity, policymakers must prioritize investments in education, healthcare, immigration, and retirement support systems.
References
- Pew Research Center – US Centenarian Population Is Projected to Quadruple Over the Next 30 Years
- United Nations – Immigration and Population Growth
- Social Security Administration – Assistance Programs: Social Security and Medicare
- Our World in Data – Fertility Rate Trends
- National Bureau of Economic Research (NBER) – How Does Caregiving Affect Labor Supply?
- Family Caregiver Alliance – Baby Boom and the Growing Care Gap
- College Transitions – Percentage of Americans With College Degrees
- Census Bureau – Educational Attainment in the United States
- Pew Research Center – Immigration’s Impact on Past and Future U.S. Population Change
- International Labour Organization (ILO) – Skilled Immigration Trends
- PubMed Central (PMC) – The Economic Impact of Hypertension Prevention
Related Posts:
- New York’s Population Could Drop by Almost 3 Million by 2050
- Cancer Deaths Could Nearly Double by 2050 If the…
- Scientists Uncover 580,000-Year Climate Record That…
- How IQ Is Measured Today: What Modern Intelligence…
- Oregon’s Population Is Rising, but The Pace Has…
- How Common Are Hazel Eyes Compared to Other Eye Colors?


