

The average age at first marriage in the United States has reached an all-time high. According to the latest data from Statista and the U.S. Census Bureau, the average age of marriage in the U.S. stands at 32 years old.
This average has remained stable since 2023 and reflects a broader social trend that has steadily evolved over the past 70 years. In 2023, Census data reported a median age of first marriage at 30.2 for men and 28.4 for women, a dramatic rise from the 22.5 for men and 20.1 for women recorded in the 1950s.
This shift isn’t limited to age alone. It reflects changing societal expectations, financial realities, and evolving values about relationships, careers, and life milestones.
Across all U.S. states and regions, people are delaying marriage longer than ever, and in some places, especially in the Northeast and West, couples are waiting well into their mid-thirties before tying the knot.
How Marriage Age Has Changed Since 1950
Marriage ages in the U.S. have been on an upward trajectory since the post-WWII period. Here’s how the median age of first marriage has shifted over time:
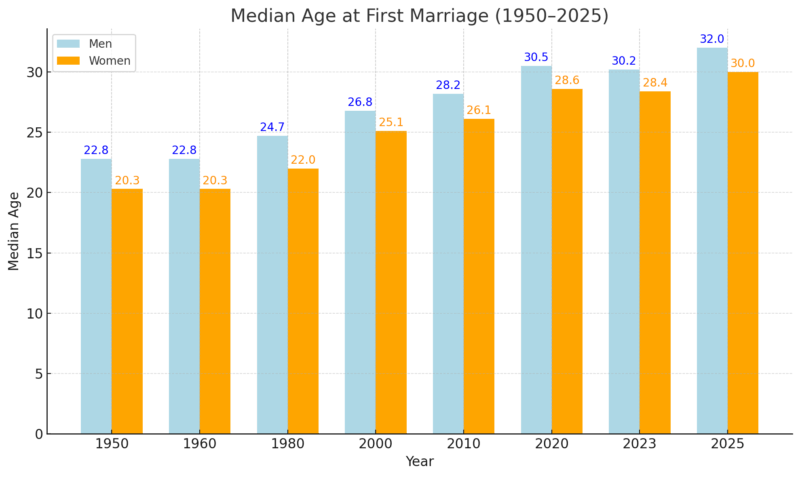
These numbers reveal the growing trend of postponing marriage, with an increasing gap between entering adulthood and committing to a legal partnership.
Gender Breakdown: Men Still Marry Later Than Women
Across every state and census cohort in the United States, the consistent pattern remains: men continue to marry later in life than women.
As of 2023, the median age for men entering their first marriage was 30.2 years, while for women, it was 28.4, according to USA Facts. This 1.8-year gender gap has held steady for decades and shows no signs of closing significantly, even as both figures continue to rise.
The gender difference in marriage timing reflects a combination of biological, cultural, and economic influences. From a developmental standpoint, men and women tend to mature socially and emotionally at slightly different rates.
Additionally, many men take longer to achieve financial or career stability, which they often view as prerequisites for marriage. Women, meanwhile, may feel societal pressure to marry earlier, particularly in certain regions or cultural contexts, though this has also been changing over time.
A closer look at state-level data illustrates how this pattern plays out across the country. In Utah, for example, where cultural emphasis on early marriage remains strong, the median age at first marriage is the lowest for both genders, 26.8 for men and 25.2 for women.
On the opposite end, men in Hawaii wait the longest to marry, with a median age of 32.5, while women marry the latest in Washington, DC, at 31.7.
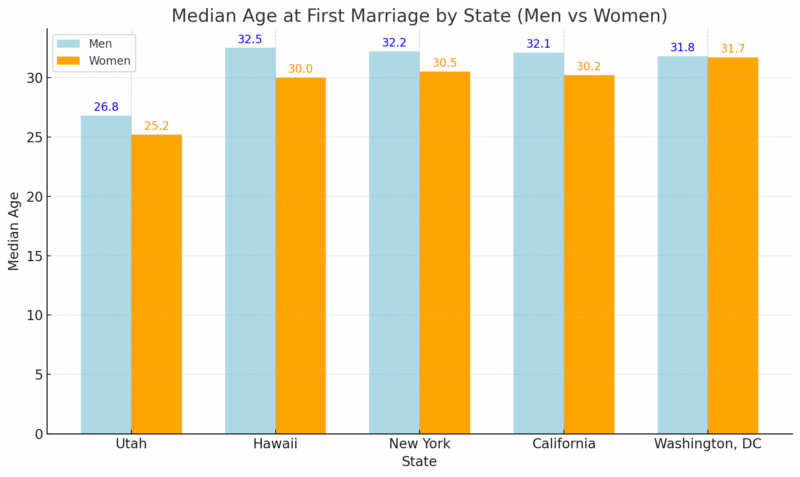
In nearly every state, women marry younger than men, with gaps typically ranging from 1.5 to 2.5 years. However, the trend line for both groups is unmistakably upward. Census notes that in 2003, the national medians were 27.1 for men and 25.3 for women. By 2013, they had climbed to 29.0 and 26.6, respectively.
This trajectory reflects broader cultural shifts: more people now pursue higher education, delay family formation, and seek personal and financial security before entering legal unions.
Another factor shaping this gendered delay is the changing perception of marriage itself. Increasingly, marriage is seen not as a social necessity but as a personal milestone, one that people want to reach on their terms.
Both men and women are taking more time to define their goals, stabilize their careers, and reflect on long-term compatibility before choosing a partner. As a result, the average age of marriage continues to rise across all demographics, but men remain more likely to postpone the step than women.
Regional Trends, Where People Marry the Oldest and Youngest
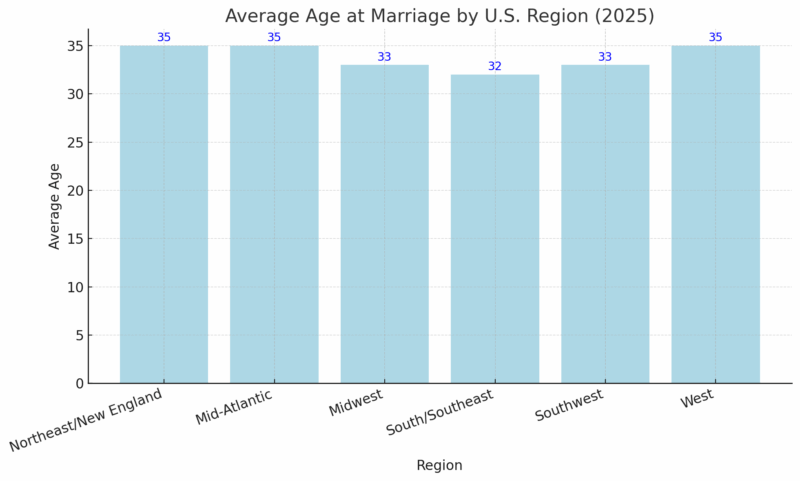
The average age of marriage also varies sharply by region, with significant differences between the Northeast, South, Midwest, and West. These variations are not incidental; they reflect broader regional norms, economic conditions, levels of education, and prevailing attitudes toward family formation.
As of 2025, the average age of marriage is highest in the Northeast, the Mid-Atlantic, and the West, where the average marrying age reaches 35 years. In contrast, people in the South and Southeast tend to marry earlier, with average ages closer to 32. The Midwest and Southwest sit in the middle, typically around 33.
These numbers align closely with patterns in education, urbanization, and income. Northeastern states like Massachusetts, Connecticut, and New York have among the highest rates of college-educated residents in the country.
Higher education is strongly associated with later marriage, as many individuals prioritize degrees, career establishment, and financial independence before marrying.
In contrast, Southern states, such as Alabama, Arkansas, and Mississippi, tend to have younger marriage ages. Here, traditional values, religious influence, and family-centered social norms still play a stronger role.
Cultural emphasis on earlier marriage, particularly among religious communities, remains a powerful factor even as national trends shift.
Urbanization is another contributing factor. Heavily urban regions such as the Northeast and the West Coast not only offer more career opportunities and social freedom but also higher living costs, noted by OECD.
Young adults in cities like New York, San Francisco, and Boston often face economic pressures that delay major life milestones, including marriage. These delays are not simply by preference but also by circumstance: the high cost of housing, student debt, and long career-building periods all contribute.
State-by-State Marriage Age in 2025
Here is a comprehensive breakdown of the average age of marriage by state, as reported in 2025:
State
Average Age
Alabama
29
Alaska
31
Arizona
32
Arkansas
29
California
34
Colorado
33
Connecticut
34
Delaware
35
DC
35
Florida
33
Georgia
31
Hawaii
32
Idaho
30
Illinois
32
Indiana
30
Iowa
30
Kansas
29
Kentucky
30
Louisiana
33
Maine
30
Maryland
34
Massachusetts
33
Michigan
31
Minnesota
30
Mississippi
31
Missouri
31
Montana
29
Nebraska
29
Nevada
34
New Hampshire
32
New Jersey
34
New Mexico
34
New York
33
North Carolina
32
North Dakota
30
Ohio
31
Oklahoma
30
Oregon
33
Pennsylvania
32
Rhode Island
33
South Carolina
31
South Dakota
29
Tennessee
30
Texas
31
Utah
28
Vermont
33
Virginia
32
Washington
33
West Virginia
30
Wisconsin
32
Wyoming
30
Marriage and Divorce Rates by State
Marriage and divorce patterns across the United States reveal strong correlations with age, regional culture, and population mobility. According to the U.S. Census Bureau, these rates are measured by the number of marriages and divorces per 1,000 women aged 15 and older.
The resulting figures highlight how different states experience family formation and dissolution at significantly varied levels.
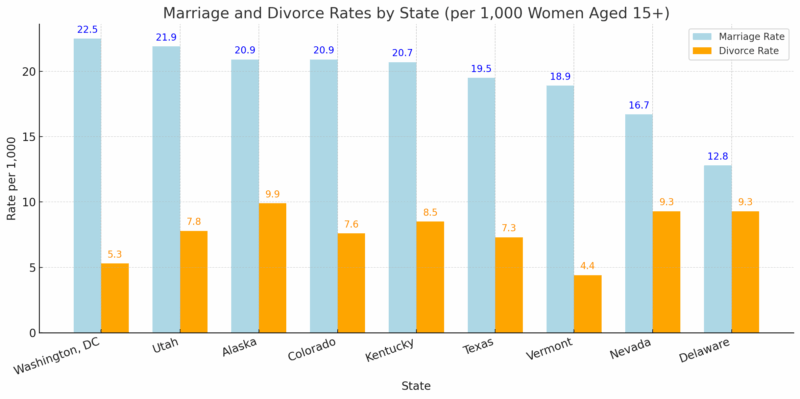
High marriage rates are most commonly found in states with younger populations and stronger cultural or religious emphasis on early family life. Utah and Alaska exemplify this trend. Both have some of the highest marriage rates in the country, paired with elevated divorce rates.
This likely reflects a combination of early marriage norms and demographic volatility; these states have relatively young median ages, transient populations, and, in Alaska’s case, limited access to long-term family support systems due to geographic isolation.
Washington, DC, while not a state, stands out with the highest marriage rate overall (22.5), a result influenced by its younger, highly educated, and mobile population. Despite frequent marriages, its divorce rate remains modest compared to other high-marriage-rate areas, possibly due to a lower average duration of marriages and the high cost of separation in urban environments.
On the other end of the spectrum, states with older populations tend to have lower divorce rates and more stable marriages. Vermont, for example, not only has one of the lowest divorce rates (4.4) but also a relatively high average age of marriage and the longest average marriage durations in the country, according to Our World Data.
This suggests that couples in Vermont are more likely to marry later in life, but when they do, the unions tend to last.
States like Nevada and Delaware present a different picture: both report lower marriage rates but relatively high divorce rates. In Nevada’s case, the high turnover may be driven by tourism and the ease of legal marriage and divorce procedures, especially in cities like Las Vegas.
Delaware’s combination of low marriage and high divorce rates points to possible socioeconomic pressures or delayed marriages that may be less stable over time.
How Many Americans Have Ever Married?
According to Census data, 65.5% of Americans age 15+ have been married at least once. The breakdown by state shows substantial variation:
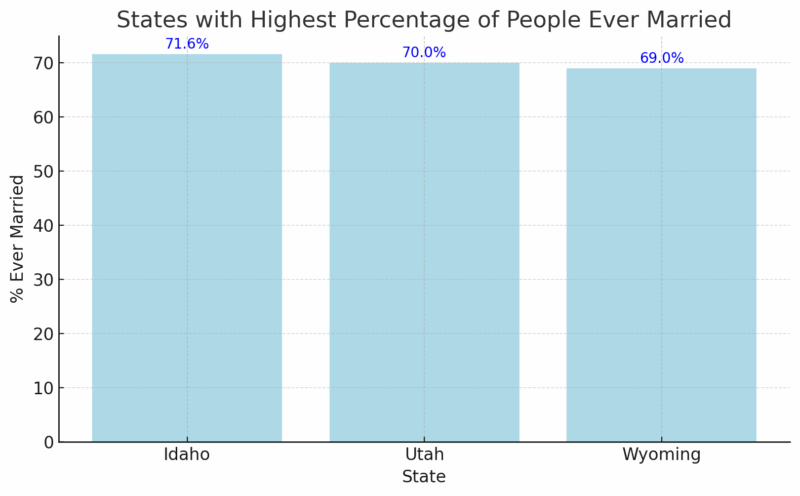
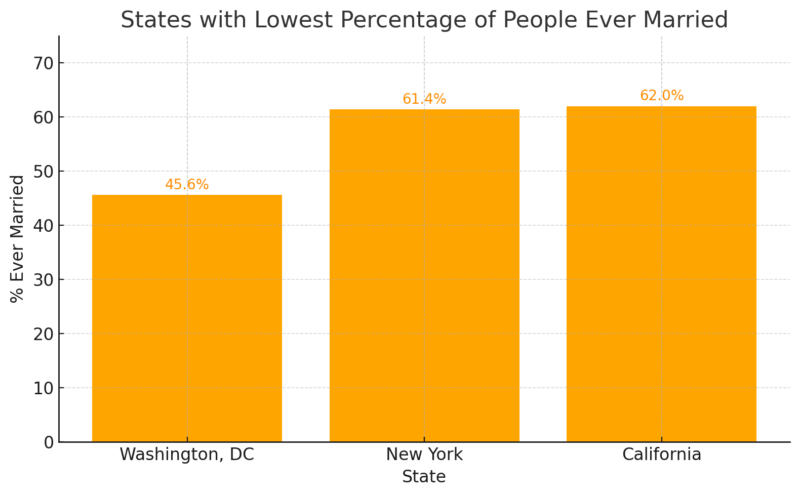
States with more urban populations, high costs of living, or cultural shifts away from marriage tend to have lower “ever married” rates.
How Long Do Marriages Last?
The duration of marriage in the U.S. varies significantly from state to state, and it’s closely tied to the average age at which people marry, as well as the demographic makeup of each region. In general, states with older populations and later marriage ages tend to see longer-lasting unions.
Couples in these states often wait until they have more financial stability, emotional maturity, and clarity about their long-term compatibility before tying the knot, which can contribute to more enduring relationships.
At the top of the list for longest-lasting marriages is Vermont, where the average marriage lasts 23.1 years. Wisconsin follows closely with an average of 22.7 years, and New Hampshire rounds out the top three at 22.6 years.
These states are also among the oldest demographically in the country, with a high proportion of residents over the age of 40. The tendency to marry later in life likely plays a role here, as couples who wait until their 30s or later often do so after reaching a certain level of life experience and stability.
State
Average Marriage Length
Vermont
23.1 years
Wisconsin
22.7 years
New Hampshire
22.6 years
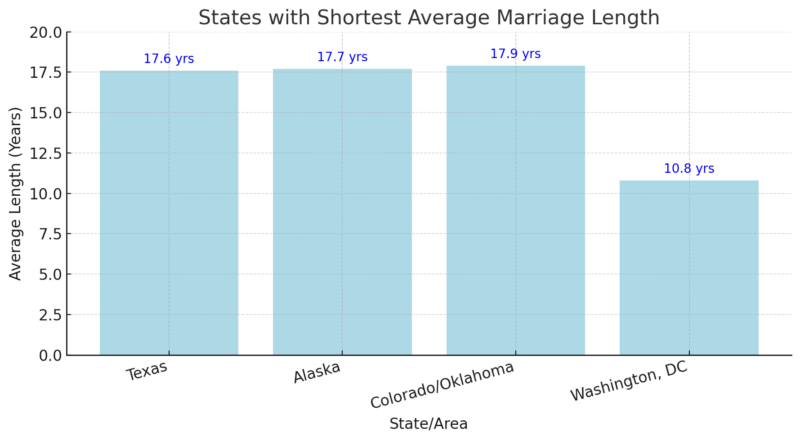
In contrast, states with younger populations and earlier marriage ages often see shorter marriage durations. Texas, for instance, has an average marriage length of 17.6 years. Alaska follows with 17.7 years, and both Colorado and Oklahoma average around 17.9 years.
These states tend to have more mobile populations, higher rates of economic volatility, and more traditional social pressures to marry early, all of which can increase the risk of early divorce.
One notable outlier is Washington, DC, which has the shortest average marriage duration in the country: just 10.8 years. This could be attributed to the highly transient nature of its population, where many residents move for short-term professional opportunities and long-term commitments are more difficult to sustain.
Overall, marriage length is less about the institution itself and more about the timing and context in which people enter it. Later marriages, particularly those entered with financial and emotional readiness, tend to last longer, a trend increasingly reflected in the national data.
Why Are Americans Delaying Marriage?
Across the U.S., marriage remains a valued milestone, but people are taking more time to reach it. The rising average marriage age is the result of several interconnected social and economic forces.
These changes are not random; they reflect a shift in how Americans view adulthood, relationships, and personal development.
1. Financial Instability
One of the most practical reasons for delaying marriage is cost. The average American wedding now totals around $33,000, and that number doesn’t include the cost of engagement rings, honeymoons, or new living arrangements.
For many young adults grappling with student loans, credit card debt, high rents, or low early-career wages, the financial demands of marriage and the lifestyle that often comes with it can be overwhelming. Many choose to wait until they feel economically secure enough to take on joint expenses or save for a proper wedding celebration.
2. Shifting Cultural Norms
Marriage no longer holds the same cultural weight it once did. In earlier generations, it was widely viewed as a necessary step toward adulthood. Today, it’s increasingly seen as one option among many.
Long-term cohabitation without marriage is far more socially accepted, and many couples now choose to raise children, buy homes, and build lives together without legalizing their relationship through marriage.
These shifts are especially pronounced among Millennials and Gen Z, who tend to place a higher value on individual autonomy, flexibility, and non-traditional life paths.
3. Emotional and Psychological Maturity
There’s also a growing recognition that emotional readiness plays a critical role in marital success. Research shows the human brain continues developing well into the mid-20s, particularly in areas related to decision-making and long-term planning.
Many adults now wait until they’ve gained more life experience and developed a stronger sense of identity before marrying. Psychologists often note that older couples tend to enter marriage with better communication skills, greater emotional stability, and a clearer understanding of what they want in a partner.
4. Dating App Culture and “Choice Overload”
Technology has dramatically changed how people date and form relationships. With dating apps offering what feels like an endless stream of potential matches, many individuals spend years exploring their options on sites like callmechat.
This “choice overload” can make settling down more difficult, as people constantly compare potential partners or worry about making the wrong choice. In a landscape where casual dating, short-term flings, and ambiguous relationships are common, serious commitments often take longer to form.
For many, the search for “the right person” stretches well into their 30s.
5. Fear of Divorce
View this post on Instagram
The high rate of divorce in the U.S. continues to shape how people approach marriage. Many who witnessed their parents’ or friends’ divorces are understandably cautious about entering a commitment they worry may not last.
This hesitancy leads some to postpone marriage until they feel more confident in their relationship’s long-term viability. Others opt to live together for years before marrying, using cohabitation as a way to “test drive” the relationship. This added time often pushes first marriages into the early- or mid-30s.
Methodology
To craft this article, we analyzed data from authoritative sources including the U.S. Census Bureau, The Knot’s 2025 Real Weddings Study, and Statista. We reviewed national trends on median marriage age from 1950 to 2025 and tracked how these evolved across gender and region.
A detailed state-by-state comparison was created using publicly reported figures on average marriage age, marriage rates, and divorce rates. We included demographic context such as income, education, and urbanization to explain regional differences.
Psychological and socioeconomic factors behind delayed marriages were synthesized from expert commentary and long-term studies. All data points were organized into structured sections with tables to ensure clarity and relevance for readers.
Conclusion
🇺🇸 Median age of first marriage in the US:
1960
Men: 22.8
Women: 20.32023
Men: 30.2
Women: 28.4— World of Statistics (@stats_feed) February 17, 2024
Despite dramatic social shifts and economic pressures, marriage remains a widely embraced institution in the United States. What’s changed is not the desire to marry, but when and how people choose to do it.
With the national average age for marriage now around 32, Americans are taking more time to prepare, emotionally, financially, and psychologically, before leaping.
The regional differences are still evident. States in the Northeast and West lead in marrying later, influenced by urban culture, higher education levels, and a stronger emphasis on personal development.
The South and Midwest, while still seeing earlier marriages on average, are also experiencing upward shifts in age. This trend is universal: even in traditionally conservative areas, people are waiting longer.