As of 2025, Kansas’s population is estimated to be approximately 2,944,380 according to World Population Review.
This reflects a modest increase from the 2010 Census figure of 2,853,118, indicating a steady growth over the past 14 years.
The state’s annual growth rate has been around 0.57%, ranking it 31st among all 50 states in terms of population growth.
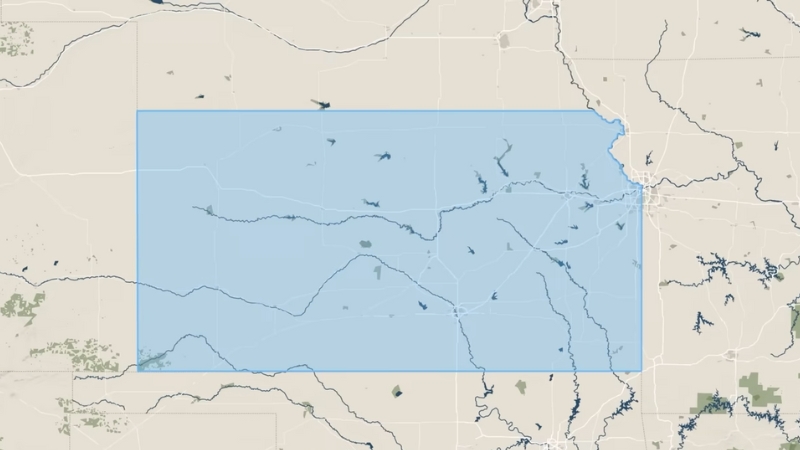
Kansas is centrally located in the United States and shares its borders with Nebraska to the north, Missouri to the east, Oklahoma to the south, and Colorado to the west.
Key Takeaways
Population by Age
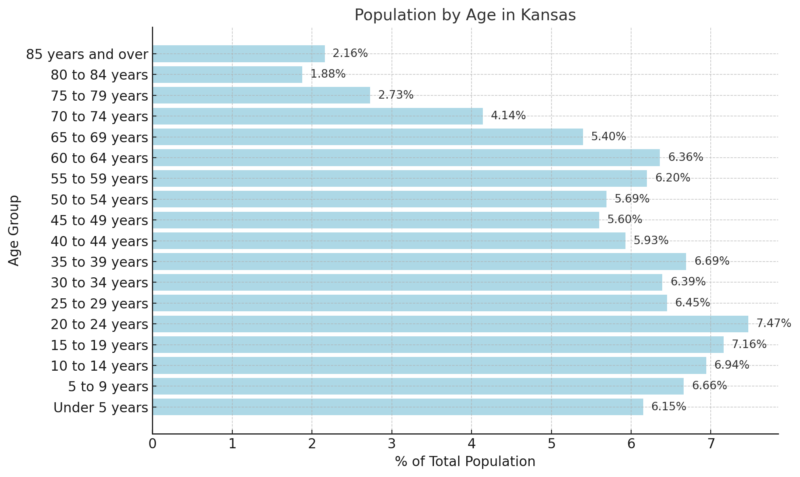
According to the 2018-2022 ACS 5-Year Estimates, the median age in Kansas is 37.1 years.
The population distribution by age shows that 19.75% are under 15 years old, 21.08% are between 15 and 29 years, 42.86% fall within the 30 to 64 age range, 14.15% are aged 65 to 84, and 2.16% are 85 years or older.
The largest percentage of the population is in the 20-24 age group (7.47%), indicating a significant representation of young adults, likely influenced by college-age individuals.
The smallest percentage belongs to the 80-84 age group (1.88%), reflecting the challenges of longevity in the aging population.
Population distribution shows a fairly even spread across younger and middle-aged cohorts, suggesting a balanced demographic structure.
Population by Age Cohort
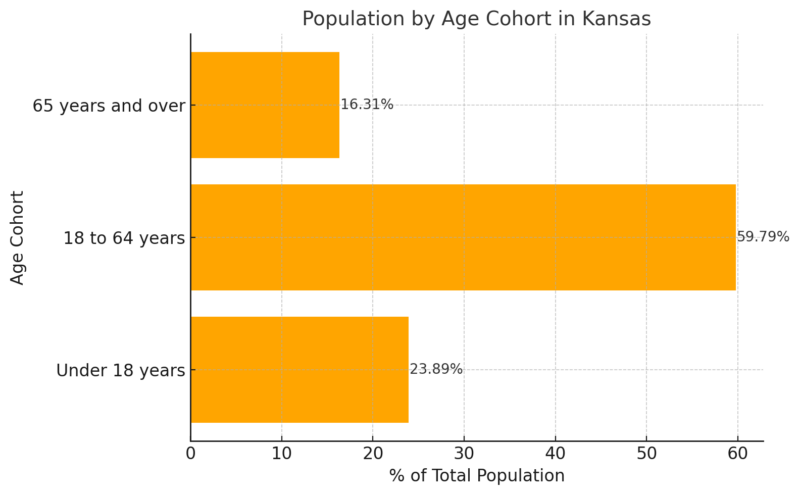
The working-age population (18-64 years) forms the majority, making up nearly 60% of the total, aligning with national trends.
Kansas has a higher percentage of individuals under 18 (23.89%) compared to the nationwide average of 22.11%, showcasing a strong presence of youth.
The senior population (65 years and older) at 16.31% is slightly below the national average of 16.53%, indicating relatively fewer elderly residents.
Population Pyramid Insights (Key Ratios)
- Youth Dependency Ratio: 30.9 (children aged 0-14 per 100 working-age adults).
- Old-Age Dependency Ratio: 25.5 (seniors aged 65+ per 100 working-age adults).
- Total Dependency Ratio: 56.4 (non-working population per 100 working-age adults).
- Potential Support Ratio: 3.9 (working-age individuals per elderly person).
Population By Race
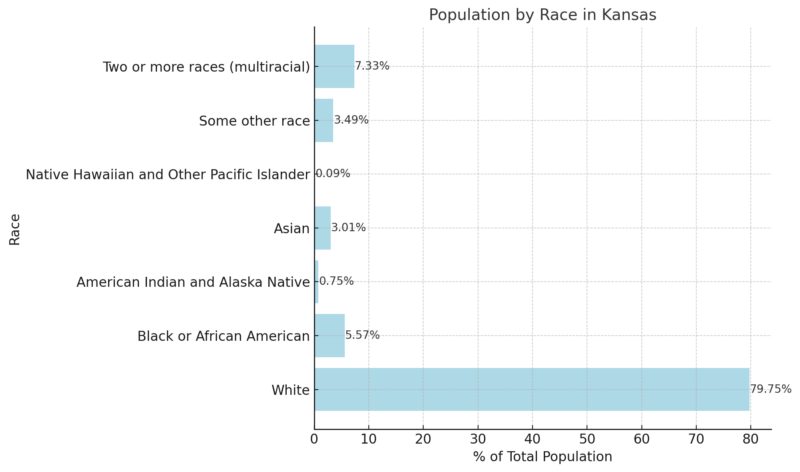
The majority of Kansas’s population is White (79.75%), reflecting the demographic trend seen in many Midwestern states according to Neilsberg.
Multiracial individuals account for 7.33% of the population, while “Some other race” contributes another 3.49%, showing growing racial diversity.
The Asian population (3.01%) and the Black or African American population (5.57%) represent smaller yet significant communities.
American Indian and Alaska Native residents constitute 0.75%, and Native Hawaiian or Pacific Islander individuals make up a very small fraction (0.09%).
Factors Influencing Population Change
Migration Patterns
Category
Number
Percentage (%)
Foreign Born Total
207,583
7.1%
Naturalized Citizens
86,745
41.8%
Non-Citizens
120,838
58.2%
Region of Birth
Born in Africa
12,859
6.2%
Born in Asia
61,398
29.6%
Born in Europe
14,321
6.9%
Born in Latin America
113,790
54.8%
Born in Northern America
2,028
1.0%
Born in Oceania
3,187
1.5%
Period of Entry
Before 1990
35,627
17.2%
1990-1999
42,077
20.3%
2000-2009
58,703
28.3%
Since 2010
71,176
34.3%
Children with Foreign-Born Parents
Children with One or More Foreign-Born Parents
100,541
15.2%
Children in Low-Income Families with One or More Foreign-Born Parents
44,299
19.9%
Kansas’s migration patterns reveal a growing and diverse foreign-born population, making up 7.1% of the state’s residents. Most migrants come from Latin America (54.8%), especially Mexico, followed by Asia (29.6%), with significant numbers from India, Vietnam, and the Philippines. Recent arrivals dominate, with over a third migrating since 2010 according to migration policy.
Naturalized citizens account for 41.8% of the foreign-born population, while 58.2% remain non-citizens. Children with foreign-born parents make up 15.2% of Kansas’s youth, and nearly 20% of these children live in low-income families. These trends reflect a dynamic immigrant community contributing to Kansas’s growth while facing economic and integration challenges.
Birth and Death Rates
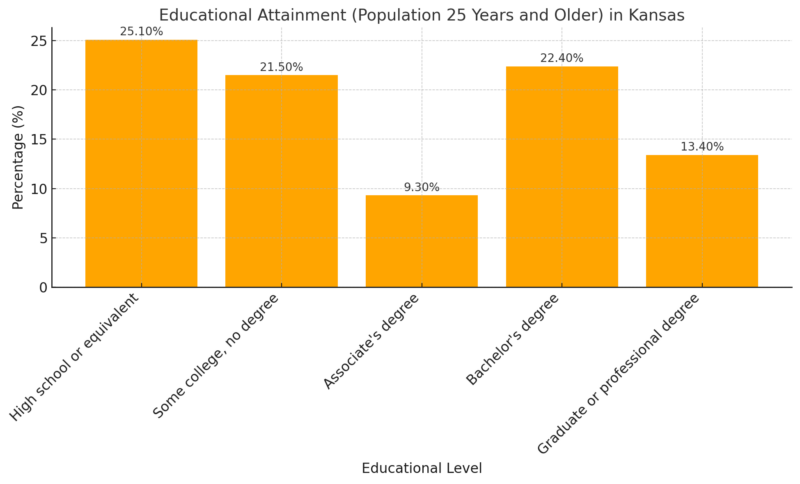
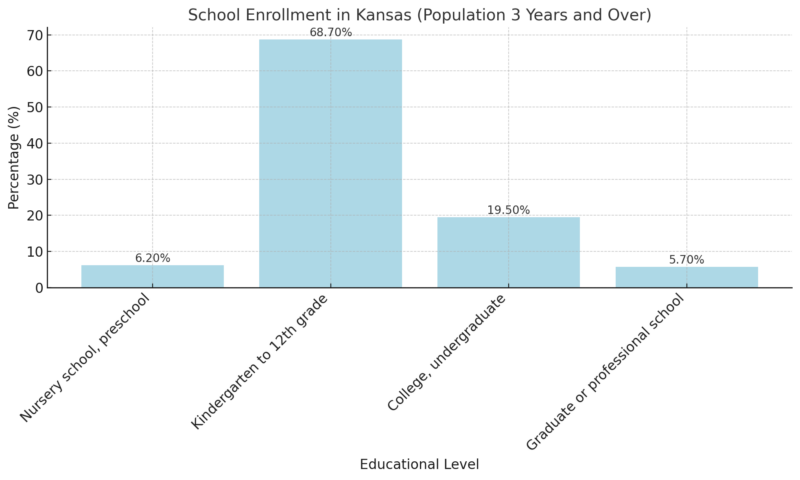
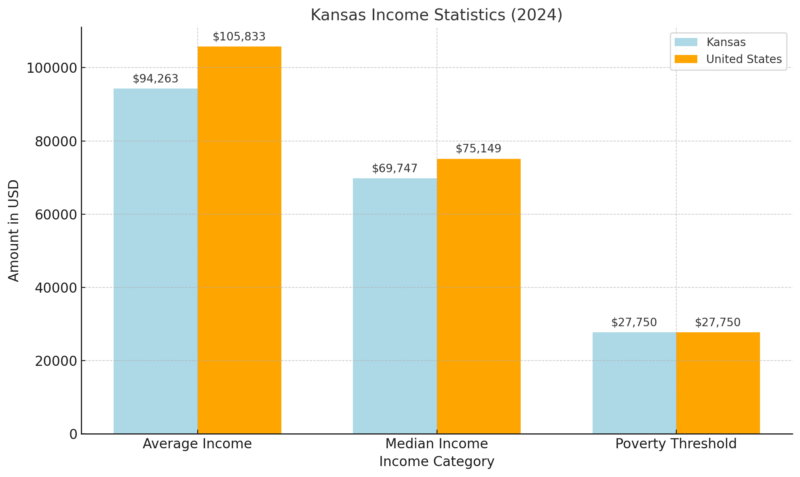
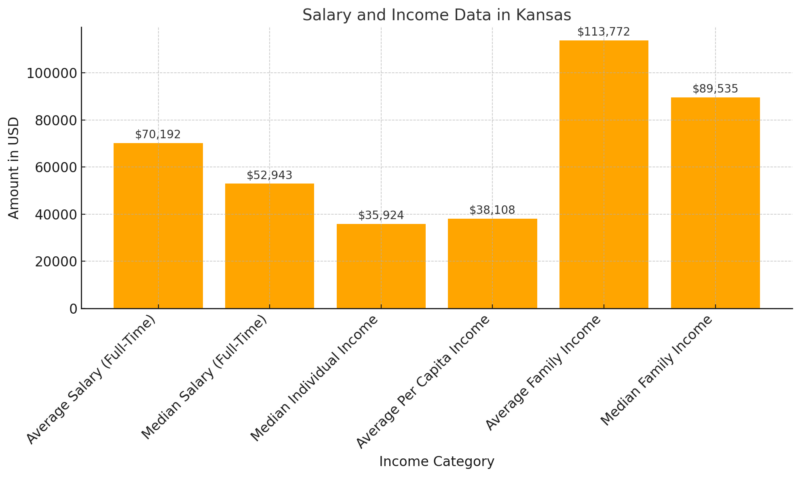
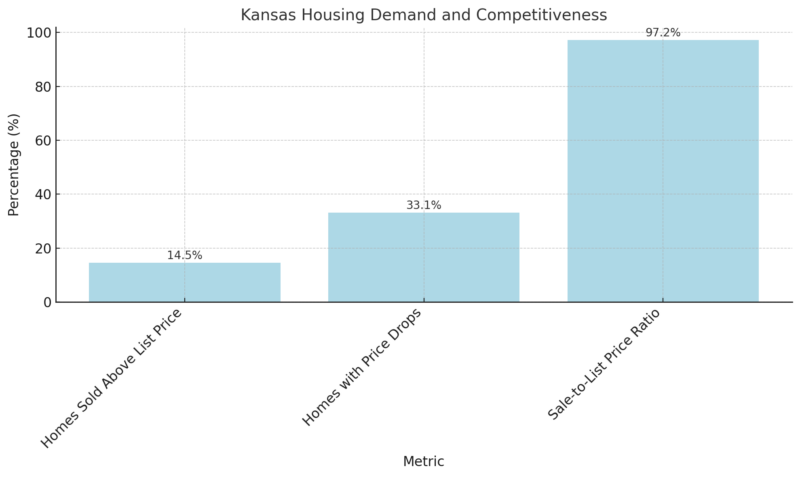
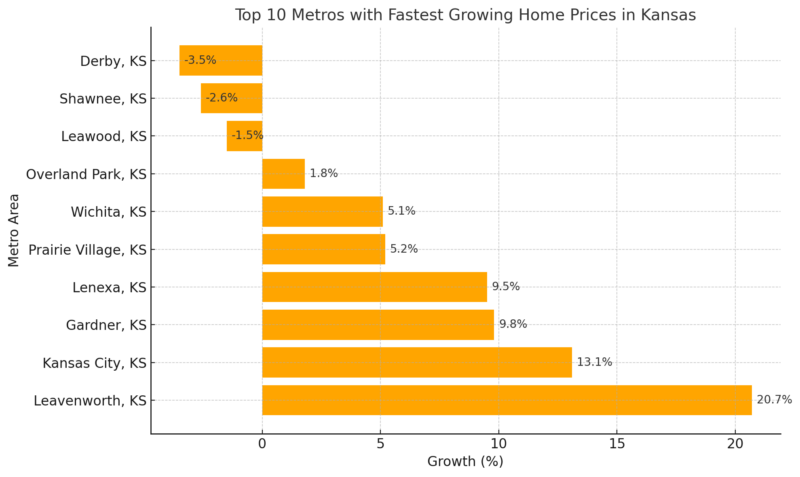
Kansas’s health indicators reveal a moderate fertility rate (60.3 births per 1,000 women) and progress in reducing teen births (16.2 per 1,000). However, 36% of births to unmarried mothers and an infant mortality rate of 5.81 per 1,000 highlight health disparities. Kansas had highest life expectancy in the US in 1959. But after failing to invest in human capital (not even expanding Medicaid), it now ranks 29th. OK has also tumbled. Meanwhile, NY did invest in its people and now ranks third. Interesting stats: https://t.co/ocTlVOcaxM — Nicholas Kristof (@NickKristof) November 26, 2019 Stable marriage (5.5 per 1,000) and divorce rates (1.9 per 1,000) reflect steady family dynamics. Efforts are needed to improve maternal health and address chronic diseases and preventable deaths. Kansas has 105 counties, with Johnson County as the most populous, housing 597,555 residents (20.52% of the state’s population). It has grown by 9.51% since the 2010 Census. Sedgwick County, the second-largest with 513,607 residents (17.64% of the population), has grown by 2.90%. Wyandotte County, home to Kansas City, ranks third with 165,324 residents (5.68%) and has seen a 4.88% increase since 2010. Greeley County is the least populated, with only 1,227 residents (0.04% of the state). It has a population density of 1.58 persons per square kilometer and has declined by 2.46%. Wallace County (1,503 residents) and Lane County (1,560 residents) follow, together making up 0.10% of the state. Wallace County has grown by 1.55%, while Lane County has decreased by 10.14%. Pottawatomie County is Kansas’s fastest-growing county, with an 11.73% increase since 2010, bringing its population to 24,277 (0.83%). Other rapidly growing counties include Johnson (9.51%), Douglas (9.21%), and Leavenworth (6.33%). Kansas’s educational attainment highlights that a significant proportion of residents (35.8%) have a bachelor’s degree or higher, slightly below the national average of 36.2% according to the official Census of 2020. A large percentage, 25.1%, hold a high school diploma or equivalent, while another 21.5% attended some college without earning a degree. School enrollment in Kansas shows that a majority (68.7%) of students are enrolled in Kindergarten through 12th grade, aligning closely with the national estimate of 67.8%. College undergraduate enrollment represents 19.5%, indicating a robust post-secondary education presence. Preschool and graduate/professional enrollment account for smaller proportions at 6.2% and 5.7%, respectively, highlighting the focus on foundational and undergraduate education within the state. The disabled population in Kansas makes up 13.9% of the total, slightly above the national average of 13.6%. The most common disabilities include ambulatory difficulty (6.5%) and cognitive difficulty (6.1%), reflecting challenges in mobility and mental health among residents according to recent data from Census. Other disability categories, such as hearing (4.1%) and vision difficulties (2.4%), show smaller but significant impacts. Kansas has a significant population of women of childbearing age (671,002), contributing to steady birth rates. The largest group of women giving birth in the past year were aged 20-34 (27,356), highlighting this cohort as the primary age group for childbirth. Births among teens (15-19) and older women (35-50) were substantially lower, reflecting national trends in age-specific fertility. The uninsured rate in Kansas stands at 8.4%, slightly higher than the national average of 7.9%. While the rate has declined over the past decade, from 10.2% in 2013 to 8.4% in 2022, it remains a concern for public health and access to medical care. The trend suggests gradual improvement in health insurance coverage but indicates room for policy interventions to bridge the gap further. (p) = Preliminary data BLS notes that the Kansas labor force has shown steady growth from May to October 2024, increasing from 1,507.1k to a preliminary 1,516.8k. Employment levels, however, have remained relatively stable, fluctuating slightly and ending at 1,465k in October. Unemployment has risen from 43.9k in May to 51.8k in October, leading to a gradual increase in the unemployment rate from 2.9% to 3.4%. Kansas household income is slightly below the national average, with average household income 11% lower and median income 7% lower than U.S. figures as per Income By Zip Code. The poverty threshold remains consistent across the state and nation, emphasizing the need for targeted income support to bridge these gaps. Kansas’s wealthiest zip code is 66224, with a mean household income of $256,718 and a median household income of $187,781. Most of the top 10 zip codes are concentrated in Johnson County and the Wichita area, highlighting regional economic disparities. Mean incomes in these areas are significantly higher than the state average. Kansas workers earn an average salary of $70,192, with median earnings at $52,943. Individual incomes are notably lower, with a per capita income of $38,108 and median individual income of $35,924. Family incomes, averaging $113,772, suggest that households with multiple earners fare better economically, indicating the importance of dual-income contributions to financial stability. Home prices in Kansas have increased by 7.5% year-over-year, with a median sale price of $284,500, aligning with the national median. The number of homes sold has grown modestly by 3.8%, while homes are staying on the market slightly longer, with a median of 27 days. These trends suggest a steady market with rising prices and moderate activity according to Redfin data. Kansas’s housing supply has grown, with an 11.5% increase in homes for sale and a 9.4% rise in newly listed properties. Despite this growth, the supply remains tight, with only 2 months of inventory. This indicates that while options for buyers are increasing, demand is still keeping inventory levels constrained. The percentage of homes sold above the list price has decreased slightly to 14.5%, reflecting a softening in market competition. Similarly, price drops are becoming more common, with 33.1% of homes experiencing reductions. The sale-to-list price ratio of 97.2% indicates sellers are receiving slightly less than their asking prices on average. Leavenworth leads Kansas metros in home price growth with a 20.7% increase, followed by Kansas City at 13.1%. Other cities like Gardner and Lenexa also show significant gains, reflecting high demand in these areas. However, a few metros, including Derby and Shawnee, experienced declines in home prices, suggesting localized cooling. This article is based on data from trusted sources, including the U.S. Census Bureau, American Community Survey, and Redfin. We analyzed population, housing, income, health, and educational data from 2024 and recent years. Statistical comparisons to national averages provided context for Kansas’s unique trends. Data was synthesized into clear tables and insights to highlight key takeaways. All efforts were made to ensure accuracy and clarity for comprehensive understanding.
Category
Value
Fertility Rate
60.3 births per 1,000 women (15-44 years)
Teen Birth Rate
16.2 births per 1,000 females (15-19 years)
Infant Mortality Rate
5.81 infant deaths per 1,000 live births
Life Expectancy at Birth
76.0 years
Marriage Rate
5.5 marriages per 1,000
Divorce Rate
1.9 divorces per 1,000
Drug Overdose Death Rate
26.5 deaths per 100,000
Firearm Injury Death Rate
16.8 deaths per 100,000
Homicide Rate
5.8 deaths per 100,000
Births to Unmarried Mothers
36.0%
Cesarean Delivery Rate
30.1%
Preterm Birth Rate
10.46%
Low Birthweight Rate
7.83%
Leading Causes of Death
Heart Disease, Cancer, COVID-19, Accidents, Chronic Lower Respiratory Diseases, Stroke, Diabetes, Alzheimer’s Disease, Kidney Disease, Suicide
Life expectancy is 76 years, impacted by leading causes of death like heart disease, cancer, and COVID-19. Drug overdose and firearm-related deaths (26.5 and 16.8 per 100,000, respectively) indicate mental health and safety challenges according to the CDC.Kansas Counties Population 2025
County
Population
County
Population
Allen County
12,335
Linn County
9,943
Anderson County
7,878
Logan County
2,627
Atchison County
15,979
Lyon County
32,313
Barber County
4,018
Marion County
11,597
Barton County
24,740
Marshall County
9,874
Bourbon County
14,373
McPherson County
30,119
Brown County
9,127
Meade County
3,909
Butler County
68,975
Miami County
35,849
Chase County
2,590
Mitchell County
5,708
Chautauqua County
3,307
Montgomery County
30,283
Cherokee County
19,083
Morris County
5,268
Cheyenne County
2,654
Morton County
2,559
Clark County
1,755
Nemaha County
10,064
Clay County
7,973
Neosho County
15,257
Cloud County
8,774
Ness County
2,579
Coffey County
8,250
Norton County
5,335
Comanche County
1,620
Osage County
15,943
Cowley County
33,891
Osborne County
3,373
Crawford County
38,383
Ottawa County
5,830
Decatur County
2,735
Pawnee County
6,064
Dickinson County
18,535
Phillips County
4,739
Doniphan County
7,511
Pottawatomie County
26,472
Douglas County
121,099
Pratt County
9,091
Edwards County
2,706
Rawlins County
2,403
Elk County
2,486
Reno County
61,442
Ellis County
28,780
Republic County
4,601
Ellsworth County
6,331
Rice County
9,150
Finney County
37,293
Riley County
71,241
Ford County
34,036
Rooks County
4,746
Franklin County
26,291
Rush County
2,719
Geary County
34,565
Russell County
6,713
Gove County
2,728
Saline County
52,807
Graham County
2,355
Scott County
4,837
Grant County
7,044
Sedgwick County
531,570
Gray County
5,775
Seward County
20,789
Greeley County
1,130
Shawnee County
177,955
Greenwood County
5,832
Sheridan County
2,407
Hamilton County
2,422
Sherman County
5,812
Harper County
5,470
Smith County
3,608
Harvey County
33,337
Stafford County
3,847
Haskell County
3,665
Stanton County
1,835
Hodgeman County
1,613
Stevens County
4,988
Jackson County
13,444
Sumner County
22,309
Jefferson County
18,300
Thomas County
7,822
Jewell County
2,809
Trego County
2,716
Johnson County
625,383
Wabaunsee County
7,105
Kearny County
3,781
Wallace County
1,525
Kingman County
6,958
Washington County
5,515
Kiowa County
2,343
Wichita County
2,086
Labette County
19,754
Wilson County
8,210
Lane County
1,514
Woodson County
3,113
Leavenworth County
84,114
Wyandotte County
164,936
Education System
Educational Attainment (Population 25 Years and Older) in Kansas
School Enrollment in Kansas (Population 3 Years and Over)
Health Care
Category
Kansas (%)
United States (%)
Disabled Population
13.9 ± 0.3
13.6 ± 0.1
Types of Disabilities in Kansas
Percentage (%)
—
Hearing Difficulty
4.1%
—
Vision Difficulty
2.4%
—
Cognitive Difficulty
6.1%
—
Ambulatory Difficulty
6.5%
—
Self-Care Difficulty
2.2%
—
Independent Living Difficulty
5.8%
—
Fertility in Kansas (2023)
Category
Kansas
United States
Women 15-50 Years Old
671,002 ± 4,191
77,984,030 ± 34,163
Women with Births in the Past 12 Months in Kansas
—
—
15 to 19 years
924
—
20 to 34 years
27,356
—
35 to 50 years
8,712
—
Health Insurance Coverage in Kansas (2023)
Category
Kansas (%)
United States (%)
Without Health Care Coverage
8.4 ± 0.4
7.9 ± 0.1
Labor Force Data (May 2024 – October 2024)
Month
Civilian Labor Force (in 1000s)
Employment (in 1000s)
Unemployment (in 1000s)
Unemployment Rate (%)
May 2024
1,507.1
1,463.3
43.9
2.9
June 2024
1,507.3
1,461.3
46.0
3.0
July 2024
1,508.5
1,460.1
48.3
3.2
August 2024
1,510.3
1,460.7
49.6
3.3
September 2024
1,512.6
1,462.2
50.4
3.3
October 2024
(p)1,516.8
(p)1,465.0
(p)51.8
(p)3.4
Kansas Income Statistics (2024)
Richest Zip Codes in Kansas
Rank
Zip Code
Population
Mean Income
Median Income
1
66224
12,301
$256,718
$187,781
2
66221
24,434
$234,854
$207,534
3
67228
2,726
$224,226
$193,393
4
66211
5,749
$221,246
$117,232
5
66206
12,038
$215,130
$163,986
6
66220
8,135
$211,901
$168,484
7
67230
11,730
$204,524
$148,379
8
66209
19,452
$199,134
$134,173
9
66208
21,609
$186,199
$112,659
10
66085
10,906
$184,518
$134,028
Salary and Income Data
Kansas Housing Market
Metric
Value
YoY Change (%)
Median Sale Price
$284,500
+7.5%
Number of Homes Sold
2,729
+3.8%
Median Days on Market
27
+4 days
Kansas Housing Supply
Metric
Value
YoY Change (%)
Homes for Sale
9,471
+11.5%
Newly Listed Homes
3,218
+9.4%
Months of Supply
2
No Change
Housing Demand and Competitiveness
Top 10 Metros with Fastest Growing Home Prices in Kansas
Methodology
References:
Related Posts:
- Tennessee’s Population Growth in 2025 - Key Insights…
- Maine’s Population Growth in 2025 - Key Insights and Trends
- North Dakota’s Population Data in 2025 - Key…
- New Mexico Population 2025 - Key Insights and Stats
- Washington State Population Boom in 2025 - Key Stats…
- Oregon Population in 2025 - Key Insights and Data


