New York City has an estimated 8,584,629 residents, according to the latest official Census Bureau data from July 1, 2025.
This number shows that the city gained back a good portion of the population it lost during the pandemic, but that growth has now flattened out. While New York is still below its April 2020 Census count of 8,804,190, this latest estimate is significantly higher than the low point seen in 2022.
The latest NYC Department of City Planning population report shows that the population barely budged between July 2024 and July 2025. The city lost just 12,196 residents over those twelve months, marking a tiny dip after two straight years of solid gains.
The current population rests on a fine line. Births are still outpacing deaths, and people moving in from other countries continue to add to the total headcount.
However, domestic migration is still in the red, meaning more people are moving out of New York to other US states than are moving in from them.
Moreover, things like rent prices, apartment availability, immigration rules, remote work options, and everyday living costs will decide where the numbers go next.
New York City Population Overview For 2026
| Latest official city estimate | 8,584,629 |
| 2020 Census count | 8,804,190 |
| Change from April 2020 to July 2025 | -219,561 residents |
| Change from July 2024 to July 2025 | -12,196 residents |
| Largest borough | Brooklyn, 2,653,963 residents |
| Second-largest borough | Queens, 2,358,182 residents |
| Median age | 38.5 years |
| Foreign-born population | 36.7% |
| Language other than English spoken at home | 48.3% |
| Median household income | $81,228 |
| Poverty rate | 18% |
| Owner-occupied housing rate | 32.8% |
| Rental vacancy rate | 1.4% |
We also tracked the wider state trend in our report on New York State population in 2026. That wider picture helps explain why New York City remains the center of the state population story, even when nearby suburbs and the Hudson Valley move differently.
NYC Population by Borough
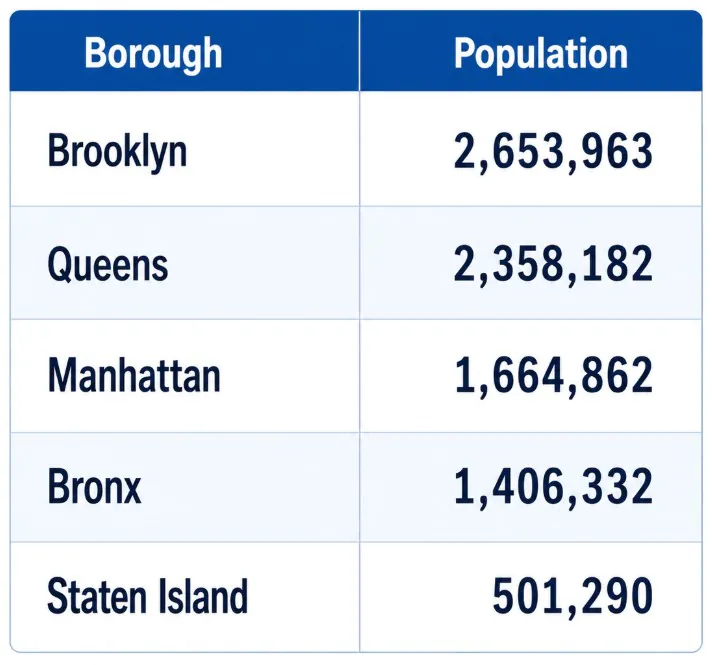
Brooklyn still has the most people, followed by Queens, Manhattan, the Bronx, and Staten Island.
Borough
July 2025 Estimate
Share of NYC Population
Change Since 2020 Census
Change From July 2024 to July 2025
Brooklyn
2,653,963
30.9%
-82,111
-4,694
Queens
2,358,182
27.5%
-47,282
-8,852
Manhattan
1,664,862
19.4%
-29,389
-648
Bronx
1,406,332
16.4%
-66,322
+280
Staten Island
501,290
5.8%
+5,543
+1,718
The bounce-back looks very different depending on the area. Staten Island is the only borough with more people now than in 2020. The Bronx and Brooklyn are still down the most. Queens took the biggest hit last year, losing over 8,000 residents after gaining more than 52,000 the year before.
Brooklyn
Brooklyn has 2,653,963 residents in the latest estimate, holding onto its spot as the biggest borough with nearly 31% of the city’s total population. It lost 4,694 people between July 2024 and July 2025, a small drop that followed a huge gain of 46,764 residents the year before.
If it were its own city, Brooklyn would still rank among the largest in the country. The current numbers are driven by high housing costs, families moving out, new immigrants arriving, and a stark divide between booming waterfront neighborhoods and more affordable inland areas.
Queens
Queens has 2,358,182 residents, keeping its position as the second-largest borough. It lost 8,852 people from July 2024 to July 2025, which was the single biggest one-year drop among all the boroughs.
At the same time, Queens saw the city’s highest influx of international immigrants, adding 20,672 people from abroad, even as a large number of residents moved away to other parts of the US. This defines the borough’s current trend: immigration keeps the numbers afloat, while domestic departures pull them down.
Manhattan
Manhattan’s population stands at 1,664,862. After a massive rebound from its 2021 low point, the headcount stayed almost completely flat over the last year, dipping by just 648 residents.
Manhattan took a heavy hit early in the pandemic because its population includes many high-income renters, students, and office workers who could relocate easily. The subsequent recovery was fueled by people moving back, international arrivals, and the full return of hybrid work, colleges, and city life.
The Bronx
The Bronx has 1,406,332 residents, staying virtually unchanged over the last year with a tiny gain of 280 people. However, the borough is still down by 66,322 residents compared to the 2020 Census.
The Bronx has a younger average population than the rest of New York and is heavily shaped by its Latino, Black, and immigrant communities. Future growth here depends heavily on rent prices, local job opportunities, school enrollment, and the availability of new housing.
Staten Island
Staten Island has 501,290 residents in the latest data. While it remains the smallest borough, it is the only one that has actually grown past its 2020 Census count, adding 1,718 residents between July 2024 and July 2025.
Staten Island stands out because its housing market is different, featuring far more single-family, owner-occupied homes. This lower density explains why its population trends don’t match the ups and downs of the more crowded boroughs.
NYC Population Slipped Last Year
New York City did not lose population because deaths outnumbered births. In fact, births beat out deaths by a wide margin.
The minor drop happened entirely because the number of residents moving to other parts of the United States was larger than the gains from new births and international immigration combined.
| Component of Change | July 2024 to July 2025 | What It Means |
|---|---|---|
| Births | 90,084 | New births added to the population |
| Deaths | 53,983 | Losses from residents passing away |
| Natural increase | +36,101 | More births than deaths |
| Net international migration | +65,824 | People moving in from outside the United States |
| Net domestic migration | -113,718 | The gap between people leaving for other states and those moving in |
| Total net migration | -47,894 | Domestic departures outweighed international arrivals |
| Total population change | -12,196 | The overall population count stayed almost flat |
Residents moving to other destinations across the country remains the main challenge for local growth.
The Citizens Budget Commission Competitive NYC tracker highlighted this exact domestic outflow as an ongoing issue in its latest update.
This follows the same pattern detailed in the guide on population decline in the U.S. by state, where local migration trends explain why specific cities lose residents even when the national population keeps climbing.
Race and Ethnicity in NYC
New York City remains one of the most diverse places in the country, with Census data showing no single racial or ethnic group forming a majority.
| Race or Ethnicity | Share of New York City Population | Important Note |
|---|---|---|
| White alone | 33.8% | Includes Hispanic and non-Hispanic residents who identify as White alone |
| White alone, not Hispanic or Latino | 31.0% | Non-Hispanic White population share |
| Hispanic or Latino | 28.5% | Hispanic residents can be of any race |
| Black alone | 21.9% | Includes people who identify as Black alone |
| Asian alone | 14.7% | Large communities include Chinese, Indian, Korean, Bangladeshi, Filipino, and other Asian groups |
| Two or more races | 12.3% | Multiracial identification continues to grow in Census data |
| American Indian and Alaska Native alone | 0.8% | Small citywide share |
| Native Hawaiian and Other Pacific Islander alone | 0.1% | Small citywide share |
The Hispanic category overlaps with racial categories because the Census treats Hispanic origin as an ethnicity rather than a race. Because of this overlap, these percentages do not add up to a clean 100%.
For context on how these trends fit into national patterns, see our separate county-level breakdown of the Black population in the United States by county, which tracks regional migration, metro growth, and historical concentrations.
Age Structure, Households, and Family Patterns
The city population is aging, though it remains younger on average than the rest of New York State. Children under 18 make up 20.2% of the population, while residents aged 65 or older account for 16.6%.
| Demographic Measure | Latest Figure | What It Shows |
|---|---|---|
| Median age | 38.5 years | ACS 2024 one-year profile |
| Under age 5 | 5.7% | Young children make up a smaller share here than in faster-growing Sunbelt cities |
| Under age 18 | 20.2% | About one in five residents is a child |
| Age 65 and older | 16.6% | An aging population increases the demand for senior housing, accessibility, and healthcare |
| Female residents | 52.0% | Women make up a slight majority of the population |
| Households | 3,334,088 | Census QuickFacts 2020-2024 |
| Persons per household | 2.48 | Average household size aligns closely with national averages |
| Lived in same house one year earlier | 90.1% | The vast majority of residents stayed in their homes from one year to the next |
Tracking household shifts matters because population totals do not tell the whole story. These shifts directly dictate housing demand, school enrollment planning, subway ridership trends, and long-term healthcare needs.
Immigration and Languages in New York City
Immigration is a primary driver of the city population. The latest ACS data lists over 3.1 million foreign-born residents, meaning immigrants make up 36.7% of all city residents.
The Mayor’s Office of Immigrant Affairs 2024 annual report confirms this massive presence, noting that the Dominican Republic, China, and Jamaica are the top three countries of birth for foreign-born New Yorkers.
| Immigration or Language Measure | Latest Figure | Source Context |
|---|---|---|
| Foreign-born residents | 3,108,115 | ACS 2024 one-year estimate via Census Reporter |
| Foreign-born share | 36.7% | More than double the national average in the ACS 2024 profile |
| Language other than English spoken at home | 48.3% | ACS 2024 one-year estimate for residents aged 5 and older |
| Top immigrant origin countries in MOIA report | Dominican Republic, China, Jamaica | Based on the ACS 2023 snapshot in the MOIA report |
| Major limited-English-proficiency language groups in MOIA report | Spanish, Chinese dialects, Russian, Bangla | MOIA notes these four groups account for nearly three-quarters of foreign-born residents with limited English proficiency |
Beyond shaping the city identity, immigration drives clear policy priorities like language access, legal services, and school funding.
For a broader look at the economic side of this trend, read our report on how immigration shapes the U.S. workforce.
Income, Poverty, Education, and Work
New York City features high wages alongside severe poverty and crushing living costs. Recent data sets the city median household income at $81,228, while the poverty rate sits at 18%.
| Economic or Social Measure | Latest Figure | What It Shows |
|---|---|---|
| Median household income | $81,228 | ACS 2024 one-year estimate |
| Per capita income | $52,504 | ACS 2024 one-year estimate |
| Poverty rate | 18% | Higher than the national average in the same profile |
| High school graduate or higher | 83.8% | Residents aged 25 and older |
| Bachelor’s degree or higher | 42.5% | Residents aged 25 and older |
| Labor force participation | 63.1% | Census QuickFacts for residents aged 16 and older |
| Mean travel time to work | 40.3 minutes | Census QuickFacts citywide average |
A single median income figure can mask real-world struggles. A household earning at this level faces completely different realities depending on family size, childcare costs, local rent prices, and long commutes from the outer boroughs.
For a broader comparison, see our research on poverty in major U.S. cities, which highlights why extreme wealth and deep poverty frequently exist side by side in major urban hubs.
Housing is the Main Constraint on Population Growth
The city’s room to grow depends almost entirely on its housing supply. Even when jobs, schools, and cultural draws keep demand high, a lack of affordable housing stops the population from expanding.
The recent New York City Housing and Vacancy Survey revealed a rental vacancy rate of just 1.4%, a historic low that places the entire local market under intense strain.
| Housing Measure | Latest Figure | Why It Affects Population |
|---|---|---|
| Rental vacancy rate | 1.4% | A depleted rental supply makes it incredibly difficult for people to move to or within the city |
| Owner-occupied housing rate | 32.8% | The vast majority of households rent rather than own their homes |
| Median owner-occupied home value | $777,600 | Census QuickFacts baseline data |
| Median selected monthly owner cost with a mortgage | $3,293 | Census QuickFacts baseline data |
| Median gross rent | $1,821 | Census QuickFacts baseline data |
| Housing units | 3,737,632 | ACS 2024 one-year profile via Census Reporter |
Data from the NYU Furman Center State of New York City housing report reinforces this crisis, tracking a 2.9% vacancy rate in ACS-based indicators and showing that 5.3% of renter households face severe overcrowding.
While the city easily attracts students and young professionals via transit and career networks, keeping growing families in the city becomes nearly impossible when space and homeownership are out of reach.
Density and Transportation
With more than 29,300 people per square mile, New York City is far denser than any other major US city. This density makes a robust transit system possible, but it also makes housing shortages immediately obvious.
| Measure | Figure | Meaning |
|---|---|---|
| Land area | 300.45 square miles | Official Census geography boundaries |
| Population density | 29,303.2 people per square mile | The highest density among major US urban centers |
| Mean travel time to work | 40.3 minutes | Reflects long multi-borough commutes |
| Households with broadband subscription | 90.5% | Census QuickFacts data baseline |
| Households with a computer | 94.7% | Census QuickFacts data baseline |
Long daily commutes remain standard because high prices force workers far from main employment hubs. While remote work altered standard office routines, the city infrastructure remains strictly built around mass transit and dense commercial zones.
Migration Trends – Why People Leave and Why They Still Come?
New York City constantly swaps residents. It attracts a steady stream of international immigrants, college students, and professionals, but regularly loses established households to nearby suburbs and lower-cost states.
The latest Census data shows 65,824 net international immigrants arrived over a 12-month span, but net domestic migration hit -113,718, meaning domestic departures easily wiped out foreign arrivals.
| Population Force | Pushes Population Up | Pushes Population Down |
|---|---|---|
| International migration | Foreign immigration, international students, and employment visas | Policy changes, visa caps, and shelter system pressures |
| Domestic migration | High-paying jobs, colleges, culture, tech, and finance hubs | Crushing housing costs, local taxes, and the flexibility of remote work |
| Natural change | Births continue to outnumber deaths across the city | A general decline in birth rates softens this buffer over time |
| Housing supply | New construction allows families to stay and form households | Stagnant building trends and high rents force people out |
This migration balance determines the city’s short-term growth path. If immigration dips while domestic flight continues at its current pace, the total headcount will decline even with a steady surplus of births over deaths.
New York City Population Forecasts Through 2055
Long-term population projections from NYC Planning show gradual growth over the next few decades, predicting the city will reach 9.47 million residents by 2055. These numbers rely heavily on future housing production and steady migration paths.
| Year | Projected NYC Population | Projection Context |
|---|---|---|
| 2030 | 8,760,000 | Near-term growth following pandemic-era disruptions |
| 2035 | 8,960,000 | The total city population approaches the 9 million mark |
| 2040 | 9,140,000 | Steady, long-term urban expansion |
| 2045 | 9,290,000 | Growth tied directly to housing construction and immigrant arrivals |
| 2050 | 9,420,000 | Long-range macro projections |
| 2055 | 9,470,000 | The final endpoint of current NYC Planning models |
Individual borough models mirror this slow climb, with Brooklyn expected to hold its position as the most populous borough.
| Borough | 2030 Projection | 2055 Projection | Long-Term Pattern |
|---|---|---|---|
| Brooklyn | 2,720,000 | 2,980,000 | The largest borough maintains its lead |
| Queens | 2,380,000 | 2,540,000 | Modest growth following recent data corrections |
| Manhattan | 1,670,000 | 1,800,000 | Full recovery followed by steady development |
| Bronx | 1,490,000 | 1,650,000 | Rebound following recent population drops |
| Staten Island | 500,000 | 510,000 | The smallest borough stays flat near half a million |
The entire forecast assumes New York can build enough housing to accommodate this growth. Affordability remains the single greatest threat to these predictions, as high demand means little if people are priced out of a place to live.
What Influences the Forecast?
1. Housing Production
Population growth is impossible without housing. New York City can add jobs and attract migrants, but the total headcount cannot increase if apartments remain scarce and expensive. Low vacancy rates restrict new household formation and force families to look outside the city.
2. Domestic Migration
More people consistently leave the city for other parts of the US than move in. If this domestic outflow narrows, the total population can grow even with modest immigration numbers. If the exodus expands, keeping the city headcount steady becomes much harder.
3. International Migration
Immigration has historically been the main buffer preventing citywide population decline. Changes to federal visa rules, economic issues abroad, and local shelter capacity all directly alter the size and composition of these incoming flows.
4. Births, Deaths, and Aging
New York City still records a natural increase because births outnumber deaths, but annual birth rates have trended downward recently. At the same time, a growing senior demographic shifts local demand toward healthcare, accessible housing, and senior services.
5. Remote Work and Office Jobs
The rise of remote and hybrid work models changed where high-income professionals choose to live. Manhattan recovered from its initial pandemic losses, but the relationship between office employment and residential location remains completely different from the 2010s.
6. Cost of Living
Affordability is the central question driving local population trends. The combined cost of housing, childcare, transit, groceries, and taxes serves as the deciding factor when people choose whether to stay, leave, or move to the city.
How NYC Compares with the Wider Region?
New York City is the core of the nation’s largest metropolitan area, but the city itself is only one part of the regional population. A substantial portion of the local workforce lives in Long Island, the Hudson Valley, New Jersey, or Connecticut.
This regional pattern means domestic outmigration from the city does not automatically equal a loss for the tri-state area. Many households relocate to nearby suburbs for more space or lower costs while keeping their NYC jobs, business ties, and social links.
For broader context on these trends, see our analyses of U.S. population by state and city and state population growth trends.
Methodology
The core population baseline relies on the U.S. Census Bureau estimate of 8,584,629. This figure serves as the current benchmark because official local population estimates are compiled and published retroactively.
Borough breakdowns and specific components of change come from the Population Estimates Program Vintage series, matching the data summarized by the NYC Department of City Planning.
Specific details on race, age, housing, income, and education are combined from Census QuickFacts, ACS one-year data through Census Reporter, the Mayor’s Office of Immigrant Affairs annual report, the NYC Housing and Vacancy Survey, and housing indicators from the NYU Furman Center.
Long-term outlooks through 2055 rely on official NYC Department of City Planning projections. These planning estimates use rounded numbers rather than exact future tallies.
Bottom Line
New York City’s population stands at roughly 8.58 million residents based on the latest official Census Bureau estimate. The overall headcount remains below the peak recorded in the 2020 Census, but the city has recovered a significant portion of its early pandemic losses.
The current pattern is stability paired with intense economic pressure. Natural increases and international arrivals add residents, while domestic outmigration and high living costs pull numbers down. Brooklyn remains the largest borough, Queens is the second-largest and most immigrant-driven, Manhattan has largely stabilized, the Bronx is below its 2020 baseline, and Staten Island is the only borough above its 2020 Census total.
Long-range projections point toward growth, indicating the potential to reach 9.47 million residents by 2055. Reaching that milestone depends heavily on expanding the housing stock, managing affordability, and ensuring the city can retain its working families and aging population instead of losing them to lower-cost regions.