
Population decline in the United States appears at the state level, while the national count still grew. The country reached 341,784,857 residents on July 1, 2025, according to the U.S. Census Bureau Vintage 2025 state population estimates.
That was an increase of 1,781,060 people from the previous year, or about 0.5 percent. The slower pace carries more weight than the topline growth number alone.
The Census Bureau January 2026 release shows that net international migration fell from 2.7 million to 1.3 million in the year ending June 30, 2025. Births still exceeded deaths nationally, yet natural increase remained far weaker than in earlier decades.
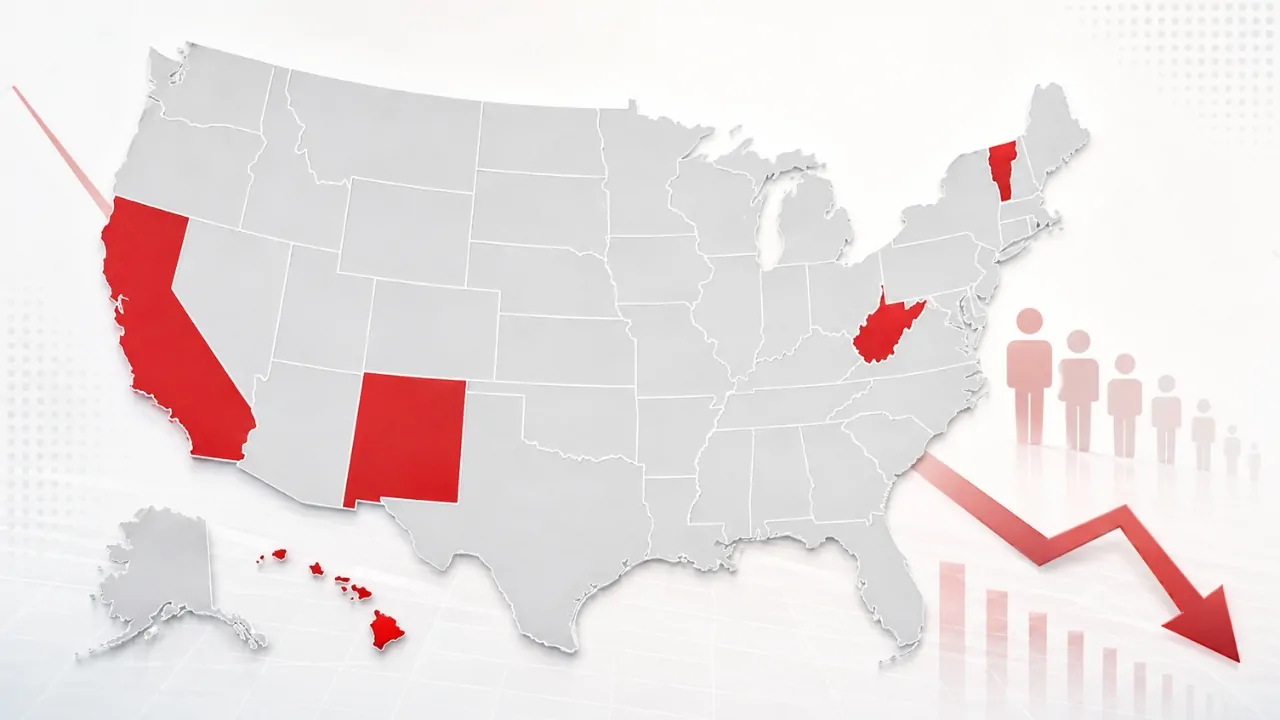
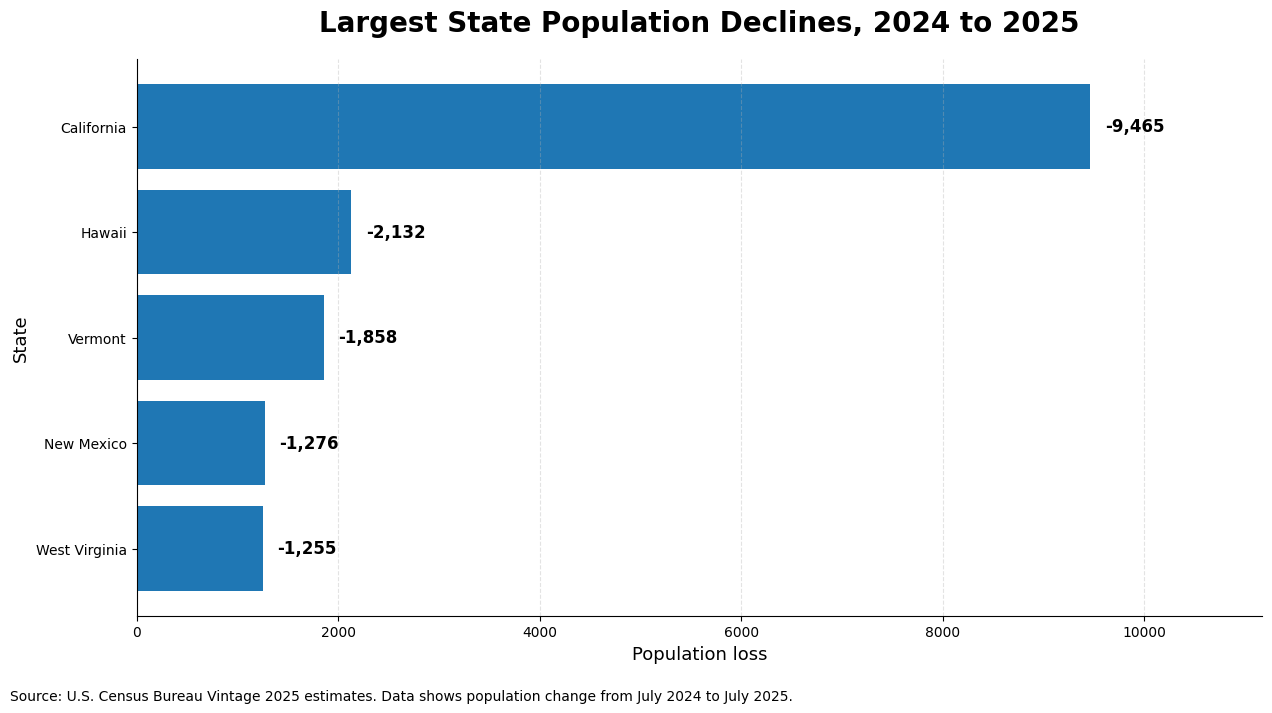
At the state level, the latest release points to a narrower but sharper divide. Forty-five states gained population from July 2024 to July 2025. Five states lost residents: California, Hawaii, New Mexico, Vermont, and West Virginia. Puerto Rico also declined and should be treated separately from the 50-state count.
Latest Insights
The latest official state dataset available in 2026 comes from Census Vintage 2025. It measures resident population totals and components of change from April 1, 2020, to July 1, 2025.
State population estimates for July 2026 have yet to be released, so the freshest official state-level figures are the 2025 estimates published in January 2026.
Measure
Latest Figure
What It Shows
U.S. population, July 1, 2025
341,784,857
The national population still increased
U.S. growth, 2024 to 2025
+1,781,060
Slowest growth since the early pandemic period
U.S. growth rate, 2024 to 2025
+0.5%
Growth slowed from 1.0% the previous year
Net international migration, 2025
+1,262,202
Major slowdown from 2024
Natural change, 2025
+518,858
Births still exceeded deaths nationally
States with population decline
5
California, Hawaii, New Mexico, Vermont, West Virginia
States That Lost Population
The population decline in 2025 was limited to five states. The reasons differed by state. California and Hawaii were pulled down mainly by domestic outmigration. Vermont, New Mexico and West Virginia showed the effect of natural decrease, where deaths exceeded births.
State
2025 Population
Change From 2024
Percent Change
Main Driver
California
39,355,309
-9,465
-0.02%
Large domestic outmigration outweighed natural increase and international migration
Hawaii
1,432,820
-2,132
-0.15%
Domestic outmigration outweighed gains from births and international migration
Vermont
644,663
-1,858
-0.29%
Deaths exceeded births, with additional domestic outmigration
New Mexico
2,125,498
-1,276
-0.06%
Deaths exceeded births, and more people left for other states than arrived
West Virginia
1,766,147
-1,255
-0.07%
Natural decrease outweighed domestic migration gains
Largest State Declines
Why States Lose Population
The Census Bureau measures population changes through births, deaths, domestic migration, and international migration. The Vintage 2025 methodology statement describes the basic formula: population base, plus births, minus deaths, plus migration, equals the population estimate.
Natural Decrease
Natural decrease happens when deaths outnumber births. In 2025, 17 states had negative natural change: Alabama, Arkansas, Delaware, Florida, Kentucky, Maine, Michigan, Mississippi, Montana, New Hampshire, New Mexico, Ohio, Oregon, Pennsylvania, Rhode Island, Vermont, and West Virginia.
Natural decrease plays a central role in places with older age structures. West Virginia offers the clearest example among the states that declined. The state gained 6,408 people from domestic migration in 2025, but deaths exceeded births by 7,887. That was enough to push the total population lower.
Domestic Outmigration
View this post on Instagram
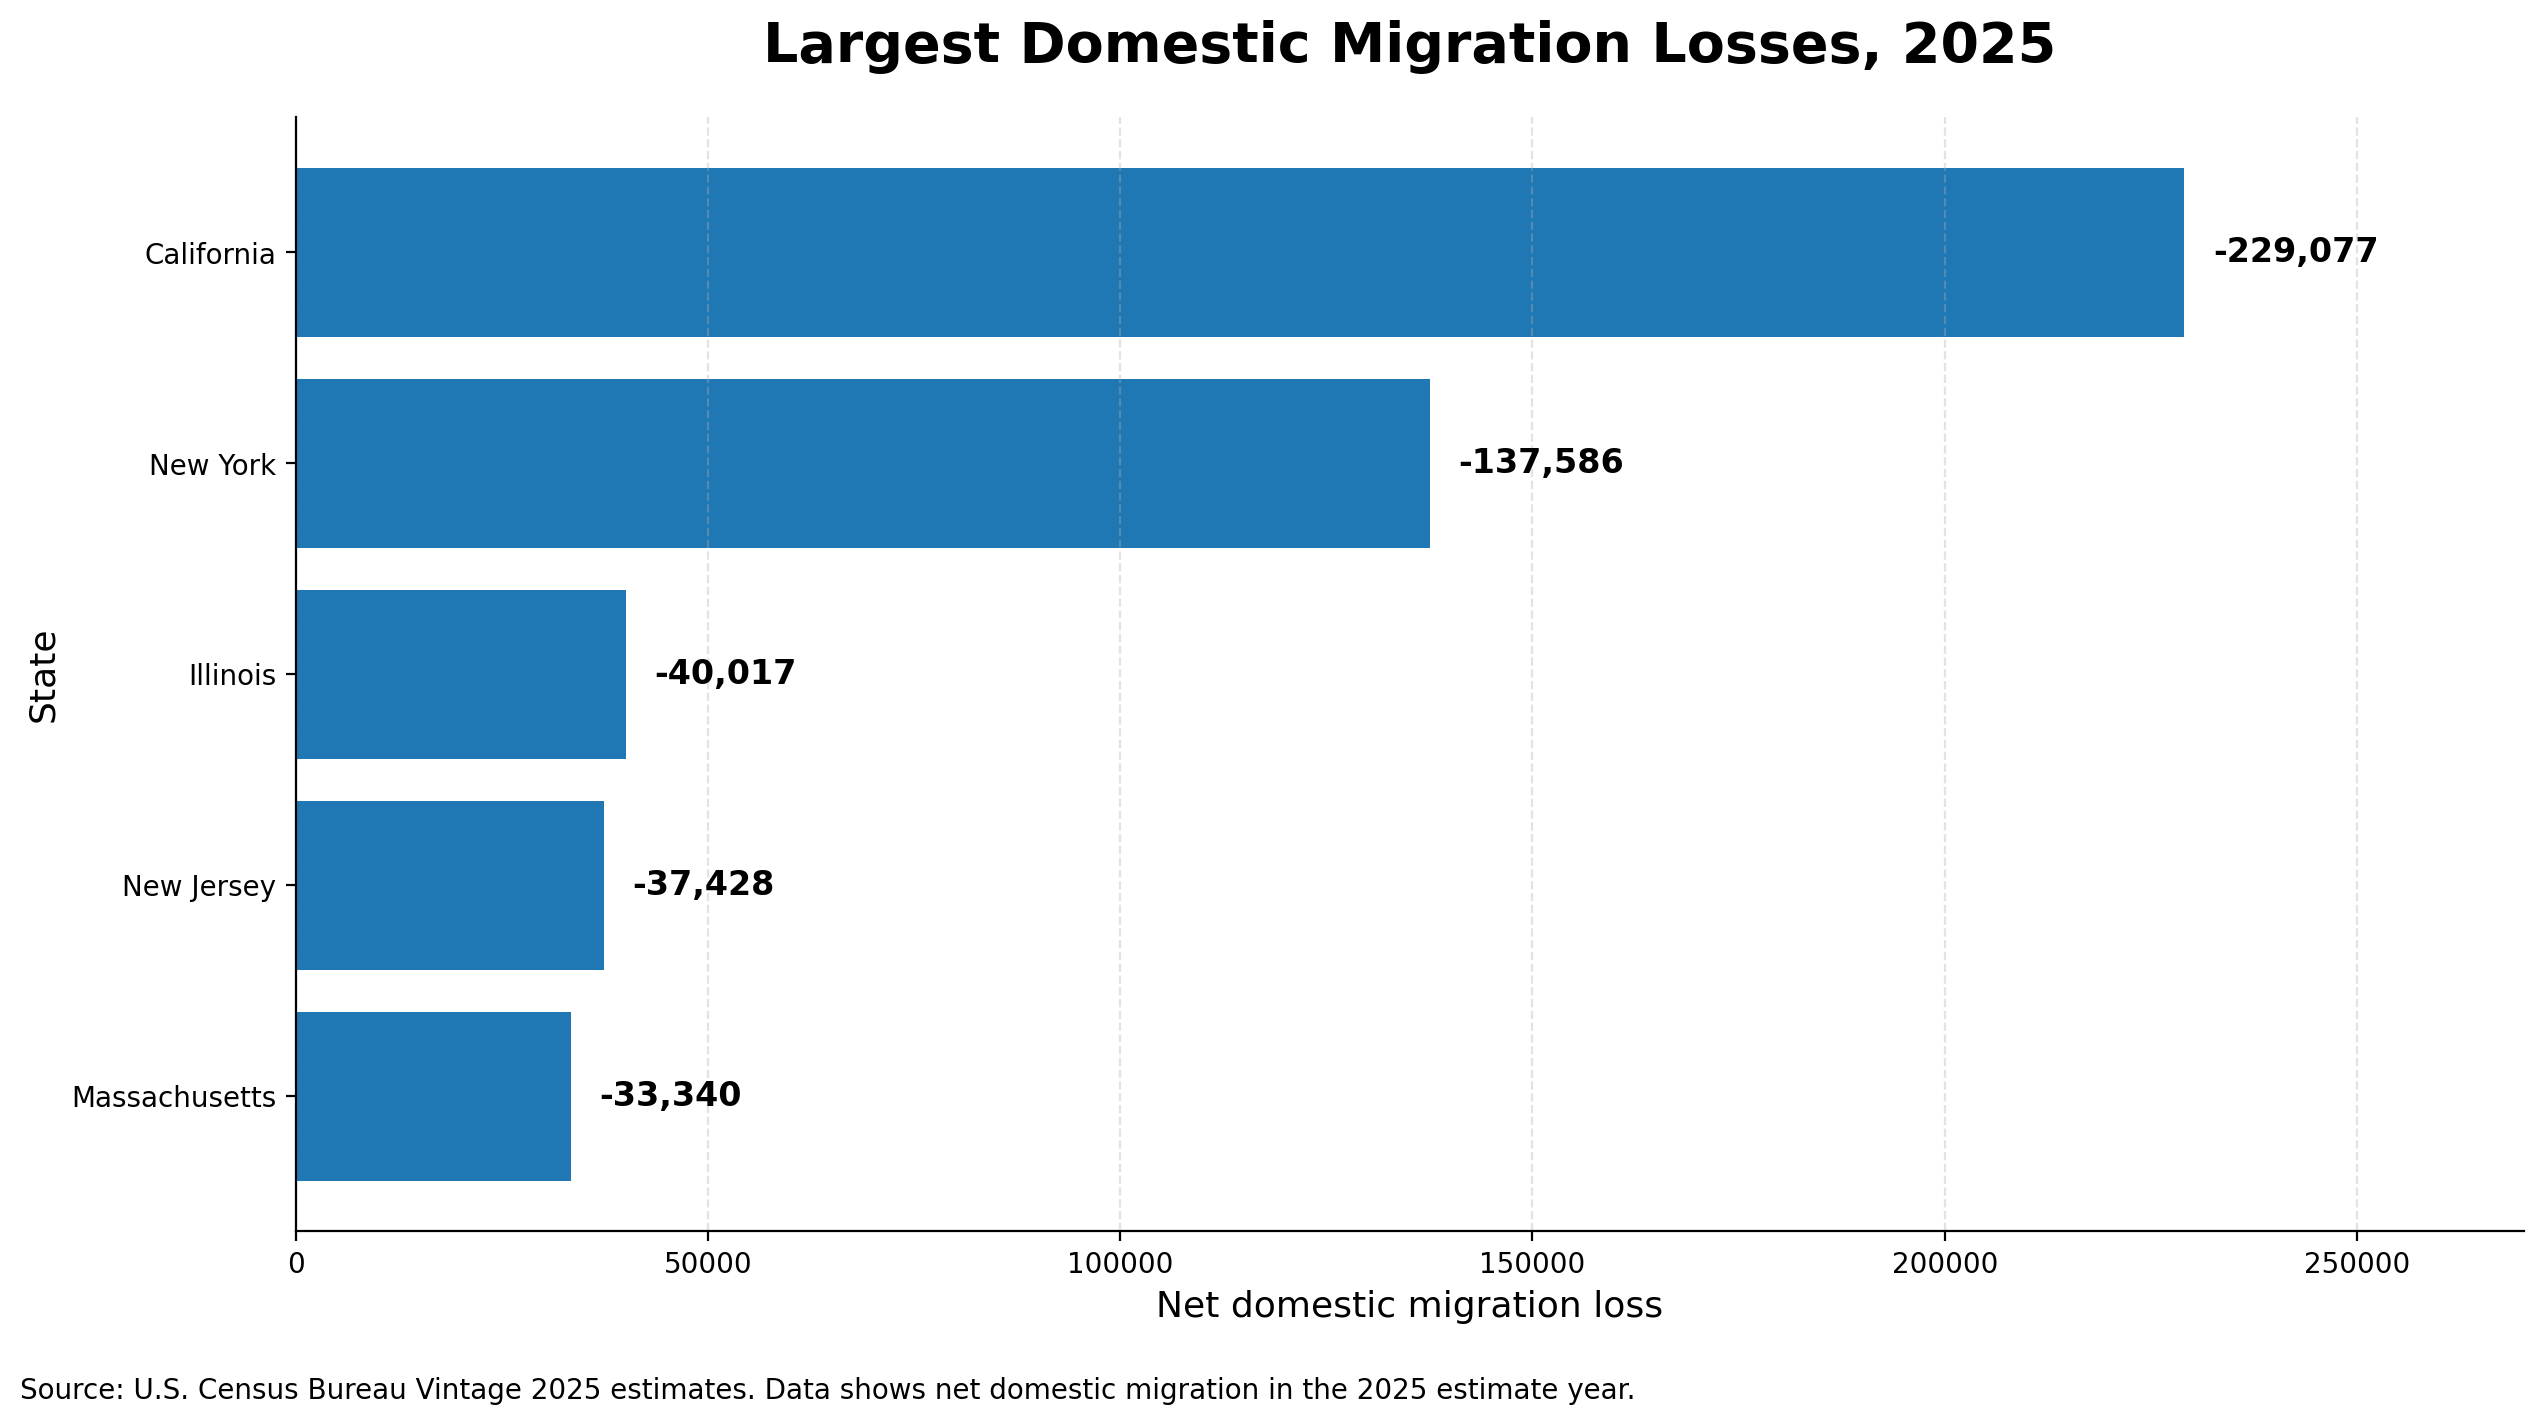
Domestic migration measures movement between U.S. states. In 2025, 20 states and the District of Columbia had negative domestic migration. California had the largest domestic loss at -229,077. New York followed at -137,586. Illinois, New Jersey, and Massachusetts also recorded large domestic migration losses.
Domestic migration helps explain why California declined, even with a natural increase of 109,715 and net international migration of 109,278. Those gains were nearly offset by the domestic outmigration of -229,077.
International Migration Slowdown
International migration remained positive for every state in 2025, but the size of the gain fell nationwide. The Census Bureau reported that net international migration dropped by 53.8 percent from the previous year.
The agency also projected that, if current patterns continue, net international migration could fall to about 321,000 by July 2026.
That shift changes the population outlook for states that had relied on international migration to offset domestic outmigration or natural decrease. New York, California, Illinois, New Jersey, and Massachusetts still received large international migration gains, yet several of those states remained close to flat growth or below their 2020 base.
Historical Context
The big demographic advantage the U.S. once enjoyed over other rich nations has evaporated. Now there are more Americans 80 and older than 2 or younger.
The case for pro-family and pro-immigrant policies has never been stronger.https://t.co/9xG0yQQdXm
— John Lettieri (@LettieriDC) April 26, 2021
State population decline has a long history, but the geography has changed. The Census historical population change table shows that the U.S. grew 7.4 percent from 2010 to 2020, the second-slowest decennial growth rate in U.S. history after the 1930s.
From 2010 to 2020, only three states lost population: Illinois, Mississippi, and West Virginia. Puerto Rico also recorded a steep decline over that decade.
In the 2020 to 2025 estimate period, seven states remained below their 2020 population base: California, Hawaii, Illinois, Louisiana, Mississippi, New York, and West Virginia.
Place
2010 Census
2020 Census
2010 To 2020 Change
Percent Change
Illinois
12,830,632
12,812,508
-18,124
-0.1%
Mississippi
2,967,297
2,961,279
-6,018
-0.2%
West Virginia
1,852,994
1,793,716
-59,278
-3.2%
Puerto Rico
3,725,789
3,285,874
-439,915
-11.8%
Longer Historical Pattern
West Virginia stands out because decline has appeared in more than one decade. Census historical data show population losses from 1950 to 1960, 1960 to 1970, 1980 to 1990, and 2010 to 2020. The latest 2025 estimate keeps the state below its 2020 base.
The broader national story changed after 2020. Population growth returned from the unusually weak pandemic period, yet the gain now depends heavily on migration. When international migration slows and births remain low relative to earlier decades, more states sit closer to the line between growth and decline.
State-by-State Population Change And Migration Data
The table below includes all 50 states, the District of Columbia, and Puerto Rico. The 2020 to 2025 percentage uses the Census Vintage 2025 estimate base, so it should be treated as an estimate series comparison rather than a decennial census comparison.
State Or Area
2025 Population
2024 To 2025 Change
2024 To 2025 %
2020 To 2025 %
Natural Change 2025
Domestic Migration 2025
International Migration 2025
Alabama
5,193,088
+30,033
+0.58%
+3.34%
-2,188
+23,358
+8,946
Alaska
737,270
+733
+0.10%
+0.53%
+3,308
-4,525
+1,959
Arizona
7,623,818
+67,394
+0.89%
+6.51%
+7,649
+31,107
+28,219
Arkansas
3,114,791
+18,711
+0.60%
+3.43%
-1,224
+14,475
+5,470
California
39,355,309
-9,465
-0.02%
-0.51%
+109,715
-229,077
+109,278
Colorado
6,012,561
+24,059
+0.40%
+4.11%
+20,608
-12,100
+15,356
Connecticut
3,688,496
+14,047
+0.38%
+2.24%
+2,283
-5,945
+17,534
Delaware
1,059,952
+9,829
+0.94%
+7.07%
-554
+6,855
+3,473
District of Columbia
693,645
+2,335
+0.34%
+0.59%
+2,516
-4,128
+3,915
Florida
23,462,518
+196,680
+0.85%
+8.93%
-1,333
+22,517
+178,674
Georgia
11,302,748
+98,540
+0.88%
+5.50%
+28,631
+27,333
+42,579
Hawaii
1,432,820
-2,132
-0.15%
-1.54%
+2,024
-8,876
+4,768
Idaho
2,029,733
+28,861
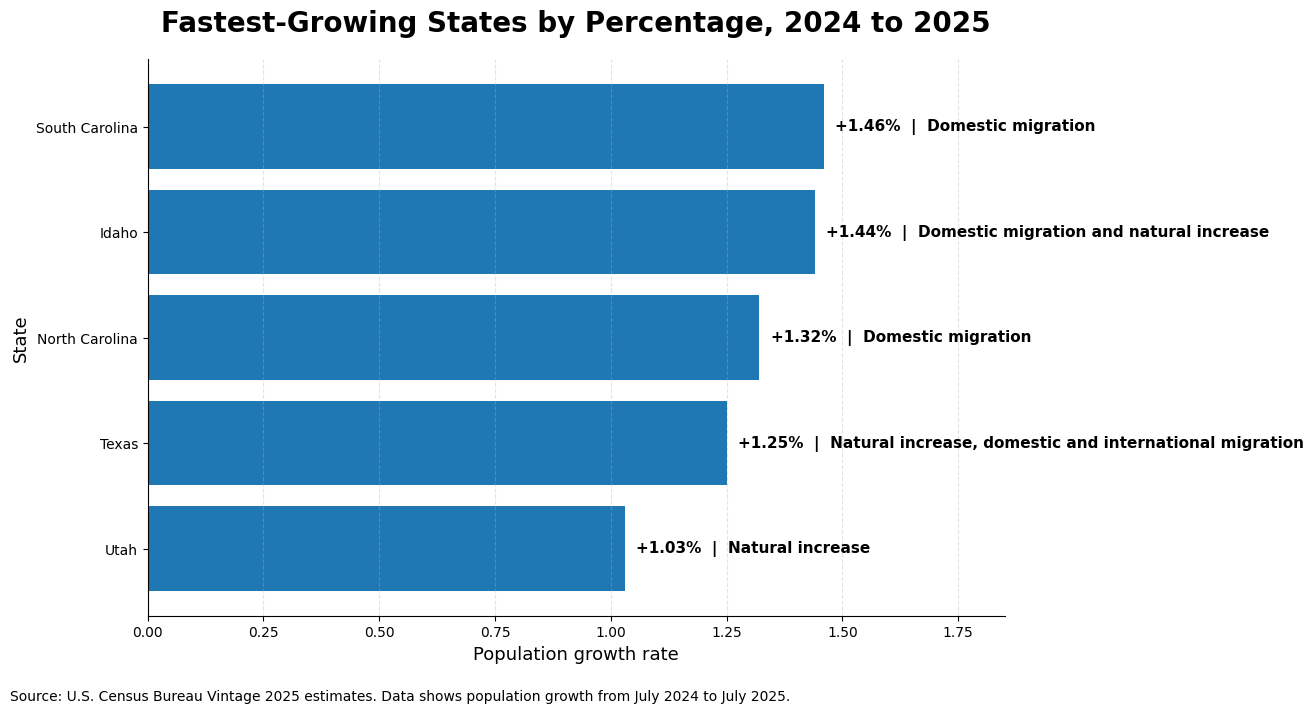
+1.44%
+10.36%
+6,900
+19,915
+2,148
Illinois
12,719,141
+16,108
+0.13%
-0.80%
+10,903
-40,017
+44,752
Indiana
6,973,333
+38,579
+0.56%
+2.75%
+8,561
+12,197
+17,852
Iowa
3,238,387
+7,933
+0.25%
+1.50%
+2,949
-970
+5,903
Kansas
2,977,220
+11,968
+0.40%
+1.34%
+4,951
-519
+7,440
Kentucky
4,606,864
+22,818
+0.50%
+2.23%
-83
+7,269
+15,709
Louisiana
4,618,189
+3,311
+0.07%
-0.85%
+2,774
-14,387
+14,900
Maine
1,414,874
+6,436
+0.46%
+3.79%
-5,019
+7,406
+4,040
Maryland
6,265,347
+20,033
+0.32%
+1.35%
+11,444
-12,127
+20,503
Massachusetts
7,154,084
+15,524
+0.22%
+1.72%
+8,419
-33,340
+40,240
Michigan
10,127,884
+27,922
+0.28%
+0.48%
-4,998
+1,796
+30,706
Minnesota
5,830,405
+33,000
+0.57%
+2.17%
+12,071
+8,300
+12,486
Mississippi
2,954,160
+3,988
+0.14%
-0.24%
-2,607
-917
+7,451
Missouri
6,270,541
+26,997
+0.43%
+1.88%
+177
+14,028
+12,665
Montana
1,144,694
+7,137
+0.63%
+5.58%
-90
+6,348
+899
Nebraska
2,018,006
+12,415
+0.62%
+2.86%
+6,136
-366
+6,599
Nevada
3,282,188
+28,645
+0.88%
+5.69%
+3,051
+14,914
+10,551
New Hampshire
1,415,342
+6,824
+0.48%
+2.74%
-2,167
+6,554
+2,403
New Jersey
9,548,215
+41,861
+0.44%
+2.79%
+26,023
-37,428
+53,064
New Mexico
2,125,498
-1,276
-0.06%
+0.38%
-1,885
-2,267
+2,879
New York
20,002,427
+1,008
+0.01%
-1.00%
+42,815
-137,586
+95,634
North Carolina
11,197,968
+145,907
+1.32%
+7.25%
+15,129
+84,064
+46,890
North Dakota
799,358
+5,971
+0.75%
+2.60%
+2,630
+512
+2,810
Ohio
11,900,510
+39,889
+0.34%
+0.86%
-729
+11,926
+28,505
Oklahoma
4,123,288
+25,530
+0.62%
+4.14%
+2,559
+14,492
+8,420
Oregon
4,273,586
+8,262
+0.19%
+0.86%
-3,764
+2,228
+9,636
Pennsylvania
13,059,432
+13,584
+0.10%
+0.44%
-10,708
-2,936
+26,921
Puerto Rico
3,184,835
-17,686
-0.55%
-3.07%
-14,907
+0
-2,779
Rhode Island
1,114,521
+4,106
+0.37%
+1.56%
-304
-1,551
+5,923
South Carolina
5,570,274
+79,958
+1.46%
+8.83%
+564
+66,622
+12,930
South Dakota
935,094
+7,984
+0.86%
+5.46%
+2,605
+2,169
+3,183
Tennessee
7,315,076
+63,785
+0.88%
+5.83%
+3,597
+42,389
+17,990
Texas
31,709,821
+391,243
+1.25%
+8.78%
+157,711
+67,299
+167,475
Utah
3,538,904
+35,921
+1.03%
+8.17%
+24,961
+3,343
+7,501
Vermont
644,663
-1,858
-0.29%
+0.25%
-1,769
-726
+623
Virginia
8,880,107
+60,465
+0.69%
+2.88%
+13,817
+6,268
+40,436
Washington
8,001,020
+73,062
+0.92%
+3.81%
+17,230
+9,238
+46,202
West Virginia
1,766,147
-1,255
-0.07%
-1.54%
-7,887
+6,408
+244
Wisconsin
5,972,787
+15,619
+0.26%
+1.33%
+1,161
+6,984
+7,260
Wyoming
588,753
+2,031
+0.35%
+2.06%
+295
+1,474
+258
State Comparisons
Fastest-Growing States By Percentage
Largest Numeric Growth
Rank
State
Population Gain
2025 Population
1
Texas
+391,243
31,709,821
2
Florida
+196,680
23,462,518
3
North Carolina
+145,907
11,197,968
4
Georgia
+98,540
11,302,748
5
South Carolina
+79,958
5,570,274
Largest Domestic Migration Losses
Largest Domestic Migration Gains
State
Net Domestic Migration 2025
Growth Pattern
North Carolina
+84,064
Led the country in domestic migration gain
Texas
+67,299
Large domestic gain added to natural increase and international migration
South Carolina
+66,622
Fastest state growth rate in the country
Tennessee
+42,389
Growth driven mainly by domestic migration
Arizona
+31,107
Domestic migration remained a major source of growth
Additional Insights
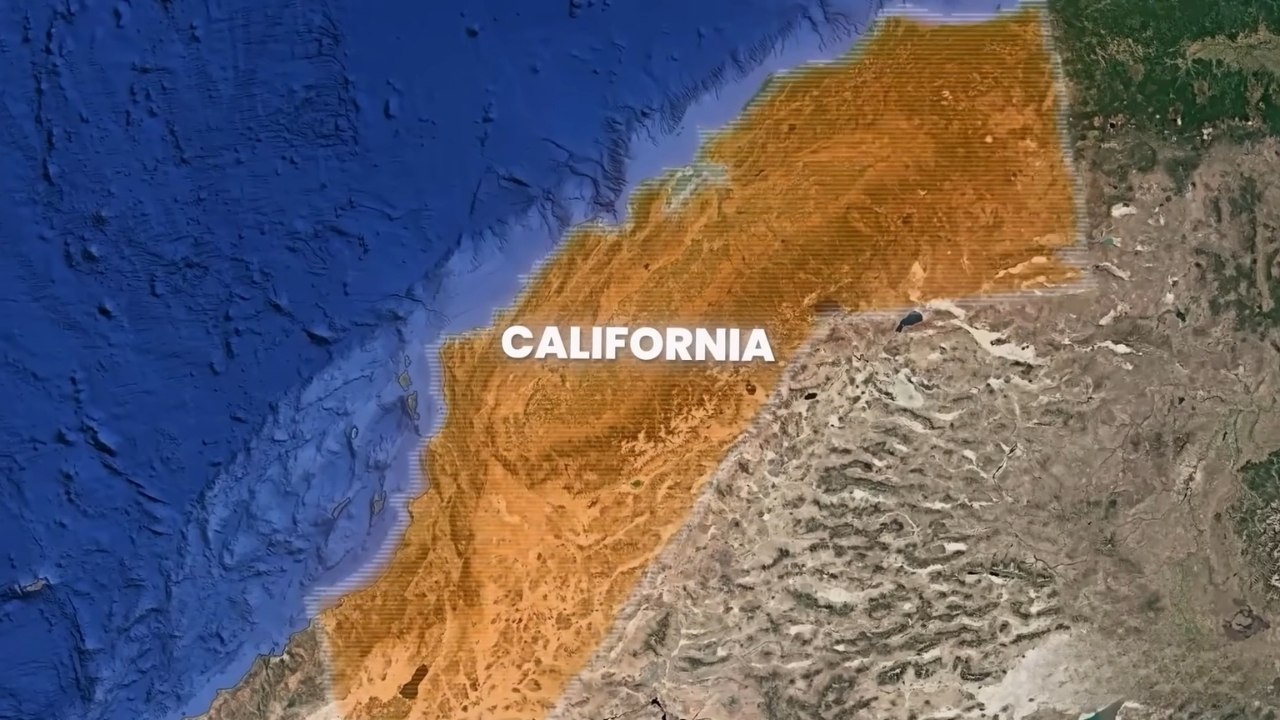
1. California And The Cost-Driven Migration Gap
California remains the most populous state, but its 2025 decline shows how domestic migration can overtake large gains from births and international migration.
The state gained 109,715 people through natural change and 109,278 through international migration. Domestic migration was -229,077, which pulled the total below the 2024 level.
2. West Virginia And The Pressure Of Natural Decrease
West Virginia lost 1,255 residents in the latest estimate year. That number looks small, yet the structure behind it matters for long-term planning.
The state gained residents through domestic migration, but deaths exceeded births by 7,887. That kind of natural decrease can weigh on school enrollment, local labor supply, health care demand, and tax bases.
3. New York Near Flat Growth After Years Of Losses
@livelovequeens New data shows New York City’s population shrunk by 12,000 people in 2025, reversing its post-pandemic rebound. IT’S NOT JUST THE RICH LEAVING ANYMORE It’s everyone. Middle-class families, young professionals, and working households are all part of the outflow. Why? ? Rent is still climbing (median near $3,500–$4,000+) ? Inventory is tight ? Housing supply still heavily skewed toward luxury units WHERE ARE THEY GOING? Not far. Most NYC residents are relocating to: • New Jersey • Long Island • Westchester • Florida, Texas, and the Carolinas Even with population decline… ? Rents are STILL rising ? Vacancy is STILL under 2% in many areas ?️ New supply is STILL not keeping up NYC isn’t shrinking. It’s rebalancing. And that creates opportunity for buyers who understand where demand is moving next. #NYCRealEstate #HousingMarket #RealEstateInvesting #CostOfLiving #MovingOutOfNYC ♬ VISITING – finetune
New York added only 1,008 residents from 2024 to 2025, a near-flat result for a state of about 20 million people. The state remains 201,269 below its 2020 estimate base.
Large international migration and positive natural change nearly balanced domestic outmigration, leaving only slight growth in the latest year.
4. Florida Growth Shifts From Domestic Moves To Immigration
Florida added 196,680 people from 2024 to 2025, the second-largest numeric gain behind Texas. The mix changed, however.
Florida recorded a natural decrease of -1,333 and domestic migration of +22,517, far lower than earlier pandemic-era domestic gains. Net international migration of +178,674 accounted for most of the latest annual increase.
5. Rural Decline Remains A County-Level Population Story
“Between July 2021 & June 2024, overall net migration rates for nonmetro counties have been higher than at any point since 1997” https://t.co/FOmKWUpVBc pic.twitter.com/6GlXME0quA
— Jim Russell (@ProducerCities) May 25, 2026
State totals can hide local losses. The USDA Economic Research Service reported that nonmetropolitan areas grew after 2020 because migration offset natural decrease, yet 51 percent of nonmetro counties still lost population between July 2020 and June 2024.
Rural decline remained visible in parts of West Virginia, Pennsylvania, the Dakotas, Nebraska, Kansas, Illinois, Iowa, California, the Mississippi Delta and Appalachia.
Methodology
Census population estimates are produced through a cohort-component method. The estimate starts with a base population, then adds births, subtracts deaths, and adds net migration. Domestic migration sums to zero nationally because every move between states adds to one state and subtracts from another. International migration affects the national total.
At the state level, the components of change may not add perfectly to the final population change because the Census Bureau uses residual adjustments to keep estimates consistent by geography and demographic characteristics.
The latest 2026-released Census data shows a country still growing, but with a thinner margin. Population decline now depends less on one national story and more on the balance inside each state: births, deaths, domestic migration, and international migration. California shows the impact of domestic outmigration in a large, high-cost state. West Virginia shows the pressure created by aging and natural decrease. New York and Illinois show how large states can remain below their 2020 base even after returning to slight annual growth. Meanwhile, Texas, Florida, North Carolina, South Carolina, and Georgia continue to absorb a large share of national growth. The next official state estimate will show whether the 2025 slowdown was a temporary adjustment or the start of a more difficult demographic period for states already close to population decline.
FAQ
Conclusion

Sources