According to the latest Annual Homelessness Assessment Report, approximately 653,100 people were experiencing homelessness in the U.S. on a single night in January 2023, a 12% increase from 2022, adding roughly 70,650 more individuals.
As of 2025, the live population of the United States is approximately 346,163,343.
The report informs funding decisions for Congress and the U.S. Department of Housing and Urban Development and is based on data collected by volunteers, local outreach staff, and shelter estimates.
Major cities like New York and Los Angeles accounted for nearly one-quarter of the total homeless population and they are the worst homeless cities, with California and Texas also home to several cities with high rates of homelessness.
Since 2020, unsheltered and chronic homelessness have seen the sharpest increases, while family homelessness grew at a slower rate, and veteran homelessness decreased.
Chronic homelessness rose by nearly 30% between 2020 and 2023, with around 143,100 people experiencing long-term patterns of homelessness, the highest number since 2007.
Despite more shelter beds being available as COVID-19 restrictions eased, 40% of people experiencing homelessness in 2023 remained unsheltered, primarily in major urban areas.
Table of Contents
Toggle23. Fort Worth, Texas
Category
Details
Homeless Population Increase
From ~1,000 in 2021 to nearly 2,500 in 2023
Pilot Program Budget
$1,096,847 for 5 months
Target Areas
7 high-impact zones (e.g., East Lancaster, Northside/Stockyards)
Number of People Targeted
80 individuals
Interventions
– 40 people: Permanent housing + mental health care
– 40 people: Counseling services only
Program Goal
70% or more remain in stable housing long-term
Potential Extension Budget
$2.2 million for an additional 12 months
Expansion Possibility
Could expand to other parts of Fort Worth
In Fort Worth, the number of people experiencing homelessness has more than doubled over the past three years, rising from just over 1,000 in 2021 to nearly 2,500 in 2023 according to a city report.
This significant increase, especially following the expiration of the federal eviction moratorium and the reduction of emergency rental assistance funds, has led the city to launch a new pilot program.
The Fort Worth City Council has approved $1,096,847 for a five-month initiative in partnership with the nonprofit My Health My Resources of Tarrant County.
Tarrant County nonprofit’s new headquarters will offer student mental health support https://t.co/KteIHaeM05
— Fort Worth Star-Telegram (@startelegram) October 10, 2024
The program will focus on seven target areas with highly visible homelessness, including the East Lancaster corridor and the Northside/Stockyards.
The pilot program aims to assist 80 long-term homeless individuals or those with severe mental illness.
Of these, 40 will receive permanent housing and mental health care, while the other 40 will receive counseling services.
The goal is for 70% of participants to achieve long-term stability in housing. If successful, the city may seek approval for an additional $2.2 million to extend the program for another year, with plans to potentially expand it to other areas of Fort Worth.
22. Atlanta, Georgia
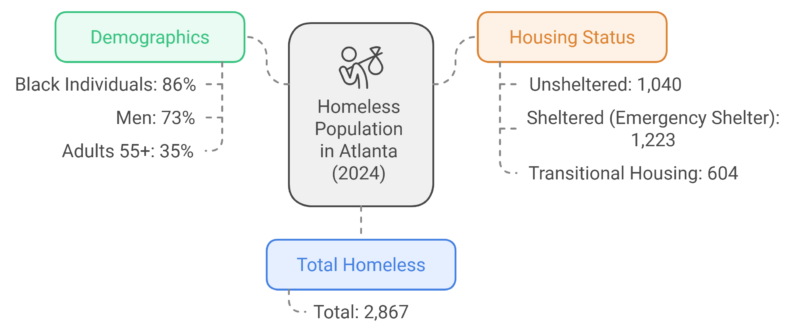
Since 2016, Atlanta has made significant progress in addressing homelessness, with a 30% decrease in the homeless population, housing over 12,500 individuals according to reports.
However, post-pandemic challenges have led to a 7% increase in unsheltered homelessness, with 2,867 people counted in 2024 across 243 neighborhoods, including 1,040 unsheltered, 1,223 in emergency shelters, and 604 in transitional housing.
Notable trends include a 22% decrease in homelessness among adults with children and 35% of homeless adults being over 55 years old.
Chronic homelessness has surged, especially among individuals with serious mental illness (6%), substance use disorders (40%), and HIV/AIDS (6%).
Black individuals represent 86% of the homeless population, and 73% of those experiencing homelessness are men. In terms of housing resources, emergency shelters are 67% utilized, transitional housing 76%, permanent supportive housing 91%, and rapid rehousing is fully utilized at 100%.
21. Houston, Texas
Category
Details
Total Homeless Population (2024)
3,280 (0.3% increase from 2023)
Decrease in Homelessness (since 2011)
60%
Decrease in Homelessness (since 2020)
17%
Unsheltered Homelessness Decline
33% over the past 4 years
Racial Composition (Black/African American)
62% of the total homeless population
Unsheltered Population (Men)
78% of the unsheltered population are men
Primary Cause of Homelessness
Job loss/lack of income
Secondary Causes of Homelessness
Family conflict, alcohol use
Funding Needed (2025 onwards)
$50 million per year (in addition to HUD)
Potential Future Increase
5,200 people could become homeless by 2026 (60% increase)
Primary Funding Sources
HUD allocations, potential local taxes, bonds, philanthropy
The Greater Houston area has made substantial progress in reducing homelessness, achieving a 60% decrease since 2011 and a 17% reduction since 2020 but still, it has the largest homeless population in America.
However, the 2024 Point-in-Time Count & Survey recorded a slight 0.3% increase in homelessness compared to the previous year, with a total of 3,280 homeless individuals counted across Harris, Fort Bend, and Montgomery counties.
While the region has seen success, largely due to a housing-first approach, concerns are growing due to the expiration of federal pandemic-era funding.
The unsheltered homeless population has declined by 33% over the past four years, thanks to various housing initiatives, but the report highlights that 62% of the total homeless population is Black or African American, indicating a racial disparity.
Additionally, 78% of the unsheltered homeless population are men.
The primary cause of homelessness in the region is job loss or lack of income, followed by family conflict and alcohol use.
Looking ahead, the coalition has identified an urgent funding gap of $50 million annually, not including the HUD allocations, which will be needed to maintain current homeless prevention programs. Without securing these funds by 2025, the coalition warns that an estimated 5,200 people who were previously housed could return to homelessness by 2026, representing a nearly 60% increase.
20. San Antonio, Texas
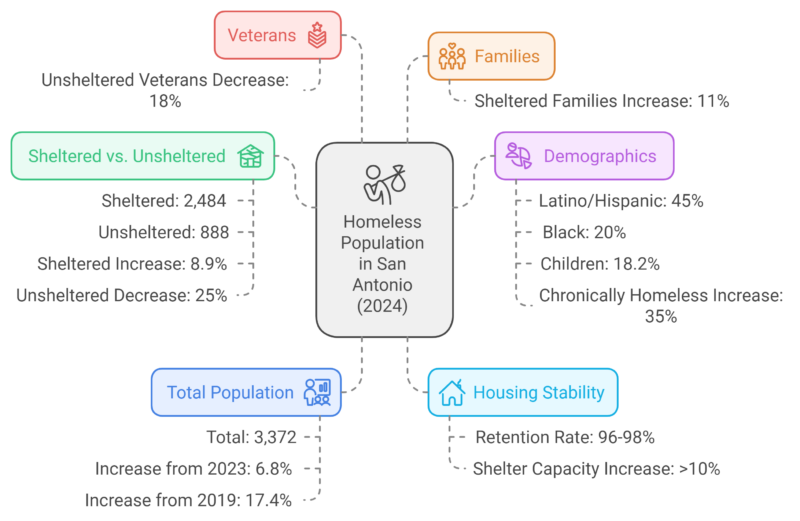
San Antonio’s homeless population increased by 6.8% in 2024, with 3,372 people experiencing homelessness, driven by inflation, rising rents, and reduced federal resources.
Sheltered individuals rose by 8.9%, while unsheltered homelessness grew slightly by 1.6% according to expressnews.
The number of chronically homeless people increased by 35%, attributed to better data collection and expanded outreach. Families with children, particularly in shelters, saw an 11% rise.
Latinos made up 45% of the homeless population, underrepresenting the general population, while Black individuals were overrepresented at 20%.
New housing solutions like Towne Twin Village are being developed to address the needs of chronically homeless individuals, with retention rates in permanent supportive housing as high as 98%.
19. Long Beach, California
Category
Details
Total Homeless Population (2024)
3,376 (2.1% decrease from 2023)
Homeless Population (2023)
3,447
Change in the Homeless Population
Decrease of 71 people
Youth Homelessness (Ages 18-34)
Decreased by 47%
Minors (Under 18)
Decreased by 37%
Homelessness (Ages 35-44)
Increased by 11%
Homelessness (Ages 45-54)
Increased by 6.2%
People Moved to Self-Sufficiency
227 during 2023
People in Permanent Housing
733 currently housed
Money Spent on Homeless Emergency
Over $60 million in federal, state, and local funds
The city of Long Beach saw a 2.1% decrease in homelessness in 2024, marking its first reduction in seven years after experiencing a 62% spike following the pandemic in 2022.
The recent count recorded 3,376 homeless individuals in January 2024, compared to 3,447 in 2023—just 71 fewer people ranking it among the worst homeless cities.
According to his website Mayor Rex Richardson expressed optimism, saying the city is “trending in the right direction” after spending more than $60 million on homelessness efforts during a declared emergency, some advocates, like Christine Berry, believe the progress is minimal, arguing that the city’s efforts are not truly benefiting the majority of unhoused individuals.
Despite a nearly 50% reduction in youth homelessness (ages 18 to 34) and a 37% drop among minors under 18, homelessness increased among people aged 35 to 44 by 11%, and among those aged 45 to 54 by 6.2%. During the homeless emergency, the city helped 227 people transition to self-sufficiency, with 733 people currently in permanent housing programs.
Berry criticized the city’s “housing first” approach, stating that it serves as a revolving door for those struggling with addiction and mental illness. She advocated for enforcing laws and offering rehabilitation as an alternative to jail, suggesting that mandatory treatment could improve outcomes for many.
18. Dallas, Texas
Category
Details
Black Population in Homelessness
The majority, despite making up only 19% of total households
Housing Initiative Investment
$72 million since 2021
Acceptance of Housing at Encampments
Over 95%
System Transformation Start
2020
Dallas and Collin counties have reported a third consecutive year of declining homelessness, with the latest count in January 2024 showing 3,718 people experiencing homelessness, a 12% decrease from 2023 and a 19% reduction since 2021 according to Keranews report.
This progress contrasts with the national rise in homelessness, highlighting the success of local strategies, particularly the “Housing First” approach. Since 2021, a $72 million initiative has focused on moving people from encampments into long-term housing with supportive services.
Housing Forward’s CEO, Sarah Kahn, and Chief Program Officer, Rae Clay, emphasized that over 95% of those contacted at encampments accept housing.
The region’s “system transformation,” launched in 2020, has contributed significantly to this progress by strengthening the homeless response network and attracting more federal funding.
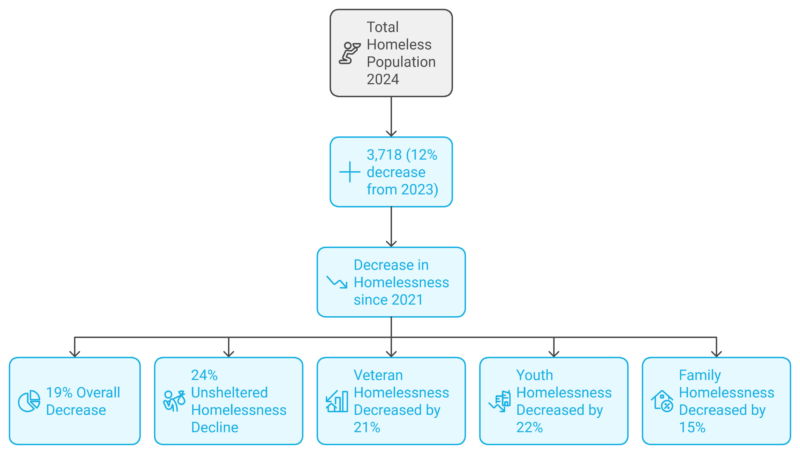
The report revealed that while veteran homelessness decreased by 21%, youth homelessness by 22%, and family homelessness by 15%, racial disparities remain, with Black individuals disproportionately represented in the homeless population despite only making up 19% of households.
Leaders stress the need to address these disparities and continue expanding efforts, particularly focusing on street-to-home solutions to sustain the momentum.
17. Miami, Florida
Category
Details
Homeless Population in Miami-Dade (2024)
3,800 total; 1,033 unsheltered
Heat Outreach Initiative Start
June 2023
Water Bottles Distributed (2024)
12,300 (Up 2,600 from 2023)
Miami Beach Homeless Population
Estimated 154
Arrests Under Anti-Camping Law
114 in June and July 2024
New State Law (Effective Oct. 2024)
Bans camping on public property allows designated encampment areas
Shelter Beds in Miami Beach
86 beds leased in shelters like Camillus House
Permanent Housing Projects
Cutler Bay hotel conversion (pending vote), $1.2M raised for Hermanos de la Calle by Miami Mayor
Health Risks of Heat Exposure
Heat stress, cramps, exhaustion, stroke
Miami-Dade County is home to approximately 3,800 homeless individuals, including 1,033 unsheltered people who are particularly vulnerable to heat stress and related health complications according to some reports.
Meanwhile, Miami Beach has introduced a more stringent approach through “Operation Summer Relief,” which aims to connect homeless residents with services like shelter and medical care.
However, individuals who refuse shelter may face arrest. This is part of a broader state law taking effect in October 2024 that will ban camping on public property but allow for designated encampment areas.
While the city emphasizes the availability of shelter beds, critics argue that the enforcement of anti-camping laws criminalizes homelessness and complicates efforts to help individuals secure permanent housing.

Miami Beach has seen 114 arrests under its anti-camping law in just June and July 2024 and it is one of among worst homeless cities because of its hot weather.
However, homeless advocates like Valerie Navarrete from Favela Miami point out that shelters are not always suitable for everyone, particularly for individuals with PTSD or those who value their autonomy.
Many homeless individuals, like Gerald Dezore, avoid shelters due to the lack of privacy and personal control.
Efforts to expand permanent housing continue, with the Miami-Dade Homeless Trust focusing on converting properties like a Cutler Bay hotel into subsidized apartments for older homeless individuals.
This strategy aligns with Miami Mayor Francis Suarez’s fundraising efforts, including a $1.2 million campaign for Hermanos de la Calle, a nonprofit supporting housing for the homeless.
16. Fresno, California
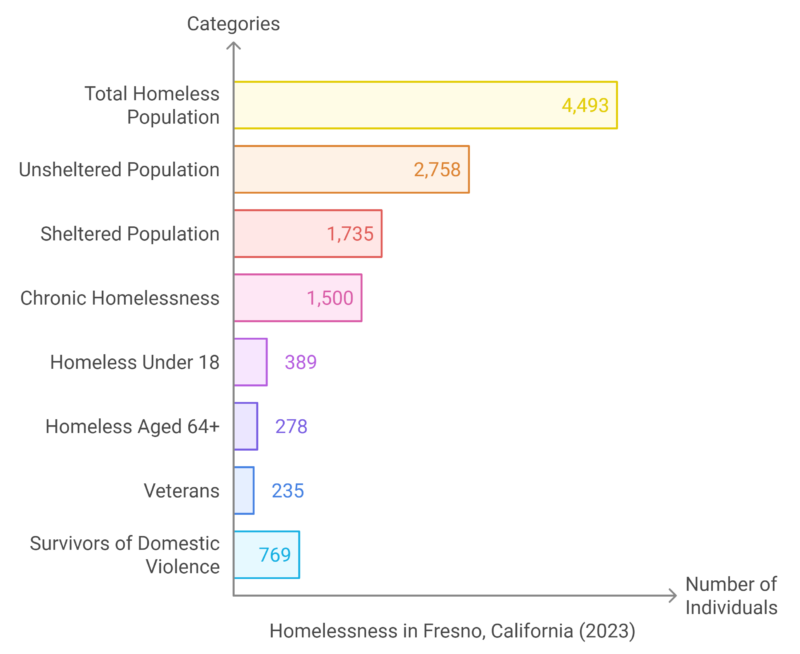
The 2023 Point-in-Time (PIT) count for Fresno and Madera counties, conducted by the Fresno-Madera Continuum of Care (FMCoC), revealed a total of 4,493 individuals experiencing homelessness, marking a 7% increase from 2022 according to a city report.
Of this population, 61% were unsheltered, 32% were staying in emergency shelters, and 7% were in transitional housing.
Key demographic findings include that 63% of the homeless population were male, 36% were female, and 1% identified as transgender, non-binary, or another gender.
Disabilities were common, with 36% reporting a substance use disorder and 33% experiencing mental health issues.
Notably, 33% of the population was chronically homeless, 9% were under 18, and 6% were over 64. Veterans made up 6% of the population, while 19% were survivors of domestic violence.
The housing inventory in 2023 included 3,814 year-round beds, a 25% decrease from 2022, but 91% of these beds were utilized at the time of the count, a significant improvement from the previous year.
15. Washington D.C
Category
Details
Total Homeless Population (2023)
4,922 (73 per 10,000 residents)
Increase in Homelessness (2022-2023)
12%
Decrease in Homelessness (since 2007)
7.5%
Unsheltered Population (2023)
17% (compared to 40% nationally)
Black Population in Homelessness
81% (compared to 45% of total population)
Senior Homelessness (55+ years)
30% (compared to 20% nationally)
Family Homelessness in D.C.
25% of the total homeless population
National Homeless Population (2023)
653,100
D.C. Housing Vouchers Added (FY 2024)
230
In 2023, Washington, D.C. recorded 4,922 people experiencing homelessness, equating to 73 per 10,000 residents, the highest concentration of homelessness in the U.S. compared to states.
Despite this, D.C. has made progress in reducing homelessness, particularly in providing shelter and decreasing family homelessness as per HUDS report. Since 2007, homelessness in D.C. has dropped by 7.5%, although the city experienced a 12% increase in homelessness between 2022 and 2023, in line with national trends.
Advocates attribute previous declines to pandemic-era rental assistance programs that have since expired, alongside rising rents and increased evictions.
D.C. has a relatively low rate of unsheltered homelessness at 17%, compared to the national average of 40%. Investments in housing programs and family homelessness prevention have contributed to this, as D.C. houses more families annually than counted in the Point-in-Time (PIT) Count.

However, homelessness among individuals in D.C. continues to rise, with those affected being disproportionately Black (81%) and older, with over 30% of D.C.’s homeless population aged 55 or older, compared to 20% nationally.
While resources to combat homelessness have grown nationwide, including a 7% increase in available beds, D.C.’s housing program investments are slowing.
Although the city added 230 new permanent supportive housing vouchers in fiscal year 2024, this is a smaller increase compared to past years. Advocates call for more rental assistance and housing vouchers to reduce homelessness in the long term.
14. Philadelphia, Pennsylvania
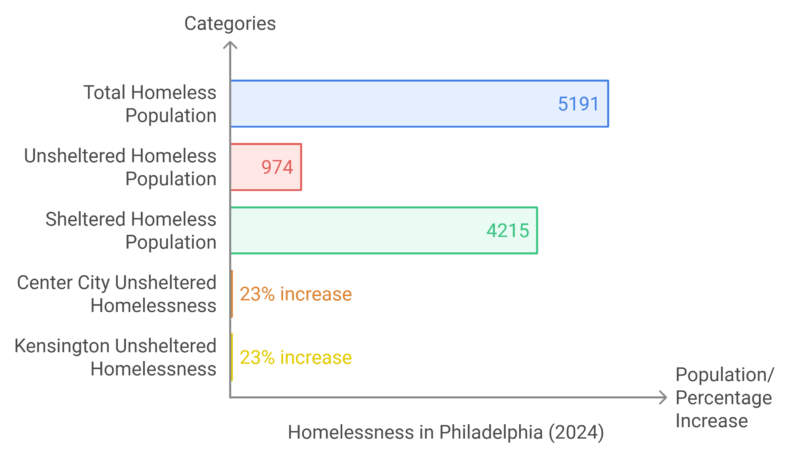
The 2024 Point-In-Time (PIT) count released by Philadelphia’s Office of Homeless Services revealed that homelessness has risen for the third consecutive year, with a total of 5,191 individuals experiencing homelessness.
The count, conducted on January 24, 2024, showed a significant 38% increase in unsheltered homelessness compared to 2023, rising from 706 to 974 individuals.
Category
Details
Emergency Shelters (Households with Children)
370 households (1,158 people, including 727 children under 18)
Emergency Shelters (Households without Children)
2,314 households (2,327 people)
Safe Haven Programs
210 households without children (219 people)
Transitional Housing (Households with Children)
124 households (311 people, including 181 children under 18)
Transitional Housing (Households without Children)
198 households (198 people)
Sheltered homelessness also increased by 5%, from 4,019 in 2023 to 4,215 in 2024.
- Citywide Increases: Nearly all areas of Philadelphia saw a rise in unsheltered homelessness. Center City and Kensington both experienced a 23% increase, with Kensington accounting for 35% of the total unsheltered population.
- Emergency Shelters: 370 households with children (1,158 people), including 727 children under 18, and 2,314 households without children (2,327 people) utilized emergency shelters.
- Safe Havens: A total of 210 households without children (219 people) were served by safe haven programs.
- Transitional Housing: 124 households with children (311 people, including 181 children under 18) and 198 households without children were served by transitional housing programs.
13. Boston, Massachusets
Category
2022
2023
% Change
Total Homeless Population
4,439
5,202
+17.2%
Single Adults (Total)
1,545
1,803
+16.7%
– Street Count
119
169
+42.0%
– Emergency Shelter
1,121
1,343
+19.8%
– Transitional Housing
238
256
+7.6%
– Safe Haven
67
35
-47.8%
Families (Total)
2,894
3,399
+17.5%
– Persons in Families (Emergency Shelter)
2,841
3,395
+19.5%
– Persons in Families (Transitional Housing)
53
4
-92.5%
The City of Boston’s 2023 homeless census, led by Mayor Michelle Wu, reported a 17.2% increase in homelessness compared to 2022.
On the night of January 30, 2023, a total of 5,202 people were counted as experiencing homelessness, up from 4,439 in 2022. This included both unsheltered individuals and those staying in shelters or transitional housing.
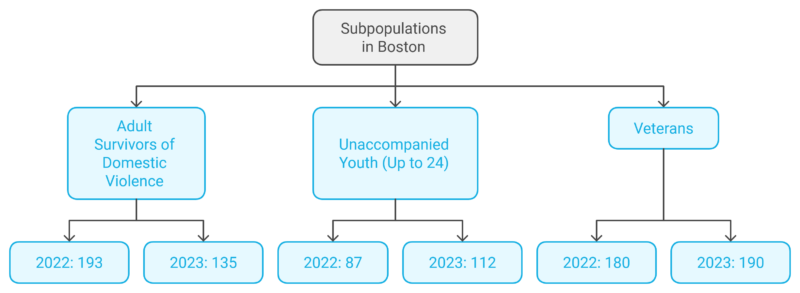
The census also revealed notable changes in specific subpopulations, such as a 42% increase in unsheltered single adults and a 28.8% rise in unaccompanied youth.
However, the number of adult survivors of domestic violence decreased by 30.1%, while the number of veterans increased slightly by 5.6%.
Despite the recent increase, homelessness in Boston has decreased by 32% since 2015, showing long-term progress even as national numbers have risen by 3% over the same period.
12. Oakland, California
Category
Details
Total Homeless Population (2024, Oakland)
5,490 (9% increase from 2022)
Unsheltered Population
67% of Oakland’s homeless population
Alameda County Homeless Population (2024)
3% decrease from 2022
Youth & Veteran Homelessness (Alameda County)
Decreased overall
Pandemic Housing Programs
Roomkey and Homekey initiatives helped transition thousands into housing
Eviction Moratorium Impact
No major spike in homelessness post-moratorium
Oakland’s unhoused population continues to grow, but the rate of growth has slowed significantly compared to previous years.
The 2024 PIT count found 5,490 people experiencing homelessness in Oakland, a 9% increase from the 2022 count, which recorded 5,055.
Approximately 67% of Oakland’s unhoused population is unsheltered, living outdoors or in vehicles.
In contrast, Alameda County saw a 3% decrease in its overall homeless population, with declines among youth and veterans.
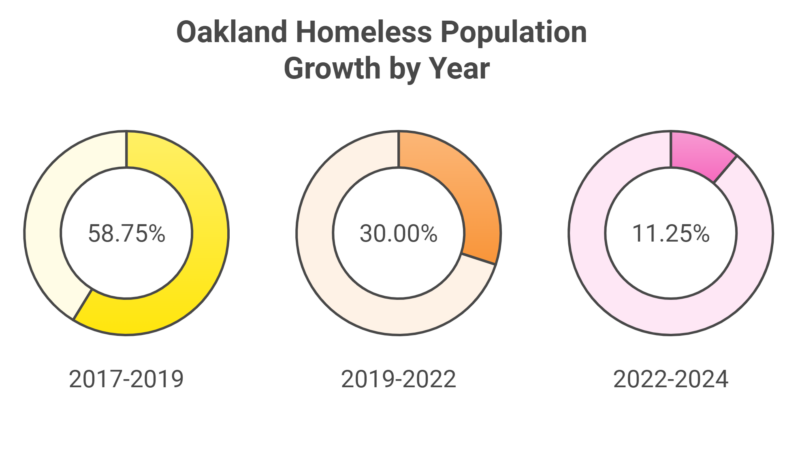
While Oakland’s homeless population has consistently grown over the past decade, the growth rate has slowed from 47% between 2017 and 2019 to 24% between 2019 and 2022, and now just 9% from 2022 to 2024.
Factors contributing to the slower growth include new housing programs, pandemic relief efforts, and stronger collaboration between Oakland and Alameda County.
During the pandemic, Alameda County moved thousands of people off the streets into temporary “Roomkey” hotels, many of whom were later transitioned into permanent housing.
Oakland has also received nine state “Homekey” awards to convert buildings into supportive housing. The end of COVID-19 eviction moratoriums in 2023 raised concerns about a potential spike in homelessness, but so far, no major increase has materialized.
11. Chicago, Illinois
Category
Details
Expedited Housing Initiative
330 households housed since 2020
Demographic Breakdown
69% Black Non-Hispanic, 14% White Non-Hispanic, 14% Hispanic/Latino/a/x
Household Composition
32% in households with children; 68% in households without children
Gender Identity
62% male, 37% female (sheltered); 79% male, 21% female (unsheltered)
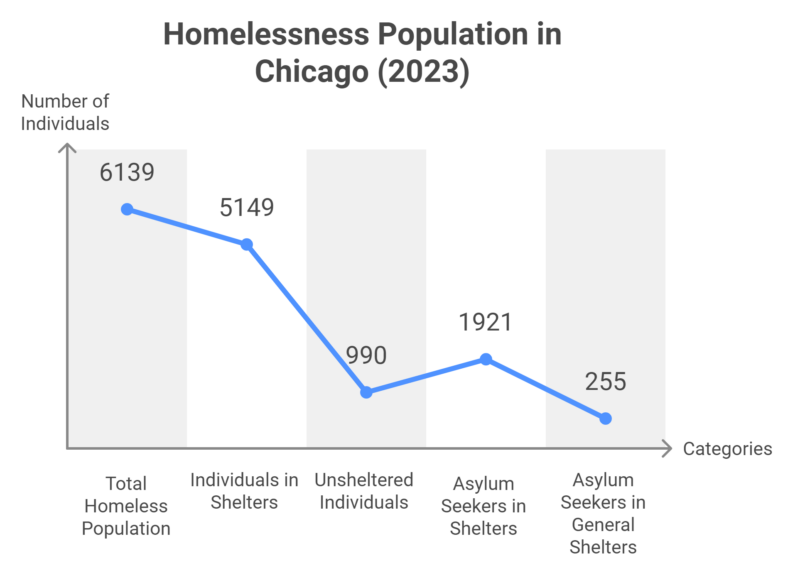
The 2023 Point-In-Time (PIT) Count in Chicago revealed a total of 6,139 individuals experiencing homelessness according to city officials.
Of these, 5,149 were residing in homeless shelters, and 990 were unsheltered, a decrease from 1,263 in 2022.
The PIT Count was conducted by the Chicago Department of Family and Support Services in collaboration with All Chicago, following U.S. Department of Housing and Urban Development (HUD) guidelines.
This year’s count also included 2,196 asylum seekers, primarily from Latin American countries, who accounted for 42% of the population in shelters.
The increase in shelter utilization (14%) from 2022 to 2023 was likely driven by the end of COVID-19 relief resources and a decrease in the pandemic’s prevalence in shelters.
Chicago has also made strides in reducing unsheltered homelessness, partly due to the Expedited Housing Initiative, which has housed over 330 unsheltered households since 2020.
10. Portland, Oregon
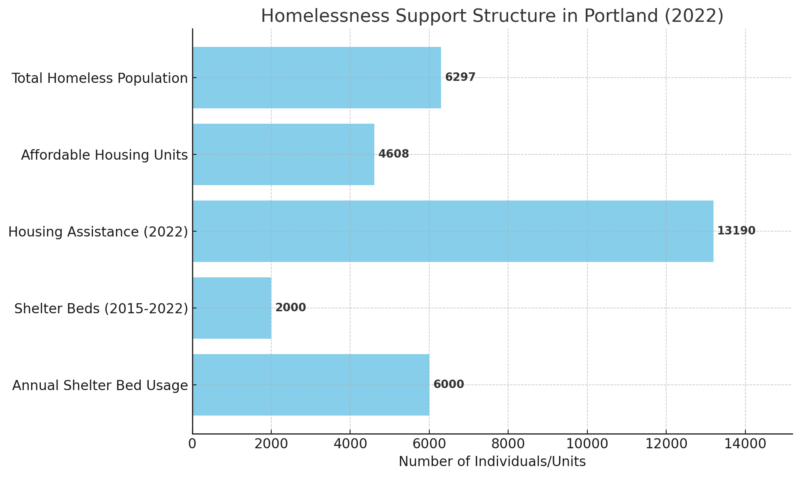
The homelessness crisis in Portland has grown significantly, with a 65% increase in homelessness from 2015 to 2023, as the population of unhoused individuals rose from 1,887 to 6,297.
Despite the city spending $1.7 billion on affordable housing and related services, including opening 4,608 affordable housing units and providing housing subsidies for 35,550 people in 2022, many Portlanders seeking affordable housing still face long waitlists.
In 2022, 13,190 people received permanent housing assistance, yet the demand continues to outpace available resources.
Shelter availability has increased but still falls short of the growing need. Shelter beds in Multnomah County increased from 800 in 2015 to 2,000 by 2022, and about 6,000 individuals use these beds each year.
The annual increase in housing placements is the largest since @multco_johs launched in July 2016, driven by a surge in people newly served by the Supportive Housing Services Measure. Nearly 7,900 also entered shelter last year – a nearly 35% increase: https://t.co/R4lu2rpYMA pic.twitter.com/CccI4pDhBE
— Multnomah County, OR (@multco) August 22, 2024
However, the crisis is compounded by personal challenges such as untreated mental illness and substance abuse. It is estimated that 58-88% of individuals on the streets struggle with substance use, particularly fentanyl, which has become the leading cause of death for people under 50.
Category
Details
Substance Use Among Homeless Individuals
58-88%
Fentanyl-Related Overdoses
Leading cause of death for those under 50
Camps Evaluated per Day
115 locations
Camps Cleared per Day
16 locations
The presence of hundreds of unsanctioned camps across Portland’s 146 square miles adds further complexity to addressing homelessness.
The city evaluates an average of 115 locations daily for safety and sanitation violations, clearing around 16 locations per day.
9. Sacramento, California
Category
Details
Total Homeless Population (2024)
6,615 (28.7% decrease from 2022)
Sheltered Population
2,671 (2.2% increase from 2022)
Unsheltered Population
3,944 (40.8% decrease from 2022)
Households with Minor Children
16.7% of total population
Age Distribution
83.3% over 24 years, 6.6% between 18-24, 10.1% under 18
Gender Distribution
Nearly 2:1 ratio of males to females, 5% gender non-conforming
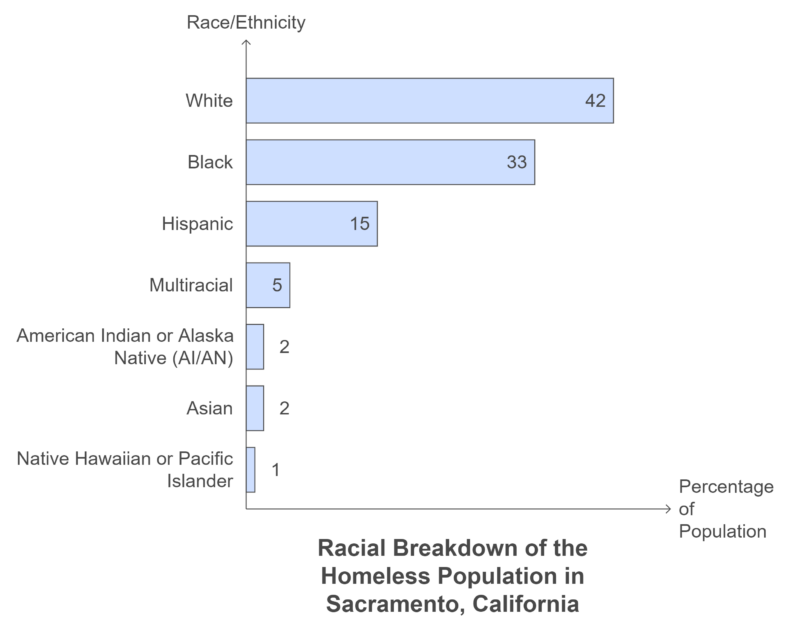
Racial Breakdown
See table below
Racial Breakdown of the Homeless Population
The 2024 Point-in-Time (PIT) Count in Sacramento recorded a total of 6,615 people experiencing homelessness, marking a significant 28.7% decrease from the 2022 count.
The sheltered population saw a slight increase of 2.2%, rising to 2,671 individuals, while the unsheltered population dropped sharply by 40.8%, down to 3,944 individuals.
Among the homeless population, 16.7% were in households with minor children, with the vast majority (83.3%) being over the age of 24.
There is a notable gender disparity, with nearly twice as many males as females, and 5% of the population identifying as gender nonconforming.
8. Las Vegas, Nevada
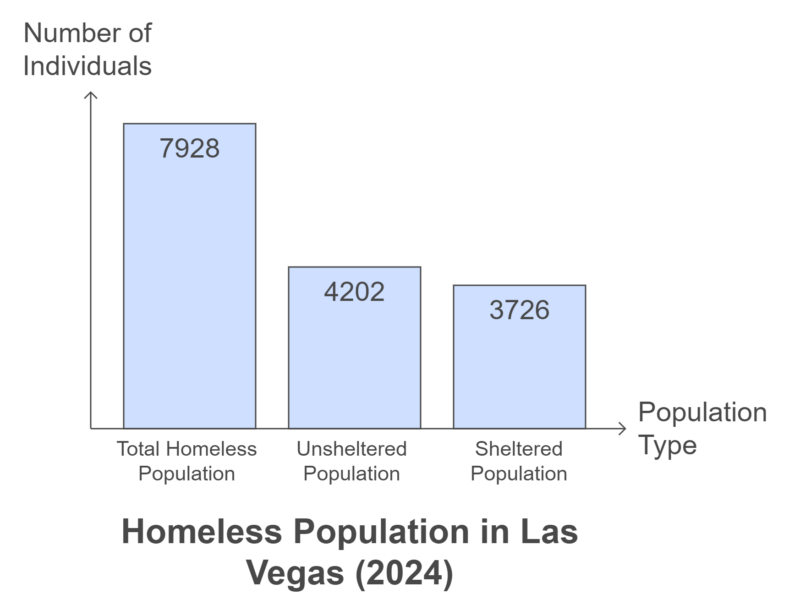
Las Vegas, Nevada homeless population has reached a 10-year high, with 7,928 people experiencing homelessness as of January 25, 2024, marking a 56% increase over the past three years.
Of this total, 4,202 individuals were unsheltered, while 3,726 were in shelters, transitional housing, or safe havens as per 8news notes.
The preliminary data highlights the severity of the crisis, showing Clark County’s homeless population is nearly four times the national average, and it grew by over 1,350 individuals in just the past year.
Although the county is working to improve its processes for evaluating and prioritizing those in need, the current resources are insufficient to meet the growing demand for housing.
Category
Details
Housing Referral Rate
1 in 8 individuals receives a referral
Length of Shelter Stay
71 days (2024, down from 111 days in 2018)
Supportive Housing Openings
7 per month (Rapid Re-Housing & PSH)
Return to Homelessness Rate
28.59% in 2023 (Up from 25.00% in 2022)
Demographic Breakdown
60% male, 42% Black/African-American, 22% aged 35-44
HUD’s analysis found that only 1 in 8 individuals entering the system receive a housing referral, illustrating the scale of the challenge.
The length of stay in shelters has decreased in Clark County, from 111 days in 2018 to 71 days in 2024, compared to a national average of 158 days.
However, the county’s rate of return to homelessness has been increasing, reaching 28.59% in 2023, well above the national rate of 16.5%.
7. San Francisco, California
Category
2022
2024
% Change
Total Homeless Population
7,754
8,323
+7%
Sheltered Population
3,357
3,969
+18%
Unsheltered Population
4,397
4,354
-1%
Chronic Homelessness
2,899
2,989
+3%
Veterans
605
587
-3%
Families with Children
605
1,103
+82%
Unaccompanied Youth
1,073
1,118
+4%
Sheltered Families (with children)
N/A
68%
N/A
Unsheltered Families
N/A
32%
N/A
LGBTQ+ Homeless Population
28%
28%
No Change
Substance Use (Self-Reported)
52%
51%
-1%
- San Francisco’s homeless population grew by 7%, from 7,754 in 2022 to 8,323 in 2024, driven by persistent economic challenges and rising housing costs according to a San Francisco city source.
- The sheltered population rose significantly by 18%, reflecting the city’s efforts to provide more temporary shelters.
- The unsheltered population remained nearly the same, with only a 1% decrease, suggesting that many people remain without access to shelters despite efforts to increase capacity.
- There was a 3% increase in chronic homelessness, meaning more people are staying homeless for longer periods and with disabling conditions.
- The number of homeless veterans slightly decreased by 3%, but 80% of veterans remain unsheltered, indicating the need for more targeted veteran services and housing solutions.
- A notable 82% increase in families experiencing homelessness (from 605 to 1,103) suggests that family homelessness has worsened significantly, possibly due to eviction and housing affordability issues.
- 68% of these families are in shelters, while 32% remain unsheltered, showing both an improvement in shelter provision and a need for more permanent housing solutions for families.
- There was a 4% rise in youth homelessness, reflecting continued challenges in addressing the needs of younger populations who may have aged out of foster care or are without family support.
- LGBTQ+ individuals remain overrepresented in the homeless population, with 28% identifying as LGBTQ+, compared to around 12% in the general population.
- Substance use remains a significant issue among the homeless population, with 51% reporting drug or alcohol abuse. Although this is a 1% decrease from 2022, it continues to be a major barrier to stable housing and long-term recovery.
6. Phoenix, Arizona
Category
Details
Total Homeless Population (2024)
9,435 (slight decrease from 9,642 in 2023)
Sheltered Population
Increased compared to 2023
Unsheltered Population
Decreased compared to 2023
Shelter Capacity in Phoenix
Phoenix added 83% of new shelter beds in Maricopa County since COVID-19
Number of People Sheltered at St. Vincent de Paul
320 nightly
The report in Maricopa County recorded 9,435 individuals experiencing homelessness on January 22, 2024, a slight decrease from last year’s count of 9,642.
The count showed a reduction in the number of unsheltered people while the number of people in shelters increased.
This pattern was seen both countywide and in Phoenix, which is one of the worst homeless cities.
Jessica Berg, the chief program officer at St. Vincent de Paul, noted that their shelter remains full almost every night, housing around 320 people.
Phoenix Mayor Kate Gallego attributed the drop in homelessness to efforts like increasing shelter capacity, with Phoenix contributing 83% of new shelter beds in Maricopa County since COVID-19.
However, Mayor Gallego emphasized that the rise in evictions outside Phoenix shows that other communities need to contribute more to address the issue countywide.
The count also revealed that homelessness in Maricopa County has been steadily increasing since 2020, despite the efforts to expand shelter capacity.
Rainy weather on the day of the count may have driven more individuals to seek shelter, which affected the data.
5. Denver, Colorado
Category
Details
Total Homeless Population (2024, Metro Denver)
9,977 (10% increase from 2023)
Sheltered Population (Metro Denver)
Increased by 12%
Chronically Homeless Population
Increased by 16%
Families Experiencing Homelessness (Metro Denver)
Increased by 49%
Total Homeless Population (2024, Denver)
6,539 (12% increase from 2023)
Unsheltered Population (Denver)
Decreased by 10.5%
Unsheltered Family Homelessness (Denver)
Dropped by 82.5%, from 103 to 18
Reduction in Tent Encampments (Denver)
23% drop, from 242 tents to 117
Funding for Shelters (Denver)
Over $100 million invested
Excluded from PIT Count
4,300 new immigrants in temporary shelters
Homelessness in the Denver metro area increased by 10% in 2024, with the Metro Denver Homeless Initiative’s count showing 9,977 people experiencing homelessness, up from 9,065 in 2023.
The growth is largely driven by a 12% increase in shelter usage, though the number of unsheltered individuals in Denver itself decreased by about 10.5%.
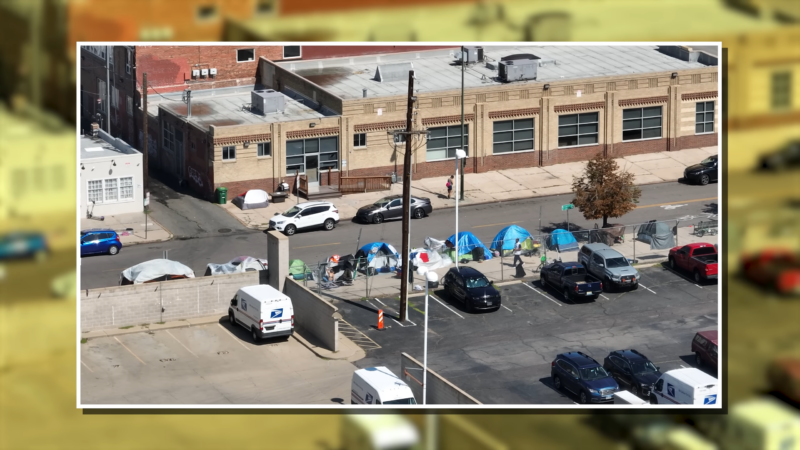
In Denver specifically, the homeless population rose by 12%, reaching 6,539 people in 2024 compared to 5,818 in 2023.
Despite the rise in total homelessness, there was a notable 82.5% drop in unsheltered family homelessness, from 103 to 18 families.
The city has invested over $100 million to open non-congregate hotel shelters and micro-communities, contributing to a reduction in outdoor tent encampments by 23% according to Denverite.
4. San Diego, California
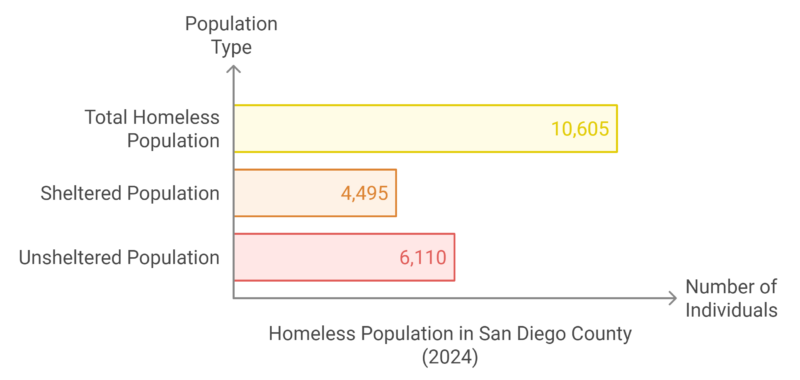
The 2024 PIT count found 10,605 people experiencing homelessness in San Diego County, reflecting a 3% increase over the 2023 count of 10,264. The count identified 6,110 unsheltered individuals and 4,495 in shelters or transitional housing according to CBS8.
Notably, there was a 44% increase in people living in their cars. However, the number of people in shelters decreased due to the loss of federal emergency funding and the shift toward safe sleeping and parking sites, which are considered unsheltered by federal standards.
Category
Details
Increase in People Living in Cars
44%
Safe Sleeping Site Population (San Diego)
472 people
Safe Parking Site Population (San Diego)
285 people
Regional Spikes in Homelessness (North San Diego County)
Encinitas (68%), Carlsbad (86%), Vista (93%), San Marcos (1,600%)
First-Time Homelessness in County
81% of people counted
Elderly Population
Oldest person found was an 85-year-old Hispanic woman
Top Challenge
The sky-high cost of housing
Total Homeless Population (2023)
10,264 (includes 5,171 unsheltered and 5,093 in shelters)
The number of homeless people increased by about 200 across different regions of the county, with significant spikes seen in North San Diego County cities, including a 68% increase in Encinitas, 86% in Carlsbad, and 93% in Vista. San Marcos saw the largest increase, with unsheltered homelessness rising by more than 1,600%.
The report also highlighted the region’s ongoing housing crisis, driven by the high cost of housing, which is causing a rise in homelessness among seniors, veterans, and families with children.
Efforts by local communities, such as Vista’s new navigation center and increased outreach work, are seen as positive steps in addressing the crisis, though the need for affordable housing remains critical
3. Seattle, Washington
Category
Details
Total Homeless Population (2024, King County)
16,000+ (23% increase from 2022)
Unsheltered Population
9,810 (27.7% increase from 2022)
Sheltered Population
6,575 (15.7% increase from 2022)
Previous Unsheltered Population (2022)
7,685
Challenges
Budget cuts could reduce shelter beds, services
Key Cause
Lack of affordable housing in the region
In 2024, more than 16,000 people were reported as experiencing homelessness in King County, marking the largest number ever recorded in the region through the Point-in-Time (PIT) Count.
Seattle Times notes that this represents a 23% increase compared to the 2022 count. The number of people living outdoors, in vehicles, or other unfit places rose dramatically by 27.7%, from 7,685 in 2022 to 9,810 in 2024. Sheltered homelessness also saw a 15.7% increase, bringing the total sheltered population to 6,575 people.
The rise in homelessness follows years of efforts to reduce its visibility, particularly in downtown Seattle, where removing tents and addressing homelessness has proven uniquely challenging.
View this post on Instagram
A post shared by King County Regional Homelessness Authority (@kingcorha)
Despite these efforts, the King County Regional Homelessness Authority is facing potential budget cuts for next year, which may lead to a reduction in shelter beds and other critical services that help transition people from homelessness to permanent housing.
Seattle officials, including Mayor Bruce Harrell’s office, acknowledged the seriousness of the issue, while King County representatives emphasized that the growing homeless population is directly tied to a shortage of affordable housing in the region.
2. Los Angeles, California
Category
Details
Total Homeless Population (2024, LA County)
75,312 (0.3% decrease from 2023)
Unsheltered Population (2024)
Decreased by 5.1%
Sheltered Population (2024)
22,947 people
Tents, Vehicles, and Makeshift Shelters
Decreased by 9.2% from 23,438 to 21,288
Veterans Experiencing Homelessness
2,991 (22.9% decrease from 2023)
Transitional Age Youth (18-24)
2,406 (16.2% decrease from 2023)
Homeless Families
10,710 families (2.2% increase from 2023)
Black/African American Population
31% of homeless population (8% of county population)
Homeless with Mental Illness
15,666 (21% of homeless population)
Homeless with Substance Use Disorder
17,248 (23% of homeless population)
Regions with Highest Homelessness
Metro LA (26%), South LA (20%), San Fernando Valley (15%)
Regional Increases
San Fernando Valley (+2%), Antelope Valley (+42%)
Percentage Under Age 18
9%
Female Homeless Population
33%
Chronically Homeless Population
40%
Domestic Violence Survivors
37% experienced domestic violence, 9% fleeing violence
On June 28, 2024, the Los Angeles Homeless Services Authority (LAHSA) released the results of the 2024 annual homeless count, revealing a slight decrease in homelessness across Los Angeles County. Homelessness decreased by 0.3% in the county overall and by 2.2% within the city of Los Angeles according to LAALMANAC.
In 2024, an estimated 75,312 people experienced homelessness in Los Angeles County, with 22,947 of them sheltered. Unsheltered homelessness saw a 5.1% decrease, and the number of visible tents, vehicles, and makeshift shelters dropped by 9.2% from 2023 to 2024.
Notable improvements included a 22.9% decrease in homeless veterans, a 16.2% drop in transitional-age youth (18-24), and a slight reduction in those suffering from mental illness and substance use disorder according to a study from NCBI.
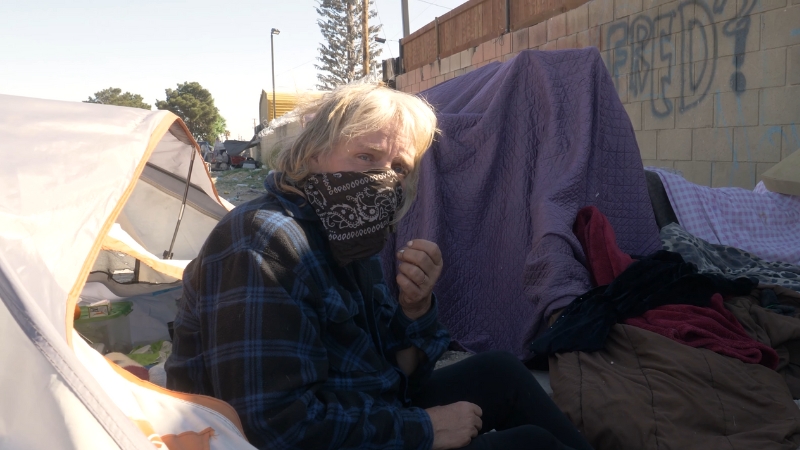
Despite these changes, challenges remain, particularly for Black/African Americans, who continue to be overrepresented in the homeless population, making up 31% of the homeless but only 8% of the county’s population.
Additionally, 40% of the homeless population was identified as chronically homeless, and 37% had experienced domestic violence, with 9% fleeing intimate partner violence.
1. New York, New York
Category
Details
NYC Schoolchildren Experiencing Homelessness
119,320 during the 2022–2023 school year
Primary Causes of Homelessness
Lack of affordable housing, eviction, overcrowding, domestic violence, job loss
Affordable Housing Lost (1996–2017)
1.1 million units
Affordable Housing Vacancy Rate
Less than 1%
Single Adults with Disabilities
65% in shelters
Families with Disabilities
43% of families with children, 75% of adult families in shelters require accommodations
Demographics of Heads of Household in Shelters
56% Black, 32% Hispanic/Latinx, 7% White
Average Length of Stay in Shelters (2023)
412 days (single adults), 437 days (families with children), 750 days (adult families)
Right to Shelter Law
In place since 1981, has sheltered over 1 million people
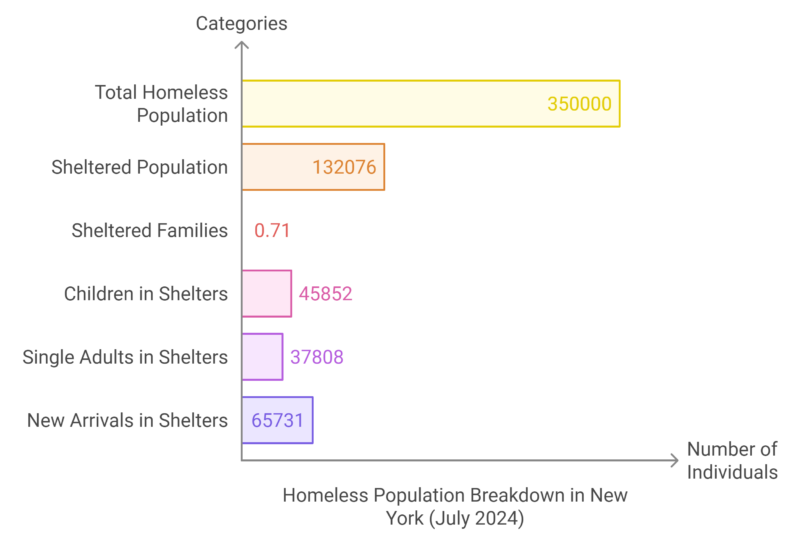
Homelessness in New York City reached record levels in July 2024, with more than 350,000 people estimated to be without homes according to a Coalition For The Homeless, and representing the number one ranking on this stat in the USA.
This includes 132,076 individuals in shelters each night, thousands more sleeping unsheltered in public spaces, and over 200,000 people temporarily doubled up in others’ homes ranking it the worst homeless city.
Families represent 71% of the sheltered population, including 45,852 children.
Additionally, 37,808 single adults stayed in shelters. A significant portion of the shelter population—45%, or 65,731 individuals—were New Arrivals.
Homelessness in NYC is driven primarily by the lack of affordable housing, with factors like eviction, overcrowded housing, domestic violence, and job loss serving as immediate causes.
The city lost 1.1 million affordable housing units between 1996 and 2017, and the affordable housing vacancy rate is now less than 1% according to NYC.gov.
NYC lost 1.1 million units of affordable housing between 2010 and 2017, and exceeded the capacity for Section 8 voucher availability by hundreds of thousands in the 7 day period the application was open. Increasing rents doesn’t help people stay housed. https://t.co/SzSwkiVuCi
— th_Redd (@robynasaldino) June 17, 2024
Homeless families mainly come from poorer neighborhoods in clustered zip codes, but homelessness affects all NYC districts.
Single adults experiencing homelessness have higher rates of mental illness and substance use disorders compared to families.
Additionally, 43% of families with children, 65% of single adults, and 75% of families without minor children in shelters have a disability requiring special accommodation.
Black and Hispanic/Latinx New Yorkers are disproportionately impacted, with 56% of heads of household in shelters being Black, and 32% Hispanic/Latinx.
The average length of stay in the Department of Homeless Services (DHS) shelter system in City Fiscal Year 2023 was lengthy, with single adults staying 412 days, families with children staying 437 days, and adult families staying 750 days.
The city’s “Right to Shelter” law has provided critical shelter support since 1981, helping more than one million New Yorkers
Methodology
- Conducted research using reputable sources, government reports, and homelessness assessments.
- Focused on cities with significant homeless populations, including New York, Los Angeles, and Seattle.
- Collected and analyzed data to identify trends such as increases in chronic homelessness and racial disparities.
- Investigated root causes of homelessness, including mental health issues, housing shortages, and economic challenges.
- Synthesized findings into a clear and original narrative, linking statistics with contributing factors.
Sources
- HUDUSER.gov – Annual Homeless Assessment Report
- Fortworth.gov – Report
- Partnersforhome.org – City Of Atlanta 2024
- Nbcdfw.com – Fort Worth launches $1M pilot program to combat rising homelessness in local areas
- Coalition For The Homeless – THE WAY HOME CONTINUUM OF CARE 2024 ANALYSIS OF THE POINT-IN-TIME COUNT & SURVEY OF PEOPLE EXPERIENCING HOMELESSNESS
- Expressnews.com – Number of homeless people in the San Antonio area jumps nearly 7%, annual count shows
- Rex Richardson – The H.O.P.E Plan
- Keranews.org – Homelessness on the rise nationwide, but down in Dallas and Collin counties
- Flhealthcharts.gov – Homeless estimates
- Cbsnews.com – “Operation Summer Relief” helps protect Miami Beach’s homeless population from the heat
- Favelamiami.org – What do We Do
- FRESNO-MADERA CONTINUUM OF CARE – 2023 POINT-IN-TIME COUNT EXECUTIVE SUMMARY
- Huduser.gov – The 2023 Annual Homelessness Assessment Report (AHAR) to Congress
- Dc.gov – District of Columbia Interagency Council on Homelessness
- Phila.gov – City of Philadelphia Point-In-Time Homeless Count Winter 2024
- Boston.gov – Annual Homeless Census
- Oaklandside.org – Homelessness grew 9% in Oakland—but it’s slowing down
- Portland.gov – Homelessness and Behavioral Health
- Sacramentostepsforward.org – Homelessness Point-In-Time Count Results 2024
- 8newsnow.com – Homeless population hits 10-year high in Clark County, report show
- Azmag.gov – 2024 Point-in-Time (PIT) Count Report Maricopa Regional Continuum of Care
- Tableau.com – Point In Time Count
- Denverite.com – It’s been one year since Mike Johnston became Mayor. What has he done?
- Laalmanac.com – Homelessness in Los Angeles County 2024
- Sleet DA, Francescutti LH. Homelessness and Public Health: A Focus on Strategies and Solutions. Int J Environ Res Public Health. 2021 Nov 6;18(21):11660. doi: 10.3390/ijerph182111660. PMID: 34770173; PMCID: PMC8583397.
- Coalitionforthehomeless.org – Basic Facts About Homelessness: New York City
- Nyc.gov – Spotlight: New York City’s Housing Supply Challenge
Related Posts:
- 5 U.S. States With the Highest Population Growth in…
- Map of Texas - Cities, Geography, Counties & Stats (2025)
- Map of Pennsylvania - Cities, Geography, Counties &…
- Map of California - Cities, Geography, Counties &…
- Map of Colorado - Cities, Geography, Counties & Stats (2025)
- Map of Massachusetts - Geography, Cities, Counties &…


