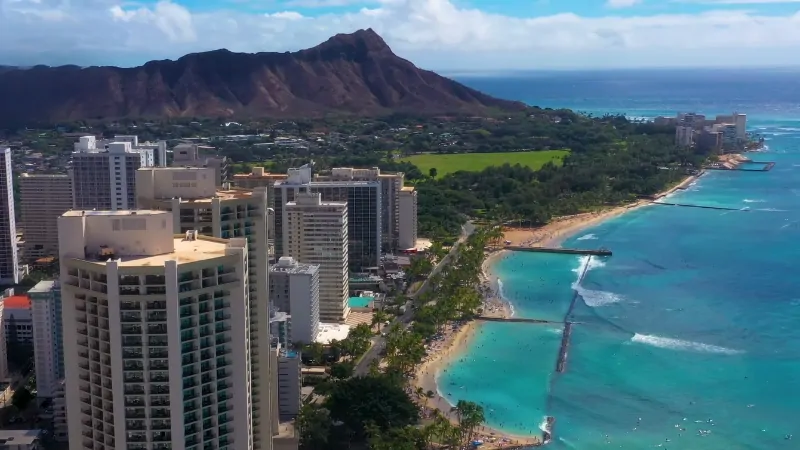
Honolulu, the capital city of Hawaii and the county seat of Honolulu County, has a 2025 population of 350,429 according to World Population Review.
Situated on the island of Oahu, it serves as a key gateway to both Hawaii and the mainland United States, as well as a major hub for tourism, international business, and military defense.
With an annual growth rate of 0.27%, Honolulu’s population has increased by 0.94% since the 2020 Census, which recorded 347,181 residents.
As of 2025, the metro area population of Honolulu is projected to be 928,000, reflecting a 0.87% increase from 2025 as per Macrotrends.
Key Takeaways
Honolulu’s Growth and History
View this post on Instagram
Honolulu, located in Oahu, has seen slower population growth compared to the rest of Hawaii, partly due to its high cost of living.
While Oahu’s population grew 8.8% from 2000 to 2010, Honolulu’s growth has been modest since 1990.
@geography_joe Replying to @CodyG #greenscreen Why does over 70% of #Hawaii live on just #Oahu alone? Considering the state is made up of 8 #islands, including the larger #BigIsland and #Maui, how did Oahu end up home to so much of Hawaii’s #population? The main answer? #Honolulu. Hawaii became a territory of the #US in 1898, and became the 50th state in 1959. Its population today is roughly 1.44 million. What #state should I cover next? #populationmap #populationdensity #history #geography #geographyjoe #map #maps #states #usa #america ♬ original sound – geography_joe
Originally inhabited by Polynesians, Honolulu became a key center of commerce after Kamehameha III made it the Hawaiian Kingdom’s capital in 1845.
Its history includes the 1893 monarchy overthrow, U.S. annexation in 1898, and the 1941 Pearl Harbor attack. Today, it remains Hawaii’s largest city and a major economic hub.
Age Distribution in Honolulu
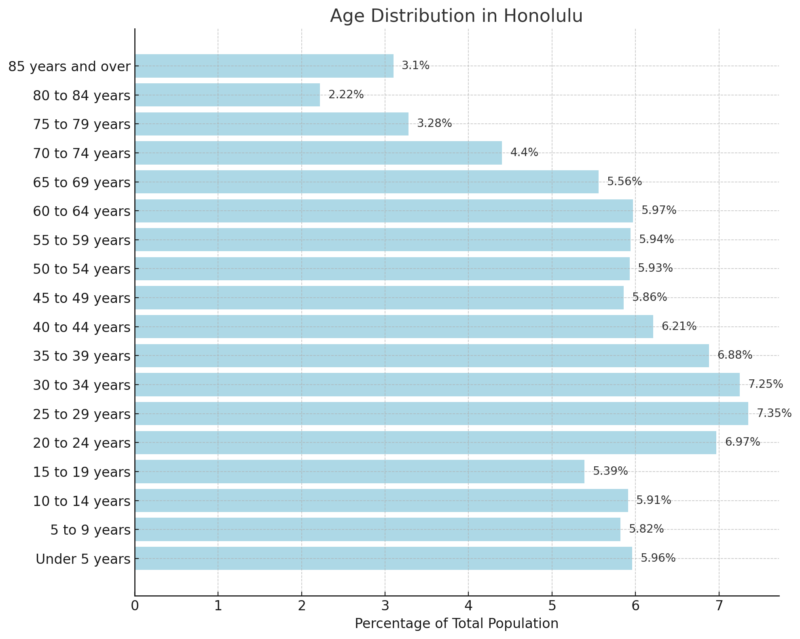
The median age in Honolulu County is 38.8 years, according to 2018-2022 ACS 5-Year Estimates.
The population distribution is as follows:
- 17.69% are under 15 years old
- 19.71% are between 15 and 29 years
- 44.04% fall within the 30 to 64 age group
- 15.46% are aged 65 to 84
- 3.10% are 85 years and older
Ethnic and Racial Diversity
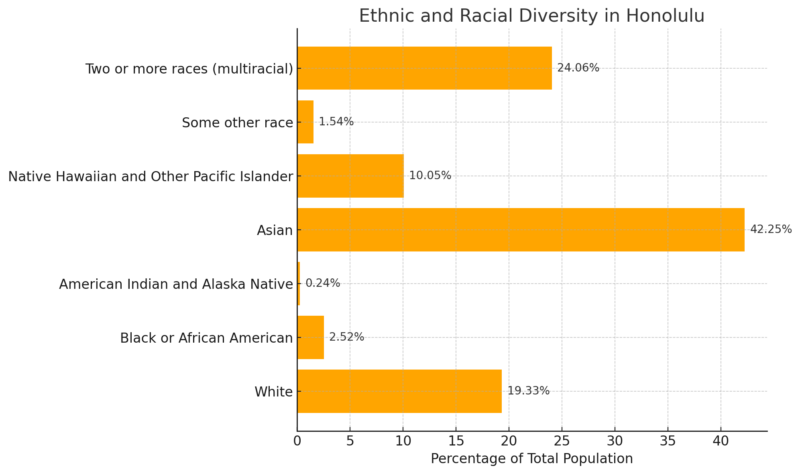
Honolulu has a highly diverse population, with Asian residents making up the largest racial group at 42.25%, reflecting the strong historical influence of East Asian and Southeast Asian immigration.
The multiracial population is also significant at 24.06%, highlighting the city’s long history of ethnic integration and intermarriage according to Neilsberg.
Native Hawaiians and other Pacific Islanders comprise 10.05% of the population, representing the indigenous people of Hawaii and surrounding islands.
White residents account for 19.33%, while Black or African Americans make up a small minority at 2.52%.
The presence of American Indian and Alaska Native residents is minimal at 0.24%, while those identifying with “some other race” make up 1.54% of the total.
The high percentage of multiracial individuals reflects Hawaii’s unique cultural blending, distinguishing it from most other U.S. states.
Honolulu Area Economic Summary
Average Weekly Wages
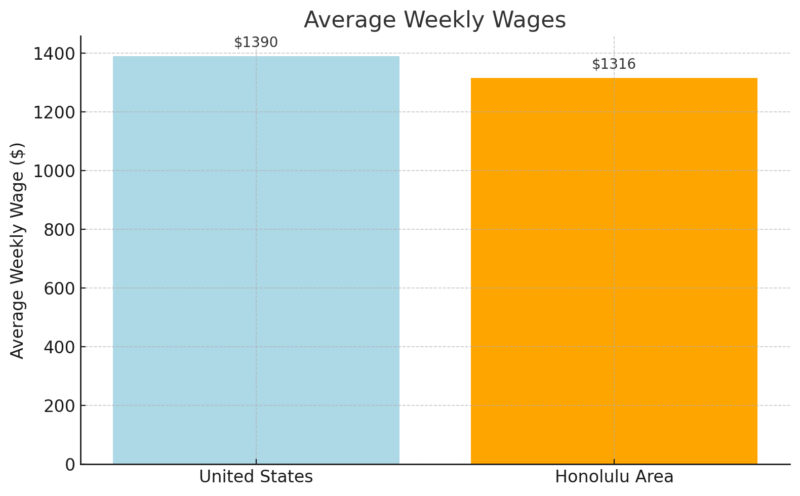
Honolulu’s average weekly wage of $1,316 is 5.3% lower than the national average of $1,390.
This wage gap may reflect Hawaii’s reliance on tourism and service-oriented industries, which typically offer lower wages compared to mainland industries such as finance and technology.
Additionally, Honolulu’s high cost of living reduces the real purchasing power of workers.
Unemployment Rates – 12-Month Comparison
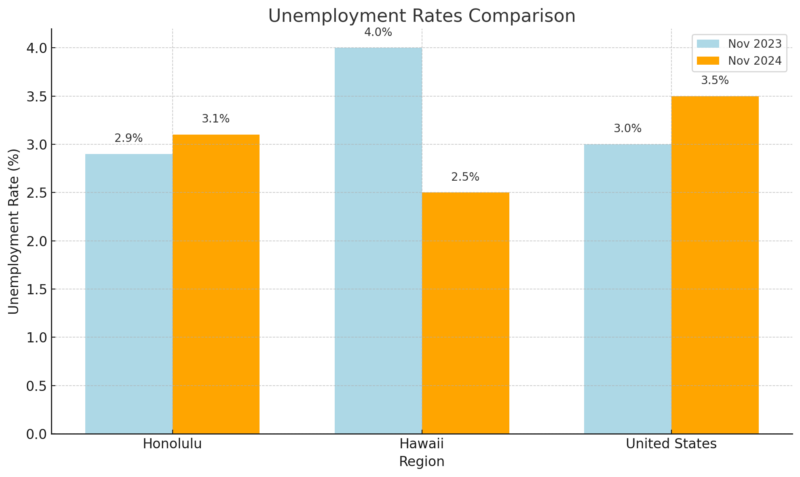
Honolulu’s unemployment rate rose slightly from 2.9% to 3.1% over the year, while Hawaii as a whole saw a significant drop from 4.0% to 2.5%.
Nationally, unemployment also increased to 3.5%, suggesting broader economic shifts according to BLS.
Honolulu’s increase could be linked to fluctuations in tourism, seasonal job losses, or slower economic expansion compared to other areas in Hawaii.
Employment by Major Industry Sectors
Industry
Employment (in thousands)
Change (thousands)
Change (%)
Total Nonfarm Employment
470.0
9.2
2.0%
Mining, Logging, and Construction
74.8
2.6
3.6%
Manufacturing
19.8
-0.1
-0.5%
Trade, Transportation, and Utilities
98.5
1.5
1.5%
Information
5.1
-0.5
-8.9%
Financial Activities
20.8
-0.5
-2.3%
Professional and Business Services
57.5
1.5
2.7%
Education and Health Services
71.9
2.3
3.3%
Leisure and Hospitality
81.5
-0.6
-0.7%
Other Services
30.6
2.8
10.1%
Government
470.0
9.2
2.0%
- Construction (+3.6%) and Education/Health Services (+3.3%) experienced strong growth, indicating ongoing development and demand for healthcare services.
- Leisure and Hospitality (-0.7%) declined, likely due to seasonal tourism fluctuations or economic uncertainty affecting travel.
- Manufacturing (-0.5%) and Information (-8.9%) saw declines, possibly reflecting limited industrial expansion and tech sector challenges in Hawaii.
- Government employment (+2.0%) remained a stable contributor to job growth.
Compensation and Benefits – Private Industry
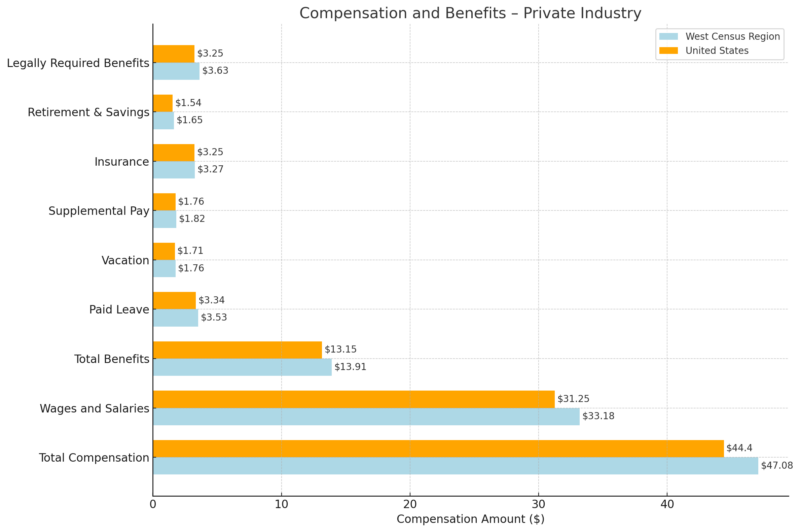
- Total compensation in the West ($47.08) is higher than the national average ($44.40), reflecting higher wages and cost of living in states like Hawaii, California, and Washington.
- Wages and salaries ($33.18 vs. $31.25 nationally) suggest that private industry jobs in the West offer better pay but are offset by higher living expenses.
- Retirement & savings benefits ($1.65 vs. $1.54) and legally required benefits ($3.63 vs. $3.25) are slightly higher, indicating stronger employer contributions to social programs.
Average Annual Spending
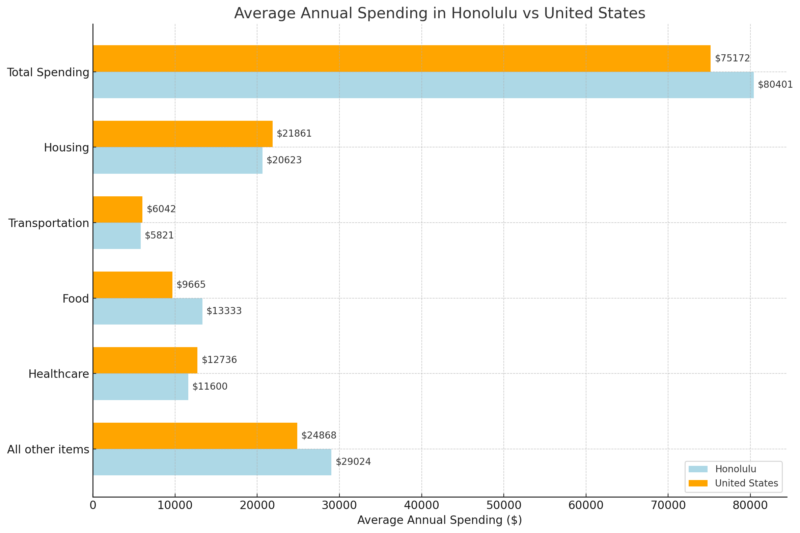
- Honolulu’s overall annual spending ($80,401) exceeds the U.S. average ($75,172), mainly due to higher costs of food and housing.
- Food expenses in Honolulu ($13,333) are significantly higher than the U.S. average ($9,665), likely due to shipping costs for imported goods.
- Housing costs ($20,623 vs. $21,861) are slightly lower than the national average but still make up a significant portion of expenses.
- Healthcare costs ($11,600) are lower than the national average ($12,736), possibly due to Hawaii’s unique healthcare system.
Consumer Price Index – Over-the-Year Change
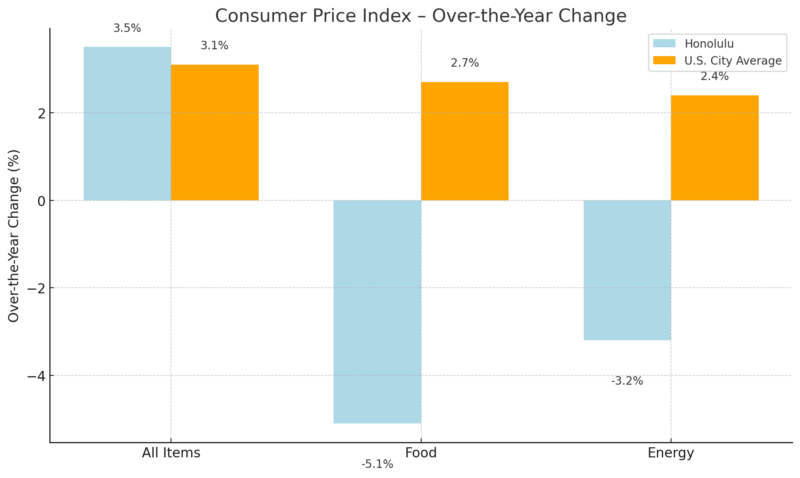
- Overall inflation in Honolulu (3.5%) is slightly higher than the national average (3.1%), indicating rising costs in key sectors.
- Food prices decreased by 5.1%, while they increased by 2.7% nationally, possibly due to improved supply chains or economic shifts in Hawaii.
- Energy costs dropped by 3.2% in Honolulu, compared to a 2.4% increase nationally, suggesting lower fuel and electricity costs in the region.
Honolulu in 2025 offers robust infrastructure and services. Key areas of focus include healthcare facilities, educational institutions, and public transportation systems, which are vital for supporting a growing population and maintaining a high quality of life.
Healthcare
Honolulu County scores 94 in overall population health, indicating strong health outcomes, high life expectancy (82 years), and low uninsured rates (4.1%) compared to the national average (11.5%).
The county also exhibits a lower smoking rate (11.2%) than the U.S. average (19.0%).
Access to Care (Score: 61)
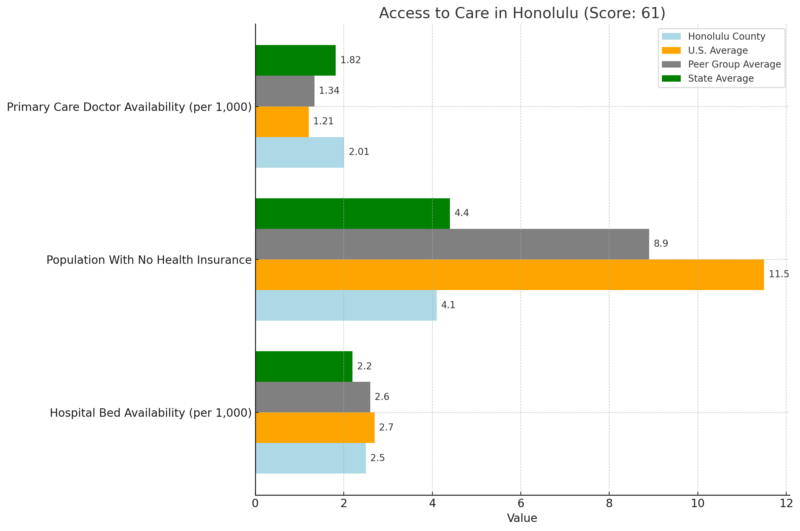
Honolulu has a lower uninsured rate (4.1%) compared to the national (11.5%) and peer group average (8.9%), reflecting good healthcare coverage.
Primary care doctor availability (2.01 per 1,000 residents) is significantly higher than the national (1.21) and peer group (1.34) averages, ensuring better access to routine medical care.
Hospital bed availability (2.5 per 1,000) is slightly lower than the national average (2.7), which may impact hospital capacity during health crises.
Health Behaviors (Score: 73)
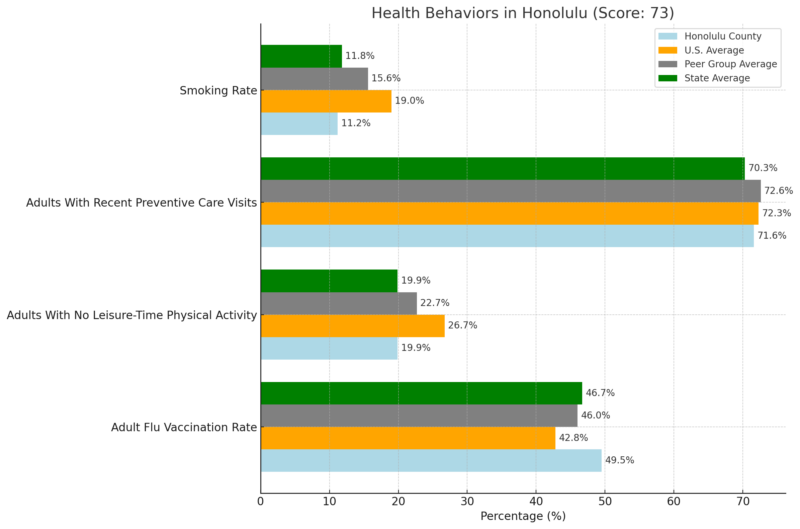
US News noted that Honolulu has a high flu vaccination rate (49.5%), exceeding national (42.8%) and peer group (46.0%) averages.
The percentage of physically inactive adults (19.9%) is lower than the national (26.7%) and peer group (22.7%) averages, reflecting a more active population.
Preventive care visits (71.6%) are slightly below the national (72.3%) and peer group (72.6%) averages, indicating a need for slight improvement in routine checkups.
Honolulu’s smoking rate (11.2%) is significantly lower than the national average (19.0%), contributing to better long-term health outcomes.
Health Conditions (Score: 97)
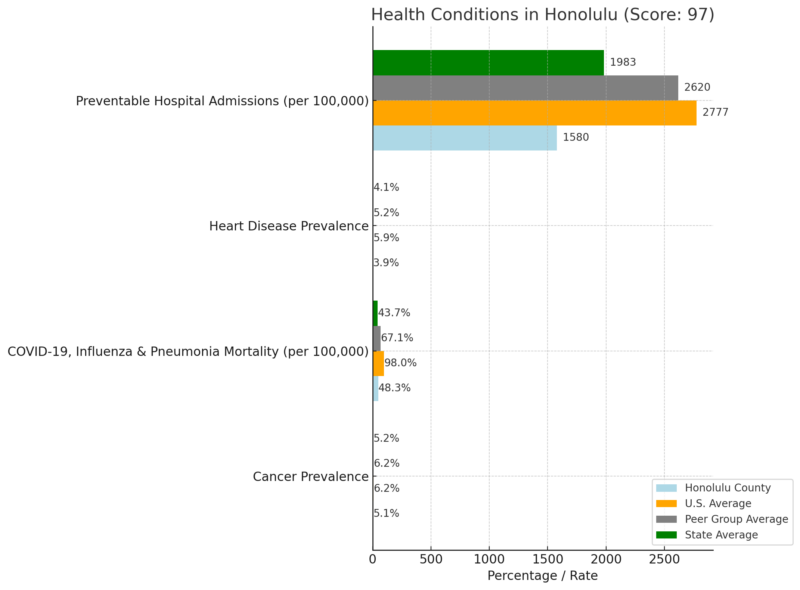
Honolulu has a lower cancer prevalence (5.1%) compared to the national average (6.2%), which suggests better preventive healthcare and lifestyle factors.
COVID-19, influenza, and pneumonia mortality rates (48.3 per 100,000) are significantly lower than the U.S. average (98.0 per 100,000), indicating effective disease management and vaccinations.
Study from @CDCHeart_Stroke of nationwide mortality data found that Native Hawaiian & Pacific Islander adults have substantially higher cardiovascular death rates than Asian adults & the 3rd highest CVD death rate in the U.S. behind Black & White adults: https://t.co/zxwuYNXhDT
— Annals of Int Med (@AnnalsofIM) October 15, 2024
Heart disease prevalence (3.9%) is much lower than the national average (5.9%), contributing to Honolulu’s high life expectancy.
Preventable hospital admissions (1,580 per 100,000 Medicare beneficiaries) are far below the national average (2,777 per 100,000), showing efficient outpatient care and disease prevention.
Education (Aged 25 and Older)
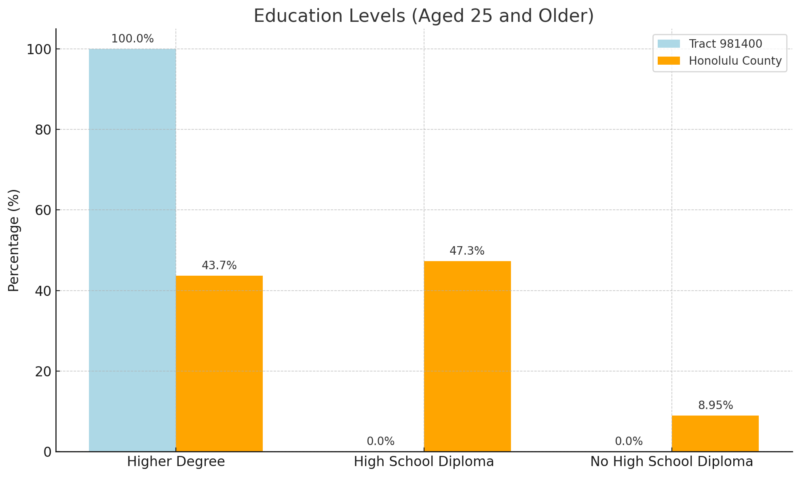
- As noted by Statistical Atlas, 100% of the population in Tract 981400 has a post-secondary degree, significantly exceeding the countywide rate of 43.7%.
- No residents in this tract fall into the categories of only having a high school diploma or lacking a diploma, unlike Honolulu County, where 47.3% have a high school diploma and 8.95% did not complete high school.
- This area exhibits a significantly higher level of educational attainment compared to the rest of Honolulu County, likely indicating a small but highly educated population.
Relative Educational Attainment (Comparison to Honolulu County)
Education Level
% Difference from County Average
Higher Degree
+128.7%
High School Diploma
-100.0%
No High School Diploma
-100.0%
The percentage of individuals with a higher degree is 128.7% higher than the county average, indicating a well-educated population.
There are no individuals with only a high school diploma or no diploma at all, which is 100% lower than the county averages in these categories.
This tract stands out as a highly educated area compared to the broader Honolulu County, likely due to the presence of professionals, academics, or an affluent community with strong educational backgrounds.
Household Income Statistics
Income Metric
Amount
Year-over-Year (Y-o-Y) Change
Average Household Income
$141,635
+9.7%
Median Household Income
$91,312
+8.8%
The average household income in Honolulu is $141,635, reflecting a 9.7% increase from the previous year according to Point2Homes.
The median household income is $91,312, which is 8.8% higher than the prior year, suggesting strong wage growth across different income brackets.
The significant rise in incomes indicates a healthy economy and potentially higher wages in key sectors. However, the cost of living in Honolulu remains high, which can offset these gains.
Income by Age Group
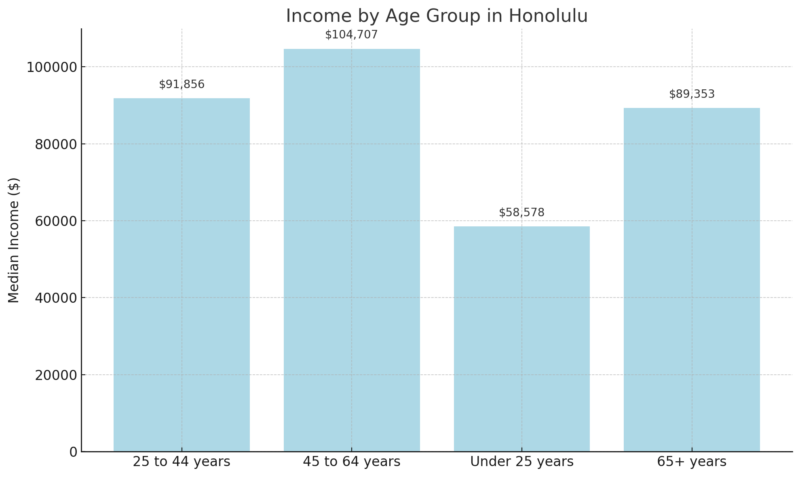
Individuals aged 45-64 have the highest median income ($104,707), likely due to career advancement and peak earning potential.
The 25-44 age group earns $91,856, reflecting strong wages for younger professionals.
Those under 25 earn significantly less ($58,578), likely due to entry-level jobs or part-time work.
Seniors (65+) earn $89,353, which suggests that many retirees still have substantial income sources, potentially from pensions or investments.
Poverty Levels in Honolulu
Category
Number of People
Y-o-Y Change
Below Poverty Level
4
N/A
Above Poverty Level
322,229
-0.9%
Only four people were officially reported below the poverty level, indicating a strong economic status in Honolulu. However, this number might be an anomaly or underreported.
The number of people above the poverty level decreased by 0.9%, suggesting a slight increase in economic challenges for some residents.
Housing Market 2025
Metric
Value
Year-over-Year (YoY) Change
Median Sale Price
$610,000
-1.1%
Median Price per Sq. Ft.
$718
-5.0%
Number of Homes Sold
238
-0.83%
Median Days on Market
85
+9 days
Sale-to-List Price Ratio
97.3%
-0.64 pt
Homes Sold Above List Price
11.8%
-0.32 pt
Homes with Price Drops
13.0%
+3.2 pt
The median sale price in Honolulu is $610,000, reflecting a 1.1% decrease year-over-year.
This suggests a softening housing market with slightly lower demand or increased inventory, according to Redfin.
Homes now sit on the market for 85 days on average, 9 days longer than last year, indicating reduced buyer urgency and a less competitive market.
238 homes were sold in December 2024, a slight 0.83% decline from the previous year, suggesting stable but slightly lower transaction volume.
The median price per square foot is $718, a 5.0% drop, signaling a decrease in property values and possible adjustments in listing prices.
Methodology
This report was crafted using official data sources, including World Population Review, BLS, Redfin, and ACS 5-Year Estimates.
We analyzed demographic trends, economic indicators, health statistics, and real estate data to provide a comprehensive overview of Honolulu in 2025.
References
- World Population Review – Honolulu Population 2025
- Macrotrends – Honolulu Metro Population 2025
- Neilsberg – Honolulu County, HI Population by Race
- U.S. Bureau of Labor Statistics (BLS) – Honolulu Economic Summary
- Redfin – Honolulu Housing Market 2025
- Point2Homes – Honolulu Demographics
- U.S. News & World Report – Healthiest Communities: Honolulu County
- Statistical Atlas – Honolulu County, HI Educational Attainment
- ACS 5-Year Estimates (2018-2022) – Honolulu County Population by Age