
Medical malpractice remains a significant concern in the U.S. healthcare system, with notable variations in claims and payouts across states.
In 2025, New York reported the highest total payouts, amounting to $372.39 million from 659 claims, averaging $565,077 per claim.
Florida followed with $203.85 million across 670 claims, averaging $304,253 per claim.
Conversely, Wyoming, despite only four claims, had the highest average payout at $2,373,750 per case.
These disparities highlight the influence of state-specific legal frameworks and healthcare environments on malpractice outcomes.
For instance, states with caps on non-economic damages, like California under the Medical Injury Compensation Reform Act (MICRA), often exhibit lower average payouts despite high case volumes.
Malpractice claims also contribute to rising healthcare costs.
In 2022, 36.2% of medical liability premiums increased, with an average rise of 8.1% among those that went up according to government sources.
Key Takeaways
- New York led in 2024 with $372.39M from 659 claims, averaging $565,077 per case.
- Wyoming reported the highest average payout at $2.37M, despite only four claims.
- Vermont (5 claims) and Wyoming (4 claims) had the lowest case counts.
- Malpractice costs drive up healthcare expenses, with 36.2% of liability premiums rising by 8.1% in 2022.
- National average payouts increased by 4.65% to $0.45M, while New York’s total payouts dropped 39.6%.
- Costs related to defensive practices add $46B annually to healthcare expenditures.
Medical Malpractice Data by State (2024)
The table below provides the number of claims, total payouts, and average payouts for all 51 states (including Washington, D.C.):
| State | Number of Claims | Total Payout ($) | Average Payout ($) |
|---|---|---|---|
| Florida | 670 | 203,849,700 | 304,253 |
| New York | 659 | 372,386,000 | 565,077 |
| California | 513 | 162,850,350 | 317,447 |
| Pennsylvania | 456 | 188,910,250 | 414,276 |
| Texas | 344 | 76,059,000 | 221,101 |
| Indiana | 219 | 51,545,250 | 235,366 |
| New Jersey | 209 | 107,772,050 | 515,655 |
| Georgia | 165 | 85,215,850 | 516,459 |
| Illinois | 164 | 112,303,300 | 684,776 |
| Louisiana | 160 | 36,954,550 | 230,965 |
| Maryland | 159 | 79,709,250 | 501,316 |
| Michigan | 150 | 38,809,500 | 258,730 |
| Ohio | 119 | 42,372,750 | 356,073 |
| Missouri | 112 | 43,080,850 | 384,650 |
| Massachusetts | 96 | 53,347,500 | 555,703 |
| Arizona | 94 | 47,988,500 | 510,515 |
| South Carolina | 94 | 37,542,500 | 399,388 |
| Washington | 92 | 57,212,750 | 621,877 |
| North Carolina | 80 | 35,726,250 | 446,578 |
| Oklahoma | 80 | 21,580,750 | 269,759 |
| Kentucky | 75 | 30,581,500 | 407,753 |
| Tennessee | 75 | 23,902,500 | 318,700 |
| Kansas | 73 | 18,025,000 | 246,917 |
| New Mexico | 70 | 24,311,250 | 347,303 |
| Virginia | 64 | 27,585,000 | 431,015 |
| Connecticut | 63 | 47,068,750 | 747,123 |
| Colorado | 57 | 22,075,750 | 387,293 |
| West Virginia | 55 | 18,750,050 | 340,910 |
| Alabama | 53 | 29,180,000 | 550,566 |
| Nevada | 47 | 19,952,000 | 424,510 |
| Mississippi | 45 | 20,193,500 | 448,744 |
| Oregon | 45 | 28,519,500 | 633,766 |
| New Hampshire | 39 | 16,870,000 | 432,564 |
| Utah | 37 | 12,605,000 | 340,675 |
| Rhode Island | 35 | 19,917,500 | 569,071 |
| Arkansas | 34 | 11,906,250 | 350,183 |
| Wisconsin | 31 | 25,701,500 | 829,080 |
| Montana | 28 | 7,552,500 | 269,732 |
| Iowa | 27 | 22,021,250 | 815,601 |
| Minnesota | 24 | 32,232,500 | 1,343,020 |
| Nebraska | 23 | 8,072,500 | 350,978 |
| Maine | 21 | 21,390,000 | 1,018,571 |
| Hawaii | 18 | 8,497,500 | 472,083 |
| Idaho | 18 | 7,485,000 | 415,833 |
| Delaware | 12 | 9,102,500 | 758,541 |
| District of Columbia | 10 | 6,122,500 | 612,250 |
| North Dakota | 8 | 2,627,000 | 328,375 |
| Alaska | 7 | 3,617,500 | 516,785 |
| South Dakota | 6 | 2,232,500 | 372,083 |
| Vermont | 5 | 947,000 | 189,400 |
| Wyoming | 4 | 9,495,000 | 2,373,750 |
High Total Payouts
- According to World Population Review, New York leads the nation with $372.39 million in total payouts across 659 claims, reflecting the state’s dense population and complex healthcare systems.
- Florida and California follow, with $203.85 million and $162.85 million, respectively.
High Average Payouts
- Wyoming has the highest average payout at $2.37 million per case, despite having only four claims.
- Minnesota and Connecticut also report high average payouts, exceeding $1 million and $700,000 per case, respectively.
States with Fewer Claims
- States like Vermont (5 claims) and Wyoming (4 claims) have fewer malpractice cases, likely due to smaller populations and healthcare systems.
Common Examples of Medical Malpractice
While malpractice cases can vary widely, common examples include:
- Prescription Errors: Prescribing incorrect medication or the wrong dosage, results in harm.
- Surgical Mistakes: Operating on the wrong body part or leaving surgical instruments inside the patient.
- Diagnostic Errors: Misdiagnosis or delayed diagnosis that leads to worsening conditions.
- Intentional Harm or Negligence: Instances of gross negligence, such as working while intoxicated or disregarding established medical practices.
These scenarios often lead to significant financial, physical, and emotional consequences, necessitating fair compensation for the affected patients.
Factors Contributing to Differences in Payouts
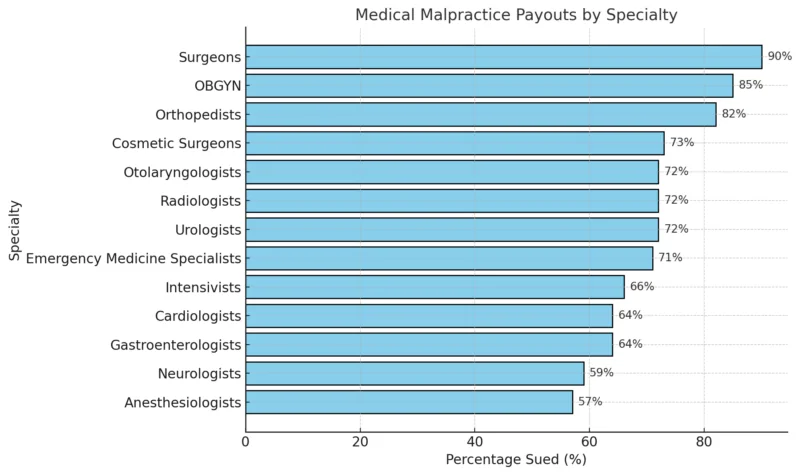
The variation in medical malpractice payouts is influenced by several factors, including location, physician specialty, and the inherent risks associated with certain medical practices. While geographic location plays a significant role, a physician’s specialty is often the most critical determinant of malpractice claims and payouts.
Certain specialties, such as surgery and obstetrics, face substantially higher malpractice risks due to the complex and high-stakes nature of their work. Conversely, specialties like dermatology and psychology have the lowest rates of malpractice claims.
According to Becker Hospital Review, here are the percentages of physicians in various specialties who are sued for malpractice during their careers:
2023 vs. 2024: Trends
| Metric | 2023 | 2024 | Change (%) |
|---|---|---|---|
| National Average Payout | $0.43 million | $0.45 million | +4.65% |
| Highest Total Payout | $616.58 million (NY) | $372.39 million (NY) | -39.6% |
| Highest Average Payout | $1.03 million (WY) | $2.37 million (WY) | +130.1% |
| Total Cases (NY) | 1,252 | 659 | -47.4% |
A reduction in total cases in states like New York suggests improved preventive measures or stricter legal filing requirements according to Consumershields.
Higher average payouts in states like Wyoming and Minnesota point to more severe or complex malpractice cases.
States with caps on non-economic damages, such as California under the Medical Injury Compensation Reform Act (MICRA), show lower average payouts despite high case volumes.
Rising Healthcare Costs
Understanding the rising cost of malpractice claims is crucial for risk managers. Social inflation has added an estimated $2.4–$3.5 billion to losses over the past decade. How does this trend affect risk management strategies? Learn more: https://t.co/1Rmo5LsqQC @ASHRMAHA pic.twitter.com/3WuyCvD3VU
— The Doctors Company (@doctorscompany) August 13, 2024
Malpractice claims significantly contribute to the escalating costs of healthcare.
Providers face increased insurance premiums, and defensive medicine—where unnecessary tests or procedures are ordered to avoid litigation—further inflates expenses.
| Metric | Value | Source |
|---|---|---|
| Percentage of liability premiums increased (2022) | 36.2% | AMA |
| The average increase in premiums | 8.1% | |
| The national cost of defensive medicine | $46 billion annually | American Action Forum |
The financial burden of malpractice is significant.
For example, in 2023, New York reported the highest total payouts, amounting to $616.58 million across 1,252 cases as Consumershileds noted in their report.
In particular, the average medical malpractice payout for infants under one month old exceeds $1 million, adding further strain to the overall costs.
These expenses are often passed on to patients through higher medical bills and insurance premiums.
Insurance and Legal Implications
View this post on Instagram
Most healthcare providers rely on malpractice insurance to cover the costs of legal defense and settlements.
However, these policies often include coverage limits and exclude certain circumstances, such as intentional harm.
Hospitals frequently maintain supplementary insurance to protect against high-profile cases, though the financial strain can still be severe.
Example of Large-Scale Payouts
In the UK, the NHS reported record payments of £2.87 billion in damages and legal costs due to medical errors in a single year, with maternity-related claims accounting for a significant proportion according to The Times.
| Year | Total Damages Paid by NHS | Key Areas of Claims |
|---|---|---|
| 2023 | £2.87 billion | Maternity (50% of claims) |
| 2022 | £2.21 billion | Surgical Errors, Delayed Diagnosis |
Such high costs are not isolated incidents and are mirrored globally in cases of severe medical malpractice.
The Role of Legal Representation

For patients pursuing malpractice claims, navigating the legal system can be overwhelming. Experienced legal representation is essential to:
- Assess the claim’s validity based on the Four Ds (Duty, Deviation, Damage, and Direct Cause).
- Negotiate fair settlements or provide robust representation in court.
- Ensure compliance with state-specific laws, such as caps on damages, which can vary widely.