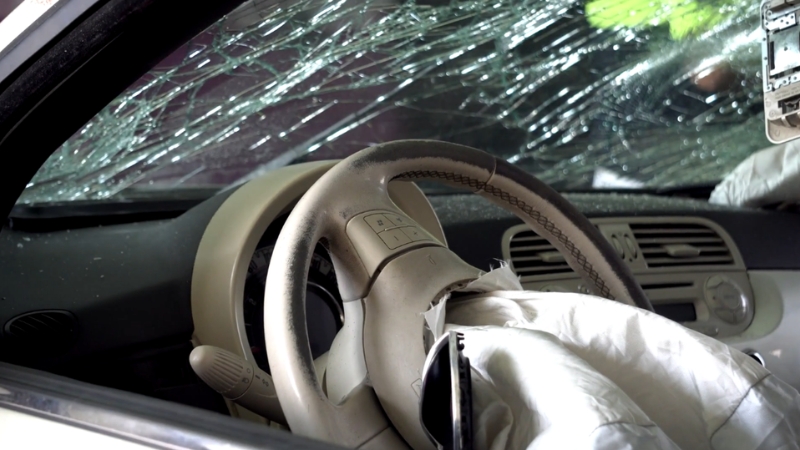
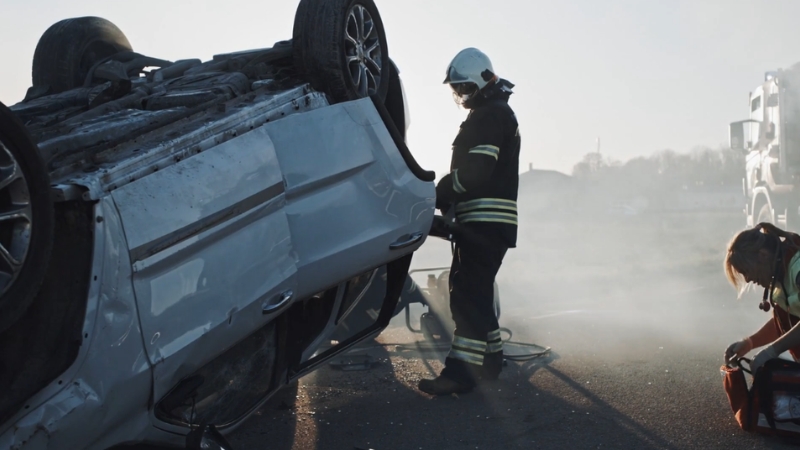
In the first half of 2024, the National Highway Traffic Safety Administration (NHTSA) estimated that 18,720 people were killed in motor vehicle crashes across the United States. This marks a 3.2% drop from the projected 19,330 fatalities during the same period in 2023, continuing a modest but welcome downward trend in road deaths.
Both the first and second quarters of 2024 showed declines, signaling that national safety initiatives, better vehicle technology, and targeted enforcement may be making an impact.
However, this improvement comes after several years of unusually high risk on American roads. When the COVID-19 pandemic first began, traffic volumes plummeted almost overnight.
Empty highways gave drivers more space, but also more temptation to push the limits. Many state transportation officials believe the pandemic period sparked a wave of riskier driving behaviors, particularly speeding, distracted driving, and driving under the influence.
Research from the American Automobile Association (AAA) adds another layer to the story. Their findings suggest that people who were already prone to aggressive or reckless driving spent more time behind the wheel during the pandemic. This created a dangerous mix: fewer cars on the road, but a higher concentration of risk-taking drivers.
Table of Contents
ToggleStates With the Fewest Fatal Car Accidents
Rank
State
Fatal Accidents
Fatalities per 100,000 People
Notable Factors
1
Massachusetts
327
4.9
Strict DUI laws, tough penalties for impaired driving
2
Rhode Island
Low
N/A
The lowest count of alcohol-related fatal crashes in the nation
3
Washington D.C.
Low
N/A
The lowest number of alcohol-related fatal crashes
4
Hawaii
N/A
N/A
Lowest statewide speed limits, helping reduce high-speed accidents
Some states record remarkably low fatal car accident rates, and the reasons go beyond just population size or the number of licensed drivers. In some cases, it’s the strict enforcement of traffic safety laws; in others, geography and infrastructure naturally limit dangerous driving conditions.
Massachusetts leads the list, averaging just 4.9 fatalities per 100,000 people and reporting 327 fatal accidents in 2020 – well below the national rate.
Washington, D., and Rhode Island each maintain exceptionally low alcohol-related crash numbers, while Hawaii benefits from the lowest maximum speed limits in the U.S., helping to keep severe collisions to a minimum according to World Population Review.
Even in these safer states, however, accidents can and do happen, often with life-changing consequences. Knowing how to respond – especially after a crash that results in injury – is essential to protecting your rights and securing the help you need.
1. Massachusetts
Massachusetts consistently ranks as the safest state for drivers in terms of fatality rate, with only 4.9 deaths per 100,000 people. Its success is largely credited to stringent DUI laws and tough sentencing guidelines for impaired driving offenses. Repeat DUI offenders can face lengthy jail terms, heavy fines, and mandatory ignition interlock devices.
Urban density also plays a role – Boston’s congested streets and statewide lower speed limits in urban areas reduce the opportunity for high-speed crashes. The state also has a strong public transportation network, which decreases total vehicle miles traveled.
Metric
Value
Fatal accidents (2020)
327
Fatalities per 100k
4.9
DUI law strictness
Among the toughest in the US
Public transit usage
High, reducing car dependency
2. Rhode Island
Rhode Island has one of the lowest numbers of alcohol-related fatal crashes in the entire country. While the state’s compact geography means drivers cover shorter distances, strict enforcement of impaired driving laws and proactive police checkpoints have also kept DUI-related deaths low.
Another factor is its dense road network and lower rural exposure – most roads have reduced speed limits and are under consistent monitoring. Winter road safety campaigns are also common, ensuring that seasonal hazards don’t cause spikes in crash deaths.
Metric
Value
Alcohol-related fatal crashes
Lowest in the US
State size
Small, highly urbanized
DUI enforcement
High, frequent roadside checks
3. Washington, D.C.

The District of Columbia maintains an exceptionally low rate of fatal accidents and one of the smallest counts of alcohol-related crash deaths in the nation. The city’s high population density and extensive public transportation reduce the overall number of cars on the road, while strict enforcement of impaired driving and speed limits deters risky behavior.
Speed and red-light cameras are widely deployed, and fines for violations can be steep. In addition, road design in many neighborhoods favors pedestrian safety, with traffic-calming measures such as narrower lanes, speed bumps, and extensive crosswalk systems.
Metric
Value
Alcohol-related fatal crashes
Among the lowest in the US
Public transit coverage
Very high
Automated traffic enforcement
Extensive use of cameras
4. Hawaii
Hawaii benefits from the lowest maximum speed limits in the United States, a factor that directly reduces the severity of crashes. On most roads, top speed limits range from 45–55 mph, and even interstate-style highways have lower limits than their mainland counterparts.
The islands’ geography – mountain roads, curves, and shorter stretches of high-speed driving – naturally limits reckless speeding. While traffic congestion can be frustrating for locals, it does have the side effect of reducing opportunities for dangerous driving.
Additionally, Hawaii runs consistent public awareness campaigns on DUI prevention, especially during tourist-heavy seasons.
Metric
Value
Statewide top speed limit
Lowest in the US
Road design
Curved, mountainous, speed-limiting
DUI prevention programs
Seasonal, tourism-focused
States With Most Fatal Car Crashes by Population
State
Population
Licensed Drivers
Fatal Crashes
Deaths per 100,000
Alabama
5,024,803
4,042,900
852
18.6
Alaska
732,441
518,872
53
8.7
Arizona
7,177,986
5,681,495
967
14.7
Arkansas
3,012,232
2,153,929
585
21.2
California
39,499,738
27,005,302
3,558
9.7
Colorado
5,784,308
4,299,447
574
10.8
Connecticut
3,600,260
2,508,670
279
8.2
Delaware
991,886
829,226
104
11.7
District of Columbia
690,093
520,865
34
5.2
Florida
21,569,932
15,715,373
3,098
15.4
Georgia
10,725,800
7,521,750
1,522
15.5
Hawaii
1,451,911
921,547
81
5.9
Idaho
1,847,772
1,285,331
188
11.6
Illinois
12,785,245
8,225,298
1,087
9.3
Indiana
6,785,644
4,532,708
815
13.2
Iowa
3,188,669
2,268,916
304
10.6
Kansas
2,935,880
2,004,302
382
14.5
Kentucky
4,503,958
2,905,632
709
17.3
Louisiana
4,651,203
3,416,648
762
17.8
Maine
1,362,280
1,047,893
151
12.0
Maryland
6,172,679
4,454,266
540
9.2
Massachusetts
7,022,220
4,940,373
327
4.9
Michigan
10,067,664
7,026,650
1,011
10.8
Minnesota
5,707,165
4,090,264
369
6.9
Mississippi
2,956,870
2,017,111
687
25.4
Missouri
6,154,481
4,259,672
987
16.0
Montana
1,086,193
826,754
190
19.6
Nebraska
1,961,455
1,438,821
217
11.9
Nevada
3,114,071
2,056,394
293
10.2
New Hampshire
1,377,848
1,060,381
98
7.5
New Jersey
9,279,743
6,230,912
547
6.3
New Mexico
2,117,566
1,473,219
365
18.8
New York
20,154,933
12,194,360
963
5.2
North Carolina
10,457,177
7,637,400
1,412
14.7
North Dakota
778,962
539,006
96
12.8
Ohio
11,790,587
8,100,273
1,154
10.4
Oklahoma
3,962,031
2,550,560
599
16.5
Oregon
4,241,544
2,944,828
461
12.0
Pennsylvania
12,989,625
8,930,677
1,060
8.7
Rhode Island
1,096,229
731,715
66
6.1
South Carolina
5,130,729
3,905,911
962
20.7
South Dakota
887,009
658,091
132
15.9
Tennessee
6,920,119
4,877,268
1,119
17.6
Texas
29,217,653
17,667,039
3,520
13.3
Utah
3,281,684
2,149,766
256
8.4
Vermont
642,495
460,871
58
9.6
Virginia
8,632,044
5,909,716
796
9.8
Washington
7,718,785
5,812,500
525
7.3
West Virginia
1,789,798
1,101,775
249
14.9
Wisconsin
5,892,323
4,315,892
561
10.4
Wyoming
577,267
427,233
87
22
1. Mississippi
A new study shows Mississippi is the most dangerous state in the U.S. to drive in.
Key findings were:
* Mississippi has the most fatal car accidents (67.82 per 100,000 licensed drivers) and people killed in fatal crashes (24.52 per 100,000 residents).
* Mississippi has the…— SuperTalk Mississippi (@supertalk) September 2, 2024
- Death rate: Around 22.2 per 100,000 in recent years.
- Distracted driving: Mississippi drivers spend nearly 8% of their driving time on phones.
- Seat belt usage: One in two traffic fatalities involves unbelted occupants. Only 77.9% of drivers wear seat belts vs. the 90.1% national average.
- Impaired driving: DUI contributes to nearly 30% of traffic fatalities
Mississippi at a glance:
Metric
Value
Deaths per 100k
~22.2
Phone usage (driving)
~8% of time
Seat belt usage
77.9% (vs. 90.1% US avg)
DUI-involved fatalities
~30% of crash deaths
2. Wyoming
- Drunk‑driving fatalities: 6.85 deaths per 100,000 residents, with 8.6 drunk drivers per 100,000 licensed drivers—both well above national averages
- Fatality involvement: About 30% of all traffic deaths involve alcohol
- 2025 trend: As of mid‑May 2025, fatalities are up 25% versus the same period in 2024 (35 deaths in 32 crashes)
Wyoming at a glance:
Metric
Value
DUI deaths per 100k
6.85
Drunk drivers per 100k
8.6
Alcohol-involved deaths
~30% of all traffic fatalities
Increase in 2025
+25% (mid‑May vs 2024)
3. Arkansas

- Fatality rate: Climbing from 16.9 per 100k in 2019 to 22.9 in 2021, slightly falling to ~21.1 in 2022.
- Ten‑year rise: Traffic fatalities are up 30% compared to 2014.
- Risk factors: Speeding-related crash deaths up 16% (2019–2024); alcohol-related fatalities rose 22% (2019–2023); unbelted adult front-seat deaths rose 4% (2019–2024).
Arkansas at a glance:
Metric
Value
Deaths per 100k
~21.1 (after 22.9 in 2021)
Change since 2014
+30%
Speeding-related fatalities
+16% (2019–2024)
Alcohol-related fatalities
+22% (2019–2023)
Unbelted front-seat fatalities
+4% (2019–2024)
4. South Carolina
- Deaths per 100 million VMT: Historically about 1.73–1.83, consistently among the worst nationally
- Recent improvements: Traffic fatalities dropped 14% from 2021 to 2023; fatality rate per 100M VMT fell 18%
South Carolina at a glance:
Metric
Value
Deaths per 100M VMT
~1.7–1.8 (one of the highest)
Fatalities change (2021–23)
–14%
VMT rate change
–18%
5. Montana
- Worst in the nation for drunk-driving fatalities: 7.14 deaths per 100,000 residents, and 8.57 drunk drivers per 100,000 drivers; often cited as top in DUI-linked crash rates.
- Traffic totals: 203 fatalities in 2024; early 2025 (to date) shows 111 fatalities compared to 120 in the same period in 2024
- Spotlights: Over 33–44% of traffic deaths involve alcohol
Montana at a glance:
Metric
Value
DUI deaths per 100k
~7.14
Drunk drivers per 100k
~8.57
Alcohol-related deaths
~33–44% of all fatal crashes
Total fatalities (2024)
203
Deaths in early 2025
111 (vs 120 in the same 2024 period)
6. Alabama
- Fatality and VMT rates: Slight 1% decrease from 2021 to 2024, but overall up 19% in fatalities and 8% in VMT fatality rate since 2014
Alabama at a glance:
Metric
Value
Change in fatalities (2021–24)
−1%
Change since 2014
+19%
VMT fatality rate change since 2014
+8%
7. Louisiana

- Fatal crashes in 2024: 652 crashes resulting in 699 fatalities
- Rate per population: Around 21 deaths per 100,000, well above the national average (~12.9)
- Drunk driving: About 29% of traffic fatalities involve alcohol; 5.84 deaths per 100,000 residents in DUI crashes
Louisiana at a glance:
Metric
Value
2024 fatalities (crash-related)
699
Deaths per 100k
~21
Alcohol-related fatalities share
~29%
DUI deaths per 100k
~5.84
8. New Mexico
Though not in the original list, consumption data for context:
- Pedestrian fatality rate (H1 2024): Highest in nation—2.07 per 100,000 population
- Drunk-driving: Among states with a high DUI-related fatality share (not quantified here, but higher than national norms)
New Mexico at a glance:
Metric
Value
Pedestrian fatality rate
2.07 per 100k (H1 2024)
DUI fatality indicators
Higher than national averages
What to Do After a Car Accident
@texaschancla What to Do Immediately After a Car Accident! 🤕 #carwreck #caraccident #injury #insurance #texas #viral #lawyer #tx #law #attorney ♬ Minimal for news / news suspense(1169746) – Hiraoka Kotaro
A car accident can happen at any time, whether you live in a high-risk area or somewhere with very few crashes. Being prepared and knowing exactly what steps to take can protect your health, your legal rights, and your ability to recover damages.
Once you’ve checked yourself and any passengers for injuries and moved to a safe location, take the following steps:
- Call 911 – Even in minor collisions, contacting the police is important. They will file an official accident report, which serves as a key document for insurance claims and any potential legal action. Responding officers can also help ensure the scene is safe and that emergency medical services arrive if needed.
- Exchange Information – Collect and share essential details with the other driver, including names, contact information, driver’s license numbers, license plate numbers, and insurance details. Take clear photos of all vehicles involved, the surrounding scene, and any visible damage. These records will help the claims adjuster determine fault and assess the extent of the damage.
- File Your Insurance Claim – Once you have all the necessary information, contact your insurance provider to start the claims process. Many companies allow you to file directly from the scene using their mobile app, making it faster and easier to submit photos, reports, and other required details.
If your accident involves injuries, serious vehicle damage, or disputed fault, consider speaking with a car accident lawyer in Indiana, such as the team at Hensley Legal, who can guide you through your rights, handle negotiations, and represent you in pursuing fair compensation.
Methodology
This analysis draws on data from a range of reputable and authoritative sources. Primary statistics on 2024 traffic fatalities and national trends were obtained from the National Highway Traffic Safety Administration (NHTSA).
State-level figures, including fatality rates and contributing factors, were gathered from individual state transportation departments and the Insurance Institute for Highway Safety (IIHS) to ensure accuracy in reporting on vehicle safety performance and death rates by vehicle model.
To provide additional context on driver behavior and infrastructure, we incorporated findings from the American Automobile Association (AAA), World Population Review, and other consumer safety organizations, covering issues such as distracted driving, impaired driving, and roadway conditions.
Finally, state and federal legal frameworks—such as DUI statutes and enforcement measures—were reviewed to illustrate how variations in regulation and policy can influence crash outcomes across different regions.


