I have spent the past few months reviewing voter data from the 2024 US election results, and one pattern keeps standing out to me.
Heading into the 2024 United States presidential election, the country reached one of its highest registration levels in decades: 73.6 percent of voting-age citizens, or about 174 million people, were on the rolls according to the U.S. Census Bureau’s Current Population Survey (CPS).
Out of them, 154 million actually cast a ballot, a turnout that still leaves roughly 20 million registered voters who stayed home, even in an election as intense as Trump 2024 and the fight over the red and blue states map 2024.
By mid-2025, that pool is even larger. An estimated 189.5 million Americans are now registered, meaning almost eight in ten adults appear in state databases.
When you look at this growth while watching states shift on every new election map 2024 update, it becomes clear that political participation is rising, even if the outcomes of the 2024 United States elections results continue to split sharply along regional lines.
Table of Contents
ToggleKey Takeaways
- 73.6% of Americans were registered to vote in 2024 – the highest since 2008.
- By mid-2025, 189.5 million Americans were registered, equal to ~79% of the adult population.
- Registration rates vary widely, from Minnesota (84%) to Arkansas (65%).
- Independent voters (29%) now rival Democrats and Republicans combined in some regions.
- Education and age remain decisive factors in registration and turnout.
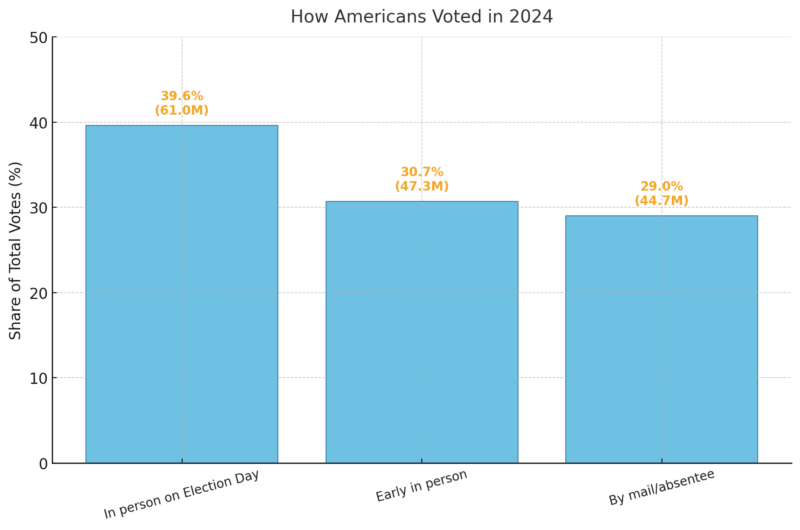
- Mail voting now accounts for nearly one-third of all ballots cast.
Historical View: Voter Registration Growth Since 1996
The Census Bureau’s historical data illustrate this trend clearly:
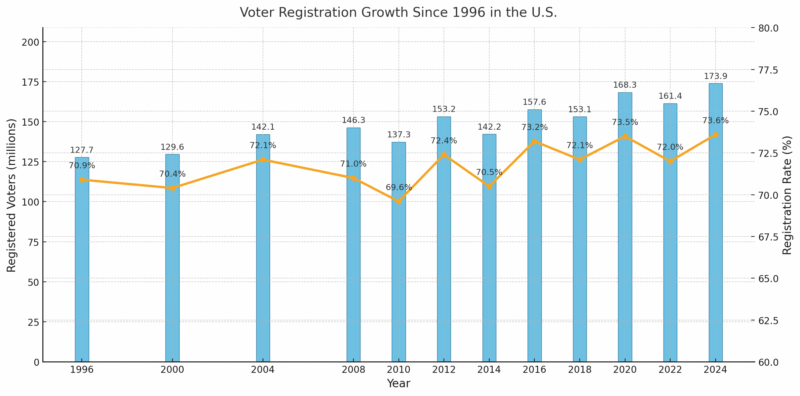
The historical record makes one thing obvious: voter registration in the United States has expanded far more than most people realize. Since the late 1990s, a combination of automatic voter registration laws, same-day registration, and online sign-ups has steadily increased participation, even in years when political interest appeared uneven.
Census Bureau trendlines show a clear upward climb, and you can see it in every major election cycle, including the 2024 US election results and the broader 2024 United States elections that reshaped turnout patterns across the map.
Over the last 30 years, the country has added more than 46 million registered voters, a 36 percent jump according to Statista.
Growth is strongest in large and fast-growing states, Texas, Florida, and California, where population shifts, expanded DMV-linked systems, and high-profile elections, such as the presidential election and 2024 election results have pushed registration numbers upward.
These states also feature prominently in national conversations about political balance, whether looking at the red and blue states map 2024, regional turnout gaps, or battleground analyses tied to Trump 2024 coverage.
Voter Registration by Age
Younger Americans continue to lag behind older generations when it comes to registration. According to Census Bureau data from the November 2024 survey:
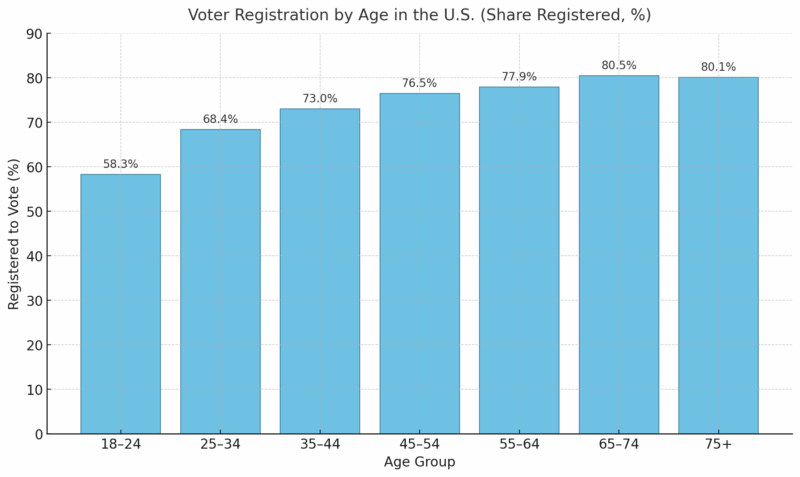
Younger voters continue to show the lowest voter registration rates in the U.S., and the 2024 data makes the gap easy to see. Americans aged 18–24 reached only 58.3%, a full 22 points below adults 65 and older.
The pattern becomes clearer when viewed alongside key moments in the 2024 election, where older voters once again formed the most reliable share of the electorate.
Adults in the 45–54 and 55–64 brackets hovered between 76% and 78%, tracking closely with turnout patterns seen in states central to the 2024 US election results like Georgia, Arizona, and Wisconsin.
Registration climbs even higher among the 65–74 group, which recorded 80.5%, reflecting their long-standing dominance in both presidential election participation and early/mail voting.
For analysts looking at red and blue states map 2024 trends, this chart shows why older voters still have outsized influence: they register at sharply higher rates and consistently show up on Election Day.
Number of Voters and Voter Registration as a Share of the Voter Population in Each State
| Location | Number of Registered Voters (in thousands) | Registered Voters as a Share of the Voter Population | Number of Individuals Who Voted (in thousands) | Individuals Who Voted as a Share of the Voter Population |
| United States | 173,854 | 0.736 | 154,308 | 0.653 |
| Alabama | 2,605 | 0.689 | 2,219 | 0.587 |
| Alaska | 408 | 0.783 | 324 | 0.621 |
| Arizona | 3,578 | 0.690 | 3,201 | 0.617 |
| Arkansas | 1,472 | 0.647 | 1,200 | 0.528 |
| California | 18,471 | 0.729 | 16,385 | 0.647 |
| Colorado | 3,158 | 0.738 | 2,997 | 0.701 |
| Connecticut | 1,882 | 0.722 | 1,729 | 0.663 |
| Delaware | 577 | 0.774 | 521 | 0.698 |
| District of Columbia | 432 | 0.851 | 404 | 0.795 |
| Florida | 10,788 | 0.670 | 9,703 | 0.603 |
| Georgia | 5,401 | 0.708 | 4,908 | 0.644 |
| Hawaii | 679 | 0.676 | 587 | 0.585 |
| Idaho | 1,017 | 0.712 | 932 | 0.652 |
| Illinois | 6,780 | 0.768 | 5,817 | 0.659 |
| Indiana | 3,536 | 0.737 | 2,912 | 0.607 |
| Iowa | 1,861 | 0.806 | 1,658 | 0.718 |
| Kansas | 1,628 | 0.798 | 1,443 | 0.707 |
| Kentucky | 2,558 | 0.805 | 2,152 | 0.677 |
| Louisiana | 2,160 | 0.660 | 1,897 | 0.580 |
| Maine | 831 | 0.740 | 753 | 0.671 |
| Maryland | 3,497 | 0.804 | 3,091 | 0.711 |
| Massachusetts | 3,728 | 0.754 | 3,408 | 0.689 |
| Michigan | 6,090 | 0.808 | 5,444 | 0.723 |
| Minnesota | 3,519 | 0.836 | 3,193 | 0.759 |
| Mississippi | 1,751 | 0.810 | 1,490 | 0.689 |
| Missouri | 3,707 | 0.795 | 3,240 | 0.695 |
| Montana | 651 | 0.738 | 610 | 0.692 |
| Nebraska | 1,016 | 0.738 | 928 | 0.674 |
| Nevada | 1,640 | 0.735 | 1,493 | 0.669 |
| New Hampshire | 856 | 0.781 | 788 | 0.719 |
| New Jersey | 5,175 | 0.819 | 4,581 | 0.725 |
| New Mexico | 1,135 | 0.761 | 984 | 0.660 |
| New York | 9,051 | 0.662 | 8,091 | 0.592 |
| North Carolina | 5,374 | 0.698 | 4,971 | 0.646 |
| North Dakota | 442 | 0.786 | 401 | 0.712 |
| Ohio | 6,593 | 0.751 | 5,922 | 0.674 |
| Oklahoma | 2,062 | 0.705 | 1,747 | 0.597 |
| Oregon | 2,604 | 0.830 | 2,362 | 0.753 |
| Pennsylvania | 7,413 | 0.757 | 6,828 | 0.697 |
| Rhode Island | 645 | 0.795 | 568 | 0.700 |
| South Carolina | 2,935 | 0.733 | 2,510 | 0.627 |
| South Dakota | 473 | 0.707 | 394 | 0.589 |
| Tennessee | 3,980 | 0.751 | 3,433 | 0.648 |
| Texas | 13,641 | 0.691 | 11,442 | 0.579 |
| Utah | 1,736 | 0.747 | 1,555 | 0.669 |
| Vermont | 401 | 0.772 | 373 | 0.717 |
| Virginia | 4,981 | 0.796 | 4,565 | 0.729 |
| Washington | 4,250 | 0.771 | 3,863 | 0.700 |
| West Virginia | 1,001 | 0.738 | 807 | 0.595 |
| Wisconsin | 3,380 | 0.763 | 3,201 | 0.722 |
| Wyoming | 307 | 0.693 | 283 | 0.638 |
Nearly 3 in 4 Americans Are Registered
In November 2024, 73.6% of eligible Americans, or roughly 174 million people, were registered to vote. Out of that group, 65.3% actually voted, totaling 154 million ballots cast.
This marks a strong showing compared with previous decades and confirms that voter participation remains at one of its highest levels since the 1960s. For reference, voter registration hovered around 70% in the late 1990s, dipped slightly in the early 2000s, and has since climbed thanks to online registration tools and “motor voter” laws.
The U.S. continues to see an upward curve in engagement. According to the U.S. Census Bureau’s April 2025 release, registration and turnout in 2024 were both higher than in 2012 and 2016, showing that Americans are increasingly active in national elections even during politically divisive times.
The Participation Divide
When I look at the 2024 numbers, the sharp divide between red states and blue states becomes impossible to ignore. It shows up clearly in both voter registration and turnout, and it lines up closely with differences in state policy rather than voter interest.
The 2024 US election results, the red and blue states map 2024, and the final turnout data all point in the same direction.
In high-performing blue states such as Minnesota (83.6%), Oregon (83.0%), New Jersey (81.9%), and Michigan (80.8%), voter registration is built into everyday systems. Automatic registration at the DMV, expanded mail voting, and same-day registration keep participation high.
These states consistently convert their registrants into active voters, often pushing turnout above 70% in major presidential election years.
Red states tell a different story. Places like Arkansas (64.7%), Texas (69.1%), Louisiana (66.0%), and Alabama (68.9%) remain at the bottom of the registration scale. That gap ties directly to older administrative systems, manual registration requirements, and strict cutoff deadlines before Election Day.
These limitations shape participation long before voters reach the ballot box, even in competitive cycles such as the 2024 United States elections and the Trump 2024 race.
But the picture isn’t perfectly split. Mississippi (81.0%) stands out as a Republican-led state with one of the highest registration rates in the country.
Meanwhile, New York (66.2%), despite being deeply blue, continues to struggle because of outdated list maintenance rules and high population churn. These outliers show that policy design matters more than partisan identity when looking at voter engagement in the 2024 election and beyond.
Top-Performing States
States like Minnesota (83.6%), Oregon (83.0%), New Jersey (81.9%), and Michigan (80.8%) have among the highest registration shares. Their strong performance is linked to same-day registration, automatic registration, and accessible mail-in voting.
- Minnesota leads the nation with an 83.6% registration rate and a turnout of nearly 76%.
- Oregon, one of the pioneers of all-mail voting, sees a registration rate above 83% with 75% turnout.
- New Jersey and Maryland both surpass 80% registration, supported by automatic registration through the DMV and expanded early voting access.
In these states, voter registration systems are integrated into everyday interactions, renewing a driver’s license, applying for state services, or even updating tax records. That administrative ease helps explain why participation remains consistently high.
States With the Lowest Registration
At the other end of the spectrum, Arkansas (64.7%), Hawaii (67.6%), and Texas (69.1%) have the lowest registration rates in the country.
The gap between top and bottom states is stark, almost 20 percentage points, and often reflects differences in registration laws rather than voter interest.
- Arkansas lacks automatic registration and has tighter registration deadlines (30 days before an election).
- Texas, with its large and diverse population, faces administrative hurdles and limited outreach in certain rural areas.
- Hawaii’s low numbers are often attributed to high mobility among residents and complex mail registration systems.
These factors suggest that ease of access is the strongest predictor of whether citizens appear on voter rolls.
Voter Turnout vs. Registration
While registration rates averaged 73.6% nationwide, the turnout rate (65.3%) indicates that about one in ten registered voters did not cast a ballot.
This gap, roughly 20 million people, underscores a persistent challenge: getting registered voters to actually participate.
High registration doesn’t automatically translate into high turnout. For instance:
- California had a strong registration rate of 72.9%, but only 64.7% voted.
- Florida, despite its large voter pool, saw just 60.3% turnout.
- In contrast, Minnesota converted most of its registrants into active voters – 75.9% turnout – demonstrating the power of civic culture and convenience voting.
Minor Parties and Unaffiliated Voters
75% of registered voters, including 84% of Republicans, say the outcome of the 2024 presidential election matters more to them than in other years.
The party out of power typically sees the outcome as more important. pic.twitter.com/3jaasoUTfj
— Gallup (@Gallup) November 1, 2024
Minor parties make up a small share of the electorate, but they show how diverse the political landscape has become. Roughly 3.1 million Americans (about 2.6% of all registered voters) are currently registered under smaller parties such as the Libertarian Party, the Green Party, and a long list of local or niche groups identified in state records.
According to the Pew Research Center, states like Kentucky, Delaware, and Alaska consistently report the strongest third-party activity, often doubling the national average. Delaware even includes several unusual options on its rolls, including the “Mandalorian Party.”
The more significant trend is the surge in unaffiliated voters. In several states, independents now represent the largest voting bloc. Massachusetts (64.8%), Alaska (62.1%), and Rhode Island (49.7%) lead the nation in non-affiliated registration, a signal that many voters prefer to stay outside the formal party structure.
This shift has become one of the defining storylines of the 2024 US election results, especially as independents influence close contests in states repeatedly highlighted on the red and blue states map 2024 breakdowns.
As both major parties prepared for the 2024 presidential election, independent voters showed up as a decisive variable in states frequently searched in the 2024 United States elections cycle, including battlegrounds like Arizona, Georgia, Wisconsin, and Nevada.
Their growing presence has also shaped conversations around how to vote in the US, voter access rules, and what each campaign needs to win key districts where party identification no longer predicts behavior.
How Americans Voted in 2024
Voting methods have diversified rapidly:
Methodology
I based this analysis on the most reliable public datasets available for tracking voter registration and turnout across the United States. Most of the numbers come straight from the U.S. Census Bureau’s Current Population Survey (CPS) Voting and Registration Supplement, which is the federal standard for understanding how Americans participate in elections.
To put the 2024 and early-2025 figures into context, I compared them with historical CPS trendlines dating back to the mid-1990s. This makes it easier to see how much the system has changed before and after major election cycles such as the 2024 US election results, the presidential race often framed as Trump 2024, and shifts that appear on every updated red and blue states map 2024.
For state-level comparisons, I used the CPS tables and KFF’s State Health Facts database, which show both registration and turnout as a share of the citizen voting-age population (CVAP). Those numbers were rounded to maintain readability, but no adjustments were made beyond standard survey weighting.
To explain demographic gaps, especially in younger age groups, I relied on the November 2024 CPS microdata. Those results align with turnout patterns seen in battleground states that dominated searches like 2024 election results, Georgia electoral votes, is Arizona red or blue 2024, and is Florida a red or blue state.
Finally, when describing growth over time, I used long-term Census tables and Statista’s national counts to measure changes since 1996. These datasets show how automatic voter registration, online systems, and population growth helped push registration toward an estimated 189.5 million Americans by mid-2025.
FAQ
Related Posts:
- Top 5 States With the Highest Demand for Registered…
- Why Over 25 Million Americans Are Still Uninsured…
- How Much Do Americans Spend on Gifts Each Year?…
- US Health Insurance System Is Driving Americans to the Brink
- Why Americans Are Falling Behind in Life Expectancy…
- Is It Possible to Increase Your IQ Through Practice?…


