
The average IQ in US is around 98 right now, based on the latest numbers from the World Population Review.
Since IQ tests are set up so that 100 is the exact middle, scoring a 98 is completely normal. There are always small differences when you look at different groups. For example, American men average about 99 and women average around 97. That tiny two-point difference is regular testing variation and does not mean much in the real world.
Overall, the U.S. is right in line with the rest of the world. The huge majority of people globally score between 90 and 109, meaning most of us are sitting right in the exact same average bucket.
The Scores are Rising
The average IQ in US has risen over the last few decades, according to data from MedicineNet and historical cognitive studies.
Public investments deserve the credit for the growth. The federal Head Start program, launched back in the 1960s, leveled the playing field for kids in low-income homes. Following a major expansion in the 2000s, research confirms the program still delivers a clear boost to early test scores and sets students up for better academic success down the road.
Individual states see great results from local investments as well. Universal pre-K programs in Oklahoma and Georgia have brought in clear, trackable gains. Kids who go through these early education programs consistently show stronger vocabulary skills and better logical reasoning before hitting elementary school.
Classroom time is only part of the equation. Better childhood nutrition plays a massive role behind the scenes. Programs like WIC (Women, Infants, and Children) and the National School Lunch Program ensure millions of kids get the right nutrients during critical windows of brain development.
| IQ Range | IQ Classification |
| 130 and above | Very Superior |
| 120–129 | Superior |
| 110–119 | High Average |
| 90–109 | Average |
| 80–89 | Low Average |
| 70–79 | Borderline |
| 69 and below | Extremely Low |
Ready to Test Your IQ?
Now that you see how the scores break down, find out where you land on the scale. Take this quick 15-question quiz to get an instant estimate of your own IQ.
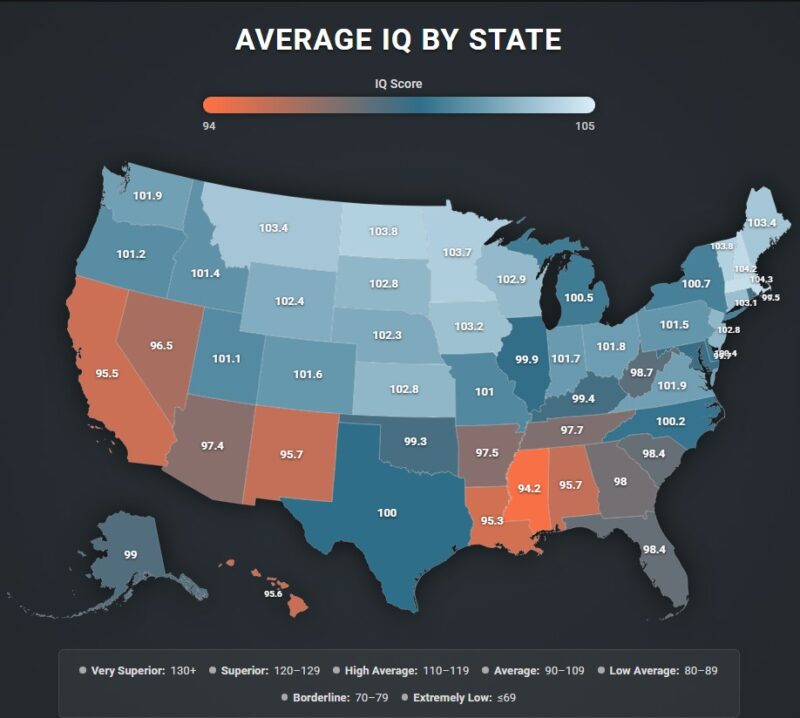
Average IQ in US – State by State Comparison
| Rank | State | Average IQ |
|---|---|---|
| 1 | Massachusetts | 104.3 |
| 2 | New Hampshire | 104.2 |
| 3 | North Dakota | 103.8 |
| 4 | Vermont | 103.8 |
| 5 | Minnesota | 103.7 |
| 6 | Maine | 103.4 |
| 7 | Montana | 103.4 |
| 8 | Iowa | 103.2 |
| 9 | Connecticut | 103.1 |
| 10 | Wisconsin | 102.9 |
| 11 | Kansas | 102.8 |
| 12 | New Jersey | 102.8 |
| 13 | South Dakota | 102.8 |
| 14 | Wyoming | 102.4 |
| 15 | Nebraska | 102.3 |
| 16 | Virginia | 101.9 |
| 17 | Washington | 101.9 |
| 18 | Ohio | 101.8 |
| 19 | Indiana | 101.7 |
| 20 | Colorado | 101.6 |
| 21 | Pennsylvania | 101.5 |
| 22 | Idaho | 101.4 |
| 23 | Oregon | 101.2 |
| 24 | Utah | 101.1 |
| 25 | Missouri | 101 |
| 26 | New York | 100.7 |
| 27 | Michigan | 100.5 |
| 28 | Delaware | 100.4 |
| 29 | North Carolina | 100.2 |
| 30 | Texas | 100 |
| 31 | Illinois | 99.9 |
| 32 | Maryland | 99.7 |
| 33 | Rhode Island | 99.5 |
| 34 | Kentucky | 99.4 |
| 35 | Oklahoma | 99.3 |
| 36 | Alaska | 99 |
| 37 | West Virginia | 98.7 |
| 38 | Florida | 98.4 |
| 39 | South Carolina | 98.4 |
| 40 | Georgia | 98 |
| 41 | Tennessee | 97.7 |
| 42 | Arkansas | 97.5 |
| 43 | Arizona | 97.4 |
| 44 | Nevada | 96.5 |
| 45 | Alabama | 95.7 |
| 46 | New Mexico | 95.7 |
| 47 | Hawaii | 95.6 |
| 48 | California | 95.5 |
| 49 | Louisiana | 95.3 |
| 50 | Mississippi | 94.2 |
The historic Education Reform Act of 1993 completely changed how the state funds and runs its public schools, while world-famous universities like Harvard and MIT help keep the focus on education.
New Hampshire stays near the top because of how the state chooses to spend its money. Local school districts invest about $20,000 per student every year, putting the state in the top five nationwide for school funding. Since local property taxes cover over 70% of that cost, wealthier towns easily pay for smaller class sizes and higher salaries to keep the best teachers around.
Early reading policies make a huge difference. New Hampshire forces schools to step in with summer support if a kid falls behind in reading by third grade. States pushing hard on early literacy always see better math and logic scores later, since you have to know how to read well before you can learn anything else.
In the Midwest, Minnesota, Iowa, and Wisconsin score well because schools focus on practical skills for everyone instead of just helping elite students.
Minnesota spends about $14,500 per student, but the real advantage lies in where the money goes. A massive portion of funds goes straight into career and technical education, plus a community college system that trains over 270,000 students every year.
Local schools work directly with regional employers, so students use math, logic, and problem-solving in real industries like manufacturing, tech, and healthcare. Iowa and Wisconsin use a similar playbook, keeping high school career and tech participation rates above 40%, while many lower-ranked states drop below 25%.
US States With the Lowest IQ
Mississippi's students are excelling in reading and math, despite the state being the poorest in the country and spending less per pupil than most other states.https://t.co/Y6g96aVONf
— KOMO News (@komonews) May 15, 2025
Mississippi and Louisiana sit at the bottom of the list because they took too long to fix their school policies and didn't put enough money into the system.
Mississippi spends under $10,000 a year on each kid, and Louisiana sits around $11,000. That leaves both states thousands of dollars behind the top performers, which completely wrecks classroom stability. Teacher turnover in these areas constantly goes past 15% a year, so kids end up with a revolving door of new, inexperienced teachers.
Waiting too long to pass laws is another huge issue. Mississippi didn't actually push hard on early reading until 2013, when a new law finally forced schools to step in if a kid fell behind by third grade. The top states had those exact rules running for decades. Louisiana has its own mess, like the massive school shakeups after Hurricane Katrina, and advanced classes are mostly locked away in big cities. These lower scores are not a reflection of how smart the kids are. They just show what happens when a school system is unstable.
The exact same thing is happening in fast-growing states like Texas, Florida, and Georgia. Their economies are booming, but local schools can't keep up with the population spike. Spending per student sits below the national average, right between $10,500 and $12,000.
Classrooms are filling up faster than states can hire teachers or open up new preschool slots. Plus, weak early reading rules mean gaps open up early and rarely close. Rich suburbs do fine, but underfunded areas lag way behind, dragging the whole state down to the middle of the pack.
Fixing this requires direct funding for teacher training, open pre-K access, and reliable school lunch programs. Those are the only things that actually turn struggling districts around over time.
How Are IQ Scores Classified?
The standard IQ scale is just an artificial model. The test is rigged so the average stays at 100, which forces about 68 percent of people to land between 85 and 115.
Taking those generic percentages and multiplying them by the US population is just a cheap math trick. Actual scores shift constantly depending on local classrooms, healthcare access, and the local economy. That is the actual reason different states get different results. The map is never perfectly even because actual living conditions break the theory.
| IQ Range | Category | % of Population | Estimated Number of Americans |
|---|---|---|---|
| 130–145 | Genius | 2% | ~6.6 million |
| 115–130 | Gifted | 14% | ~48.6 million |
| 100–115 | Above average | 34% | ~116 million |
| 85–100 | Below average | 34% | ~116 million |
| 70–85 | Mildly challenged | 14% | ~48.6 million |
| 55–70 | Significantly challenged | 2% | ~6.6 million |
Most people sit right in the middle of the scale, and only a tiny percentage land at the very top or bottom.
The numbers show that there is no massive drop in intelligence across the country. On paper, the public sits comfortably within a normal, average baseline.
Average IQ in US Over Time

For decades, researchers tracked a steady rise in IQ scores across industrialized countries. This trend was called the Flynn Effect, named after political scientist James R. Flynn.
In the United States, this growth stayed remarkably consistent throughout the 20th century. Average scores climbed by about 3 points every decade between 1930 and 1990. The boom happened because everyday life got better. People had better access to schools, literacy rates went up, childhood nutrition improved, and basic public health made huge leaps.
But that long upward climb finally hit a wall, and newer data shows the numbers are moving backward.
A 2018 study from Northwestern University and the University of Oregon showed that American IQ scores started a slight downward slide after 1995. The shift stood out most clearly among younger generations. The turnaround is not just happening in the U.S. either. Researchers have found the exact same drops across Europe, including in Norway, Denmark, and the UK.
Timeline of Average IQ in US (1900s–Today)
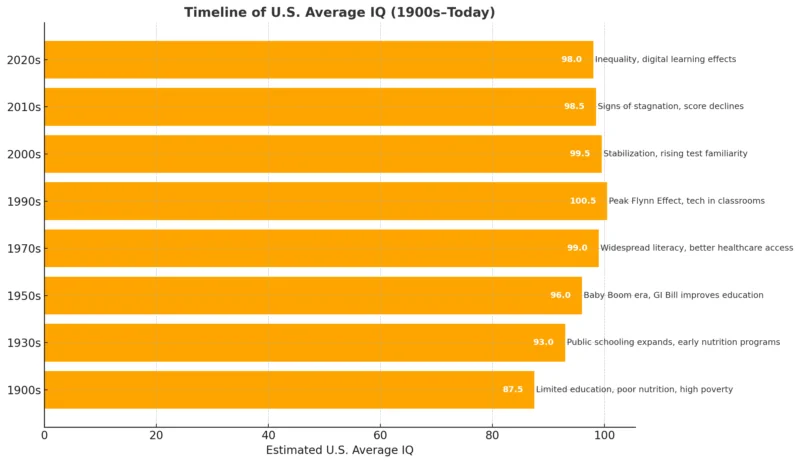
Experts think the massive benefits from introducing better food and basic healthcare have simply leveled off. Now, scores are dropping because school quality is completely uneven across different regions, and deep financial divides are leaving a lot of families behind.
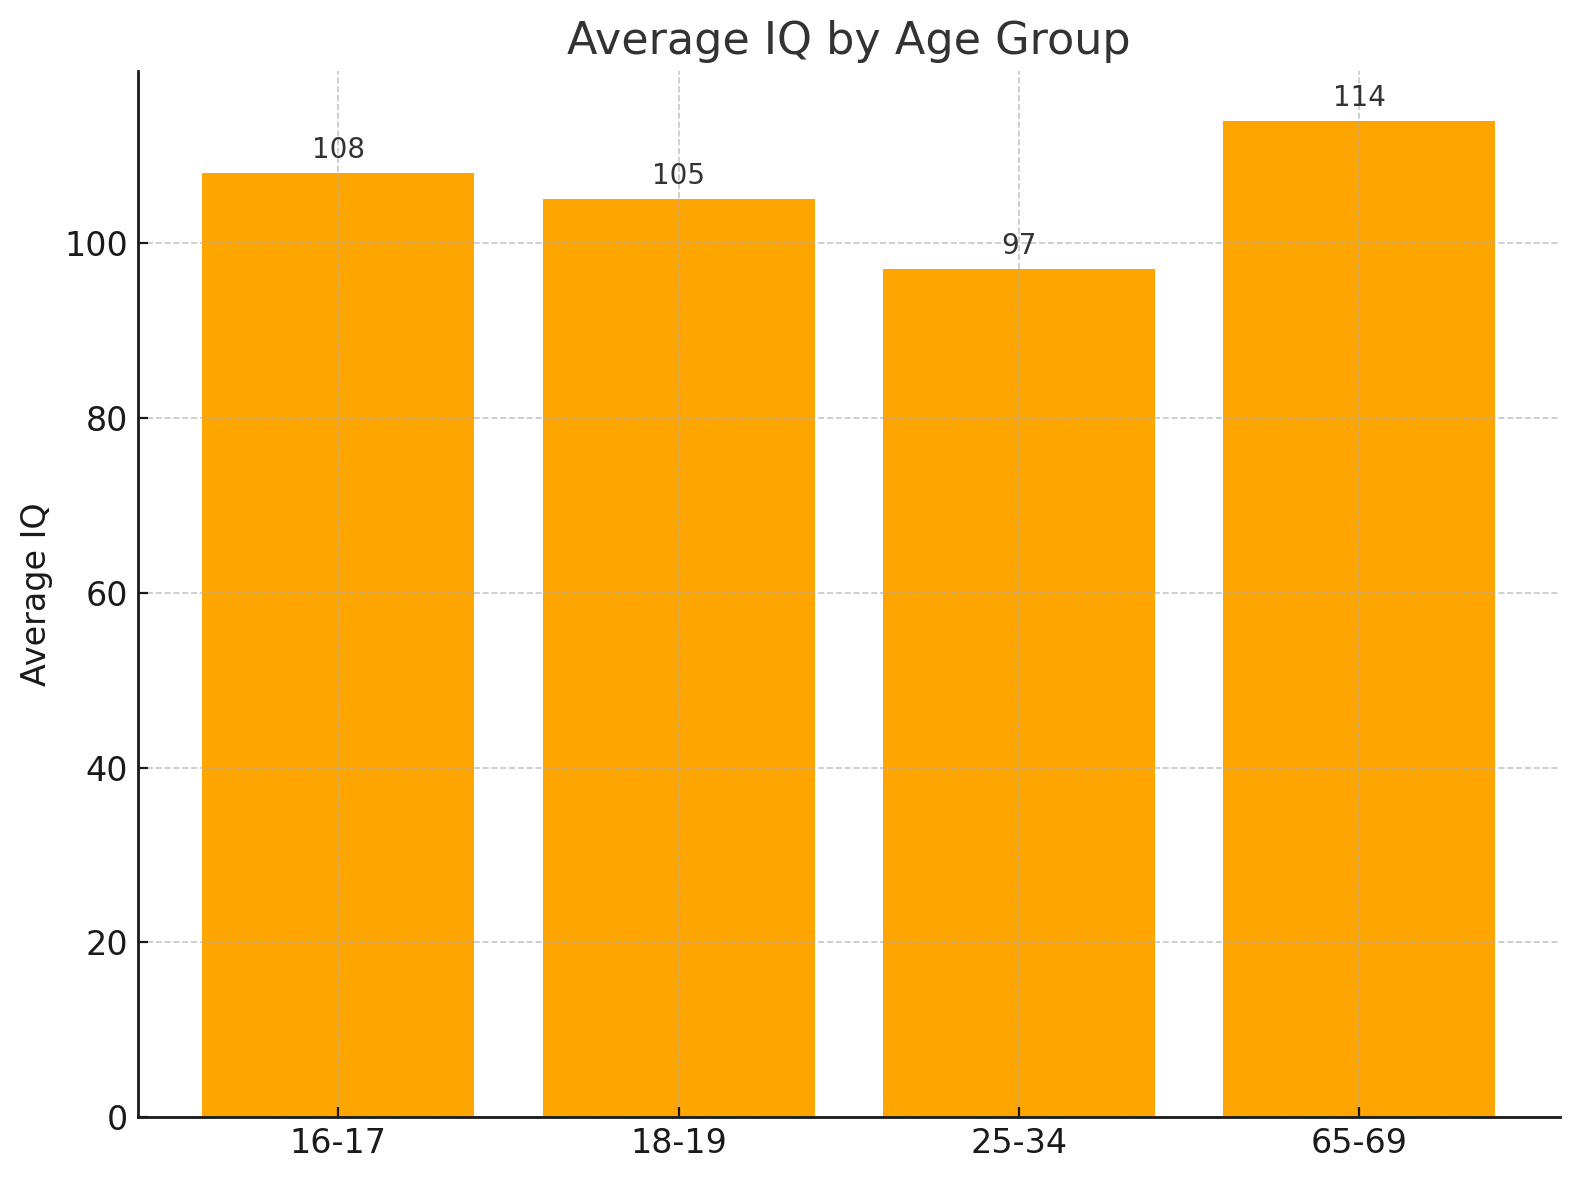
Average IQ Score by Age
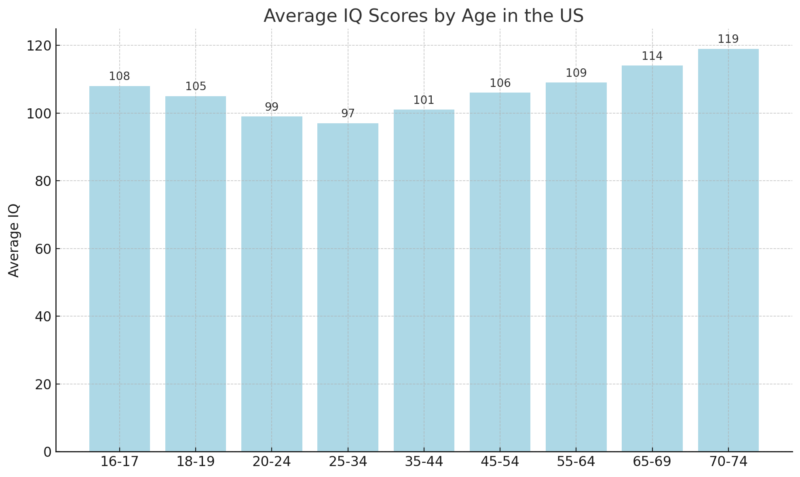
Your mental skills change as you age, but IQ scores stay steady because you are only ever graded against people your own age. Scoring a 100 just means you are perfectly average for your age group, whether you are 18 or 70.
Twentysomethings have the advantage with raw brain speed and quick problem-solving. Older adults lose some of that speed but make up for it with a massive bank of knowledge, vocabulary, and life experience.
Because of that trade-off, losing some processing speed does not mean you are getting dumber. Experience keeps your overall mental performance steady, keeping the average score right at 100 across the board.
Even though the test baseline is always 100, actual averages vary by country depending on schools, healthcare, and standard of living. In the U.S., most data puts the actual national average between 97 and 100, right in line with other developed countries.
Fluid vs. Crystallized Intelligence
Human intelligence is basically split into two parts: fluid ability and crystallized knowledge.
To see how these two parts work together as you get older, you have to look at how they balance each other out:
View this post on Instagram
- Fluid intelligence is your raw brain speed. It is how well you handle brand-new problems, spot patterns, and figure things out on the fly. This quickness peaks during your late teens and early twenties.
- Crystallized intelligence is the opposite. It is the bank of everything you learn over time, like vocabulary, skills, math formulas, and general knowledge built up through school and work. This part often keeps growing well into your older years.
Modern IQ tests look at both sides by mixing up sections like math reasoning, pattern matching, and vocabulary. Because the scoring is broken down by age group, the average stays locked at 100 for every generation.
Sorting the data this way keeps the playing field level. Teenagers and grandparents are only measured against people their own age, ensuring that fast youthful reactions or deep vocabularies built later in life do not skew the results.
IQ Scores and Intelligence Levels
| IQ Scores | Intelligence Level |
|---|---|
| Between 110 and 119 | Superior intelligence or above-average |
| Between 120 and 140 | Superintelligence or gifted |
| Over 140 | Genius or nearly genius |
| Between 80 and 89 | Indicates dullness or lower average |
| Below 70 | Definite low intelligence or "feeble-mindedness." |
IQ tests use basic score ranges to categorize where people sit.
An average score is 100. If you hit 110 to 119, you're above average. The 120 to 140 range is considered gifted, and anything over 140 is labeled genius. Breaking 130 is rare, matching only about 2% of the population. On the other end, scores under 70 usually mean someone faces serious learning difficulties.
For comparison, people estimate Albert Einstein and Ada Lovelace were around 160. Then you have extreme outliers like mathematician Terence Tao, who scored around 230, which puts him in the prodigy tier.
Race, Gender, and Socioeconomic Disparities

Race and Ethnicity
Data from the NCES and APA confirm that test gaps are usually caused by income, family education, and school funding, rather than biology.
- White and Asian American test-takers usually average between 100 and 103.
- Black and Hispanic groups average lower, around 92 to 96, purely tracking with unequal access to resources.
Once you compare families from the exact same economic and educational backgrounds, these gaps pretty much disappear.
Who is More Intelligent, Man or Woman?

Men and women score exactly the same on average.
Massive studies from the APA show the average gap between genders is basically zero. If a test shows any difference at all, it's usually less than a single point, which means nothing statistically.
The only real distinction is how the scores spread out. Men’s scores are slightly more erratic, meaning you see a few more men at the absolute top and bottom of the scale. Women’s scores stick much closer to the middle. But overall, the two groups overlap almost perfectly.
On specific subtests, there are minor trends. Men sometimes do better on spatial tasks, and women often score higher on verbal speed. But these small gaps depend entirely on the specific test and disappear when you look at the total score.
Socioeconomic Status (SES)

Family income and how educated your parents are are the biggest predictors of U.S. IQ scores.
Kids from wealthy families score up to 10 to 15 points higher on average than kids from low-income homes. That gap is not about biology. It is just the reality of having better food, stable healthcare, more books around the house, and parents who can afford a better environment.
Urban vs. Rural Environments and Average IQ
Kids growing up in cities often score a few points higher than rural kids just because their schools have more money, better teacher numbers, and more stuff to do after class.
But it completely flips when you look at small rural states like Vermont or North Dakota. Because their communities actually back their schools, they routinely beat out big states that let their city school districts run out of cash.
| Group / Factor | Average IQ (U.S.) | Key Influences |
|---|---|---|
| White Americans | 100–102 | Education access, socioeconomic range |
| Asian Americans | 102–105 | High educational emphasis, cultural factors |
| Hispanic Americans | 94–96 | Language barriers, poverty rates |
| Black Americans | 92–95 | Historical inequities, underfunded schools |
| High-Income Families | 105+ | Enriched environments, healthcare |
| Low-Income Families | 90–92 | Poverty, limited resources |
| Urban Populations | 99–101 | More school resources, healthcare access |
| Rural Populations | 96–99 | Teacher shortages, but better outcomes in small states |
Average IQ is 100
View this post on Instagram
An IQ score of 100 represents the average for each age group, meaning most people fall within 15 points of that mark. However, it measures only certain cognitive skills, not the full range of human intelligence.
IQ Measurement (Psychometric Standard)

1. Scope and Instruments
What researchers are actually measuring here is general cognitive ability, often called g. In plain terms, it is the overall mental horsepower that shows up across different kinds of thinking tasks.
To measure it, psychologists rely on formal tests like the WAIS for adults, the WISC for kids, and the Stanford–Binet. Trained examiners have to run and score these face-to-face following strict rules so the results are actually reliable.
All of these tests are built the same way under the hood. Scores are compared against people of the same age, with 100 set as the average and 15 points as the standard spread. Most tests break results down into smaller pieces, such as verbal understanding or working memory, and then combine everything into a single Full-Scale IQ score.
2. How Scoring Works?
Tests are given under strict, identical conditions to count up the raw points on each subtest.
Those raw totals are then converted into age-scaled scores using the test's official conversion tables or math models:
Specific index scores come from adding up these scaled subtests. Finally, the publisher's official algorithm combines those pieces to calculate the overall Full-Scale IQ, where 100 is always the exact average and 15 points represents the standard spread.
Margin of Error and Confidence Intervals
No test is perfect, so manuals include a reliability rating (ρ) and a standard error of measurement (SEM) to show the margin of error.
SEM = 15 × √(1 - ρ)
95% Confidence Interval = FSIQ ± 1.96 × SEM
3. Quality Control
- Exclude or flag test sessions conducted under non-standard conditions, such as fatigue, interruptions, coaching, or invalid timing.
- Apply practice-effect corrections if the same test is repeated within a short period.
- Use validated language editions only; results from unstandardized translations should not be interpreted as official IQ scores.
4. Population Estimation (Means, Trends, and Group Comparisons)

Use probability-based samples that cover the target population through multistage stratified sampling by age, sex, region, and socioeconomic status (SES).
Compute design weights (wi) to correct for selection probability, nonresponse, and post-stratification to census margins.
Weighted Mean Formula:
Q̄ = (∑ wiQi) / ∑ wi
Variance and Confidence Interval:
Var(Q̄) = gT Σ g
95% CI = Q̄ ± 1.96 × √(Var(Q̄))
State or regional estimates require representative samples or model-based small-area estimation (SAE) with clear uncertainty reporting. Always report the mean, standard error, 95% CI, and sample size for each region.
Use the same test instrument and norm set across time points, or apply item response theory (IRT) linking and equating to ensure results remain on a common scale.
If a test publisher provides Flynn Effect adjustments, document them explicitly; otherwise, treat renormed scores as a completely new metric.
5. Fairness and Validity Checks
Verify measurement invariance and test for differential item functioning (DIF) across sex, language, race/ethnicity, and SES groups.
If invariance does not hold, limit cross-group comparisons to invariant subtests or use statistical alignment methods to adjust results.
6. Reporting Standards
Every reported mean (national, subgroup, or state-level) must include:
- Test instrument and version
- Norm year and administration years (for example, 2023–2026)
- Unweighted and effective sample size
- Weighted mean, standard error (SE), and 95% CI
- Design description (strata, clusters, PSUs)
- Exclusion criteria and sensitivity analyses (for example, with or without language accommodations or retests)
7. Limitations
- Sampling error and coverage bias: Nonresponse or underrepresentation of certain groups can skew population estimates.
- Mode and context effects: Results differ between school, clinic, and online settings; only publisher-approved modes are valid.
- Construct boundaries: IQ measures specific cognitive abilities but does not capture creativity, motivation, or personality traits.
- Ecological fallacy: Group averages describe populations, not individual performance.
- Causality: Observed differences between groups are correlational, not causal.
8. Key Formulas (for reference)
Individual 95% Confidence Interval:
FSIQ ± 1.96 × 15 × √(1 - ρ)
Weighted Mean IQ:
Q̄ = (∑ wiQi) / ∑ wi
Replicate-Based Standard Error (BRR/JKn):
SE(Q̄) = √(∑ cr(Q̄r - Q̄)2)
(where cr represents replication scheme constants)
The Evolution of Testing

The whole concept of IQ testing started back in the late 1800s when researchers first tried to put a number on human intelligence. By 1905, Alfred Binet built the first actual intelligence test, mostly just to figure out which school kids needed extra help in class.
Not long after, a German psychologist named William Stern took Binet’s ideas and coined the term "intelligence quotient." That is exactly where the letters "IQ" come from.
As the decades went on, these tests changed from measuring simple classroom learning to testing real-world reasoning. Instead of using old formulas, modern scoring matches your results against people your exact same age. When people look up the average IQ score by age, they are looking at these updated charts that track how intellectual development shifts across a lifespan.
Globally, the baseline average IQ is always set at 100. In the United States, the average typically floats right between 97 and 100 depending on the specific test and data pool.
Even with all these updates, plenty of experts point out the massive blind spots in traditional testing. A single score might tell you something about logic or memory, but it completely misses things like creativity, emotional depth, and everyday street smarts where numbers do not tell the full story.
Applications of IQ Testing
IQ tests serve multiple purposes, including:
- Evaluating cognitive abilities like memory, problem-solving, and processing speed.
- Assessing eligibility for specific jobs and educational programs.
- Diagnosing intellectual disabilities.
- Supporting psychological and neurological research.
Factors Influencing IQ
Several factors can affect IQ, including genetics, environment, health, education, and early childhood musical training.
IQ scores typically remain stable across lifespan age norms, but raw cognitive speed may peak in early adulthood and gradually decline in older age. Cultural practices and brain anatomy development also play roles in shaping an individual’s performance on cognitive metrics.
Case Studies and Real-Life Examples
People with highest IQ:
1. Wm. James Sidis: 250-300
2. Terence Tao: 225-230
3. Christopher Hirata : 225
4. Kim Ung Yong: 210
5. Garry Kasparov: 194
6. Marilyn Vos Savant: 190
7. Leonardo da Vinci: 190
8. Judit Polgar: 170
9. A. Einstein: 160-190
10. S. Hawking: 160— World of Statistics (@stats_feed) October 19, 2021
High IQ scores can make certain academic or technical fields easier to break into, but they don't guarantee a thing. Plenty of people with completely average or lower scores absolutely dominate in the real world because they have grit, creativity, and the social skills to actually get things done.
A test score might measure how fast you solve a logic puzzle, but it can't measure drive, focus, or basic work ethic.
Here are some well-known examples:
| Name | IQ Score | Contribution |
|---|---|---|
| Albert Einstein | 160–180 | Revolutionized physics with the theory of relativity. |
| Terence Tao | 211–230 | Advanced mathematics in number theory and harmonic analysis. |
| Ada Lovelace | Estimated 170 | Pioneered computer programming concepts as the first programmer. |
In contrast, people with average or below-average IQs show that intelligence scores alone do not define success:
| Name | IQ Score | Achievement |
|---|---|---|
| Richard Feynman | 125 | Nobel Prize-winning physicist known for breakthroughs in quantum mechanics. |
| Muhammad Ali | 78 | World boxing champion, renowned for his strategic thinking, speed, and charisma. |
What IQ Score Does Not Measure?

IQ isn't a scorecard for how smart you are overall. It just measures a very specific set of mental skills, leaving out a massive chunk of what actually makes people successful or fulfilled.
Here is what traditional testing completely misses:
- Drive and Grit: A person's work ethic and determination usually predict long-term success way better than a high test score ever will.
- Creativity: IQ tests look for one right answer. They can't measure your ability to think outside the box, come up with original ideas, or solve problems creatively.
- Dealing with people: Empathy, self-awareness, and knowing how to work with others are what actually make good leaders. A high IQ won't save you if you can't navigate a room.
- Practical experience: Knowing how to handle complex situations or adapt to messy, everyday problems comes from life experience, not from being good at taking tests.
To get an actual, honest picture of someone's strengths, psychologists have to look way past IQ. They use other tools like emotional intelligence scales, creativity tests, and personality profiles to fill in the massive blanks left behind by standard testing.
IQ Beyond Academics

IQ measures cognitive skills like reasoning and memory, but life success involves more dimensions.
Key additional dimensions of intelligence include:
| Type of Intelligence | Description | Examples of Professions |
|---|---|---|
| Emotional Intelligence (EQ) | Ability to manage emotions and empathize with others. | Counseling, Leadership, Social Work |
| Practical Intelligence | Solving real-world problems effectively. | Entrepreneurs, Tradespeople |
| Creativity | Innovating and generating new ideas. | Artists, Engineers, Scientists |
For example, leaders like Steve Jobs leveraged creativity more than traditional cognitive skills, reshaping industries with innovative products, as noted in HBR.
While IQ correlates moderately with academic performance, other factors, such as adaptability and emotional resilience, are strong predictors of career and personal achievements.
IQ vs. EQ Debate
View this post on Instagram
Think of IQ and EQ as two completely different toolkits.
IQ is just your mental engine. It deals with logic, memory, and how fast you can solve a complex problem. It is great for passing exams or handling technical, analytical work, but that is where its boundary ends.
EQ is about how you handle people and pressure. It is your ability to read a room, control your own stress, show empathy, and navigate messy social situations. This is what actually matters when it comes to teamwork and leadership.
The data over the last twenty years makes the split pretty obvious. A high IQ might get you through the door, but your EQ determines how far you actually climb.
In fact, research published by Harvard Business Review found that roughly 90% of top-performing managers have high EQ scores, even if their IQ is completely average. When you get out into the real world, knowing how to deal with people almost always matters more than technical metrics.
Comparison of IQ and EQ
| Trait | IQ (Cognitive Intelligence) | EQ (Emotional Intelligence) |
|---|---|---|
| Measures | Logic, reasoning, problem-solving, and memory | Empathy, self-awareness, emotional regulation, and social skills |
| Predicts | Academic performance, technical skills | Leadership, teamwork, resilience, adaptability |
| Peak | Late adolescence (16–20 years) | Improves continuously with life experience |
| Example Professions | Scientists, engineers, analysts | Managers, counselors, negotiators |
Can Nutrition Affect Your IQ Score?

What you eat directly impacts how the brain develops and handles cognitive tasks. Getting the right nutrients, especially early on, makes a massive difference in how those metrics turn out.
For example, omega-3 fatty acids like DHA and EPA are essential for brain cell membrane function. Getting enough of them during developmental stages has been shown to increase IQ scores by an average of three to four points.
Iodine is just as critical because of its role in thyroid function. A severe iodine deficiency during pregnancy is actually one of the leading preventable causes of lower IQ worldwide, dropping scores by 10 to 15 points in severe cases.
The data backs this up. A study published in The Lancet found that children who received balanced nutrition before the age of five scored significantly higher on intelligence tests later in life. When kids miss out on iron and other key micronutrients, it directly impairs their memory, attention span, and ability to solve problems.
Nutritional Factors and IQ Impact
| Nutrient | Cognitive Role | Estimated IQ Impact |
|---|---|---|
| Omega-3 (DHA/EPA) | Brain development, memory | +3–4 points |
| Iodine | Thyroid, cognitive growth | +10–15 points if deficiency corrected |
| Iron | Memory, attention span | +2–3 points |
| Protein & Vitamins | Overall development | Supports stable growth metrics |
Global Comparisons of Average IQ
 Global comparisons of IQ
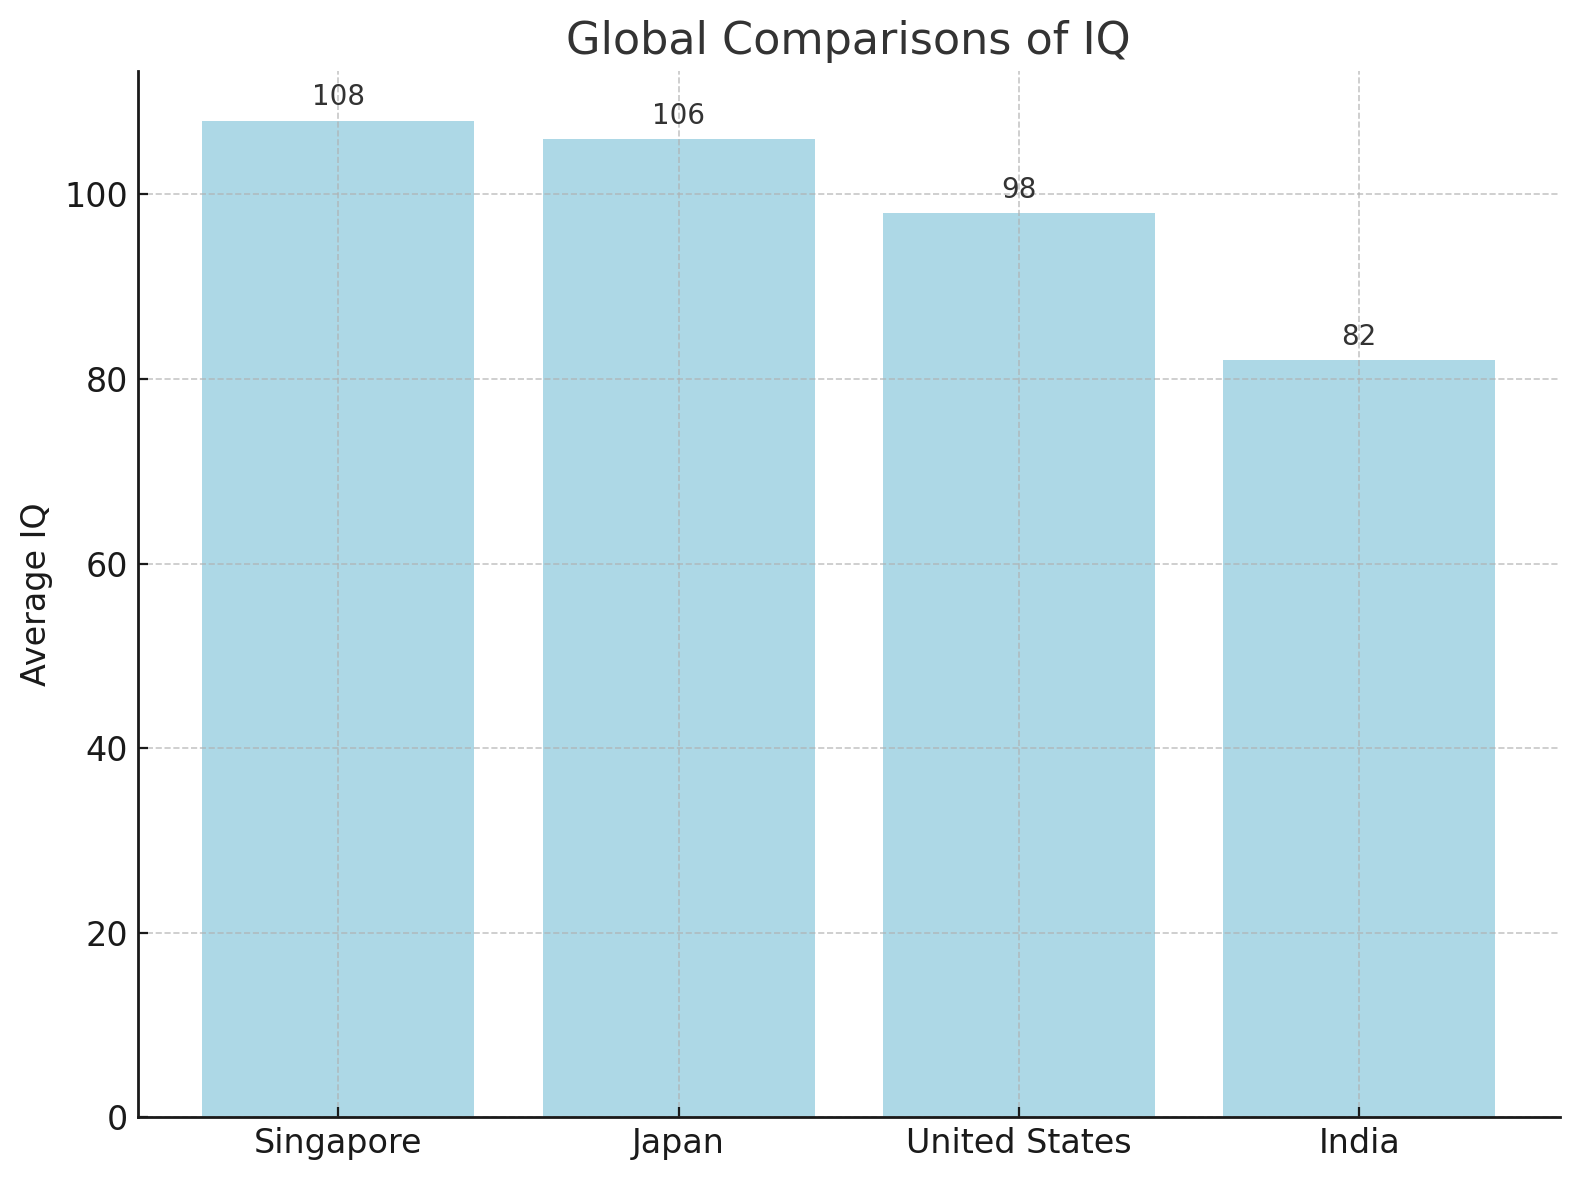
When you look at IQ scores around the world, the numbers change drastically from country to country. That has nothing to do with people being naturally smarter or dumber in different places. It comes down to basic living conditions like schooling, healthcare, food, and stability.
Places with heavily funded schools and great healthcare, like Singapore, Japan, and South Korea, see their national averages top 105. On the other hand, places dealing with broken infrastructure, underfunded classrooms, and health crises see much lower scores.
Statistics and Visual Insights
Based on standardized data, cognitive metrics scale across the lifespan:
Here’s a general breakdown of global IQ distribution patterns:
- Above 105: Highly developed economies with strict educational standards (e.g., Singapore, Japan).
- 90–105: Most European nations, the United States, and highly industrialized regions.
- Below 90: Developing nations are working to overcome systemic limitations in education and healthcare infrastructure.
Limitations and Misconceptions
@rorysutherlandclips IQ tests are only a small piece of the puzzle #rorysutherland #rorysutherlandclips #fyp #foryou #podcast #podcastclips #marketing #iqtest #gamer ♬ Cheek pop - unknown
While IQ tests measure specific cognitive processes, they completely miss huge parts of human intelligence, like artistic creativity, practical common sense, or spatial intuition outside a testing room.
A high score doesn't guarantee professional or personal success, especially in high-stress, real-world, or social situations.
Relying too much on raw test metrics can also introduce systemic bias and societal prejudice if you ignore cultural variables.
Being smart isn't just one thing. Qualities like adaptability, emotional health, and practical judgment extend way beyond what a single test score can capture.
Discover Your IQ Potential in Minutes
You’ve learned what the numbers mean; now it’s time to see where you stand. Try this quick, science-based IQ quiz and get your personalized score right away.
FAQs
Disclaimer

Comparing national IQ scores looks simple on the surface, but it is a massive debate. These numbers do not just happen out of nowhere. They are completely tied to how a country funds its schools, handles healthcare, and deals with poverty.
When you see gaps in test scores between countries, you are usually looking at a lack of opportunity, not a lack of natural brains. Kids who grow up with great schools and solid healthcare obviously do better on tests that are built around school logic.
Both the OECD and the World Bank explicitly warn against using these rankings to say one group is biologically smarter than another. Their data shows that things like teacher quality, early childhood programs, and fair funding completely change test results. They also found that simple things like malnutrition or missing out on school years can easily drop a whole country's average by several points.
Methodology & Data Integrity
This analysis combines test scores and socioeconomic data from public health repositories, educational research bodies, and national databases.
Data Sources & Core Benchmarks
To build a reliable profile of cognitive metrics across the United States, data was checked and verified using these tracking systems:
- National Baseline Metrics (MedicineNet): Used to establish the baseline US national average and investigate how scores break down between men and women on standardized tests.
- State-Level Test Aggregations (DataPandas): Our primary dataset for comparing different states, built from regional psychometric evaluations and performance samples.
- Peer-Reviewed Studies (NCBI / APA): Long-term studies from recent research cycles were analyzed to understand age-based cognitive trajectories, brain development, and population-wide shifts.
- Other Types of Intelligence (Verywell Mind / Harvard Business Review): Used to show the clear limits of traditional IQ scores by bringing in frameworks on Emotional Intelligence (EQ), behavioral resilience, and practical leadership.
Statistical Standardization & Processing
This assessment focuses on the current 2025-2026 cycle to ensure the integration of recent population updates.
- Population Weighting: Raw state-level numbers were calculated using weighted means to accurately account for different state populations and prevent regional sampling variance from warping the trends.
- Normal Distribution Alignment: Following standard psychometric rules, all calculations assume a standard bell curve centered around a baseline population average of 100 with a standard deviation of 15.
- Rounding Thresholds: For statistical consistency and alignment with baseline reporting protocols, final numbers are rounded precisely to one decimal place.
Uncertainty & Methodological Limitations

Because the United States lacks a mandatory, federally run intelligence census, blending different datasets naturally introduces a margin of error.
Different regions use different testing tools, specifically across the WAIS-IV, WISC-V, and Stanford–Binet models, which creates baseline measurement variance in the raw data.
Accounting for uneven sample sizes and geographic reporting gaps, the estimated margin of error sits around ±1.5 points at the state level and ±1.0 point at the national level. Ultimately, this dataset tracks regional school investments and demographic trends rather than fixed biological capacity.
References
- American Psychological Association. (n.d.). Men and women: No big difference. https://www.apa.org/topics/personality/men-women-difference
- DataPandas. (2024). Average IQ by state. https://www.datapandas.org/ranking/average-iq-by-state
- Harvard Business Review. (2012). The real leadership lessons of Steve Jobs. https://hbr.org/2012/04/the-real-leadership-lessons-of-steve-jobs
- Lynn, R., & Irwing, P. (2004). Sex differences on the Progressive Matrices: A meta-analysis. Intelligence. https://emilkirkegaard.dk/en/wp-content/uploads/R.-Lynn-and-P.-Irwing-Sex-differences-on-the-Progressive-Matrices-a-meta-analysis1.pdf
- MedicineNet. (n.d.). What is the normal range for IQ? https://www.medicinenet.com/what_is_the_normal_range_for_iq/article.htm
- National Center for Biotechnology Information. (n.d.). The relationship between age and cognitive development. https://pmc.ncbi.nlm.nih.gov/articles/PMC3650086/
- National Center for Biotechnology Information. (n.d.). Global IQ averages and educational impact. https://pmc.ncbi.nlm.nih.gov/articles/PMC6088505/
- OECD. (n.d.). Programme for International Student Assessment (PISA). https://www.oecd.org/en/about/programmes/pisa.html
- Verywell Mind. (n.d.). Are people with high IQs more successful? https://www.verywellmind.com/are-people-with-high-iqs-more-successful-2795280
- World Bank. (2020). The human capital index 2020 update: Human capital in the time of COVID-19. https://documents1.worldbank.org/curated/en/456901600111156873/pdf/The-Human-Capital-Index-2020-Update-Human-Capital-in-the-Time-of-COVID-19.pdf
- Study.com. (n.d.). IQ scores form a normal distribution (μ=100, σ=15): What proportion scores above 140? https://homework.study.com/explanation/iq-scores-form-a-normal-distribution-with-mu-100-and-sigma-15-individuals-with-iqs-above-140-are-classified-in-the-genius-category-what-proportion-of-the-population-consists-of-geniuses-a-0-9962-b-0-5038-c-0-4962-d-0-0038.html