

On paper, the definition is straightforward: a household falls into the middle class if it earns between two-thirds and double the median income in its state.
In practice, though, middle-class income in 2025 looks very different depending on where a family lives and how far their money actually goes.
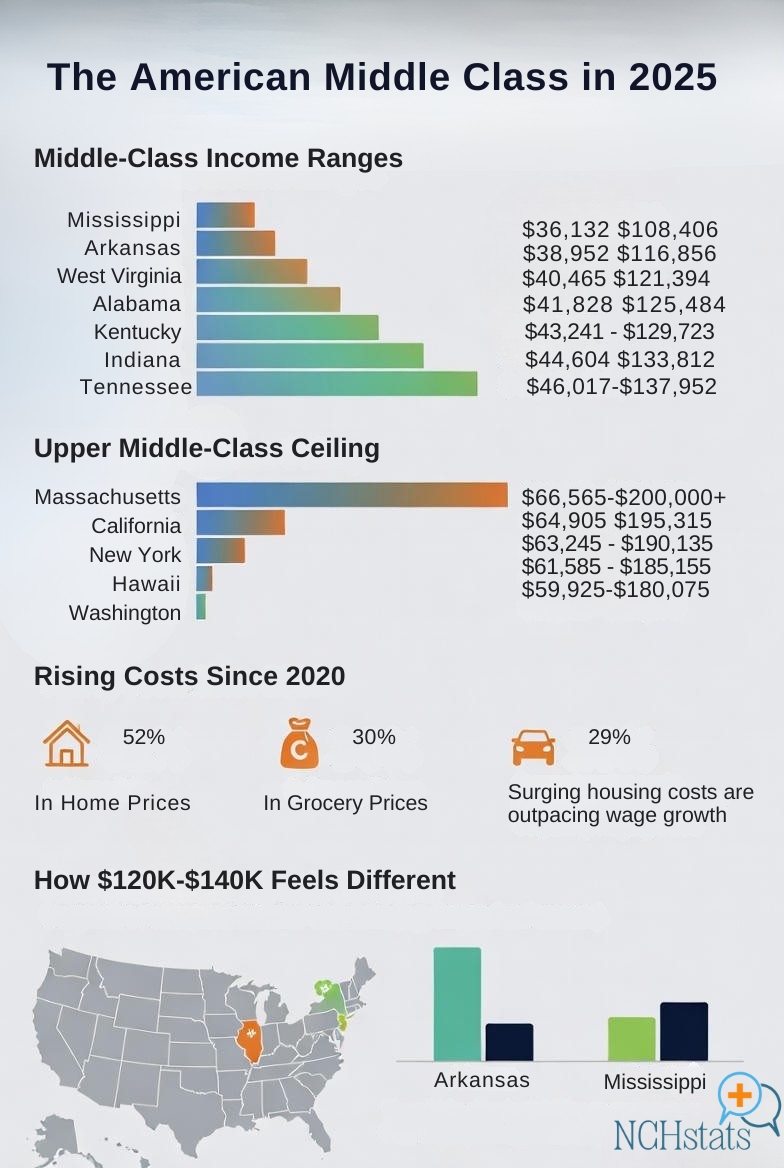
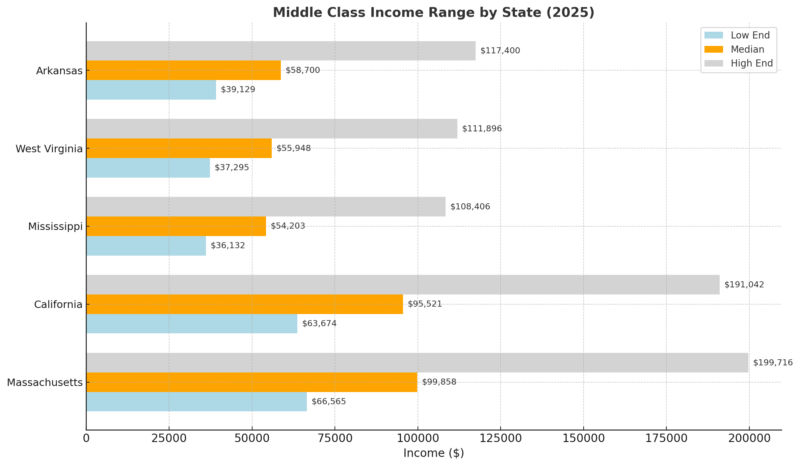
SmartAsset’s review of U.S. Census Bureau data shows just how wide the range has become. The middle-class threshold starts at roughly $36,000 in Mississippi and stretches to nearly $200,000 in Massachusetts and New Jersey.
That means the answer to what annual income is considered middle class or what yearly income is considered middle class depends completely on your state’s cost of living.
The shift is even more obvious when you look at how people feel about their own finances. A six-figure salary once signaled comfort, sometimes even abundance. Today, in many high-cost regions, it places you squarely in the middle, or even in the lower middle class income range once housing, childcare, groceries, and taxes are factored in.
In contrast, the same salary may push a family toward upper-middle-class income in states where living costs are lower.
Since 2020, the cost of nearly everything tied to everyday life, housing, groceries, childcare, car insurance, and utilities, has climbed faster than incomes. Inflation has eased, but the damage from the past few years lingers.
Even families earning $120,000 in 2025 often describe the same feeling: We make good money, so why does it still feel tight?
State-by-State Comparison
Below, you can see what’s considered middle class in your state.
State
Low End of Middle Class
High End of Middle Class
Median Household Income
Alabama
$41,471
$124,424
$62,212
Alaska
$57,748
$173,262
$86,631
Arizona
$51,538
$154,630
$77,315
Arkansas
$39,129
$117,400
$58,700
California
$63,674
$191,042
$95,521
Colorado
$61,934
$185,822
$92,911
Connecticut
$61,104
$183,330
$91,665
Delaware
$54,235
$162,722
$81,361
Florida
$48,869
$146,622
$73,311
Georgia
$49,750
$149,264
$74,632
Hawaii
$63,542
$190,644
$95,322
Idaho
$49,956
$149,884
$74,942
Illinois
$53,532
$160,612
$80,306
Indiana
$46,313
$138,954
$69,477
Iowa
$47,617
$142,866
$71,433
Kansas
$46,884
$140,666
$70,333
Kentucky
$40,741
$122,236
$61,118
Louisiana
$38,815
$116,458
$58,229
Maine
$49,150
$147,466
$73,733
Maryland
$65,779
$197,356
$98,678
Massachusetts
$66,565
$199,716
$99,858
Michigan
$46,117
$138,366
$69,183
Minnesota
$56,718
$170,172
$85,086
Mississippi
$36,132
$108,406
$54,203
Missouri
$45,692
$137,090
$68,545
Montana
$47,198
$141,608
$70,804
Nebraska
$49,722
$149,180
$74,590
Nevada
$50,904
$152,728
$76,364
New Hampshire
$64,552
$193,676
$96,838
New Jersey
$66,514
$199,562
$99,781
New Mexico
$41,508
$124,536
$62,268
New York
$54,725
$164,190
$82,095
North Carolina
$47,198
$141,608
$70,804
North Dakota
$51,012
$153,050
$76,525
Ohio
$45,175
$135,538
$67,769
Oklahoma
$41,421
$124,276
$62,138
Oregon
$53,435
$160,320
$80,160
Pennsylvania
$49,211
$147,648
$73,824
Rhode Island
$56,642
$169,944
$84,972
South Carolina
$45,198
$135,608
$67,804
South Dakota
$47,869
$143,620
$71,810
Tennessee
$45,083
$135,262
$67,631
Texas
$50,515
$151,560
$75,780
Utah
$62,274
$186,842
$93,421
Vermont
$54,135
$162,422
$81,211
Virginia
$59,948
$179,862
$89,931
Washington
$63,064
$189,210
$94,605
West Virginia
$37,295
$111,896
$55,948
Wisconsin
$49,749
$149,262
$74,631
Wyoming
$48,272
$144,830
$72,415
Even though more households earn six-figure salaries today, many middle-class families still feel stretched. Wages have improved since 2022, but those gains have been overshadowed by the steady rise in living costs that began in 2020 and never fully eased.
Housing and food have been the hardest hit. From January 2020 to December 2024, home prices climbed 52 percent (Case-Shiller), and grocery prices rose 30 percent (CPI). Overall inflation grew 25 percent, but families feel the specific categories that jumped the most, not the average.
It’s no surprise, then, that nearly two-thirds of middle-class Americans said they were struggling financially in a 2024 National True Cost of Living Coalition survey. Inflation has cooled to around 3 percent a year, far below the 2022 peak, yet the cumulative price increases remain. Once housing, childcare, insurance, and food jumped, they stayed high.
That’s why a six-figure income doesn’t stretch the way it once did. In many states, it falls right in the middle of the middle-class income 2025 range, and for some households, especially in expensive regions, it can even feel close to lower-middle-class income when monthly expenses pile up.
Are You In the Middle Class?

Income tiers in the U.S. aren’t as straightforward as people think. Whether a household falls into the lower, middle, or upper tier depends on two big factors: the cost of living in an area and how that income stretches across the number of people in a home. That’s why what income is considered middle class looks different in every corner of the country.
Roughly 28 percent fall below that range, and about 19 percent land in the upper middle class income tier or higher. But those numbers shift dramatically once you zoom in on specific metro areas.
Instead of treating every household the same, incomes are adjusted for family size. A three-person home serves as the reference point, so smaller households get nudged upward and larger households get scaled down. After this adjustment, local costs come into play, which is why what annual income is considered middle class never follows a single national rule.
Pew Research Center also created an interactive calculator that estimates your income tier based on where you live and how many people share your household.
View this post on Instagram
Nationally, the middle tier for a three-person household covered roughly $56,600 to $169,800 (in 2022 dollars). Falling below that places a household in the lower middle class income or lower tier; going above it lands a family in the upper income range.
Living in a low-cost area means the middle-class threshold drops. In a city like Jackson, Tennessee, where prices sit well below the national average, a household needs just over $49,000 to meet the middle-class entry point. Meanwhile, in a high-cost metro such as San Francisco, the starting line pushes closer to $67,000 simply because day-to-day expenses are so much higher.
This is exactly why what yearly income is considered middle class can never be answered with a single dollar amount — the math changes the moment you change ZIP codes.
Wide Gaps Between States
From the @WSJ:
“The [US] middle class—generally considered to include households making roughly $53,000 to $161,000 a year—is playing an outsize role in that waning optimism. After months of tracking high-income earners’ increasing confidence about the economy, households making… pic.twitter.com/HzW7NQPmF0— Mohamed A. El-Erian (@elerianm) August 31, 2025
When I review the numbers for middle-class income 2025, the first thing I notice is how dramatically the thresholds shift from one state to another.
SmartAsset’s latest Census-based analysis shows the entry point for what income is considered middle class starts at about $36,132 in Mississippi and rises to $66,565 in Massachusetts, with the upper middle-class range in states like Massachusetts and New Jersey pushing close to $200,000.
Whenever people ask me what annual income is considered middle class, this is the reason there is no single answer; it depends entirely on where you live.
From an economic perspective, high-income states sit at the top of the range for predictable reasons.
Massachusetts, New Jersey, and California rely heavily on tech, finance, biotech, government contracting, and other sectors that push median earnings upward. Higher incomes, however, come with higher costs.
Housing markets are tight, childcare is expensive, and tax burdens are often heavier. Even households earning what might look like upper-middle-class income on paper end up sitting squarely in the middle tier once living expenses are factored in.
On the other end of the spectrum, states like Mississippi, West Virginia, and Arkansas show much lower thresholds.
Wages are smaller, yes, but essential expenses are also far more manageable. Median home prices are well below national levels, utilities and food costs remain lower, and healthcare spending is less demanding.
That combination keeps the lower middle-class income boundary and the overall middle-class range far more modest.
Inflation’s Lingering Impact
The pandemic and its aftermath have reshaped household finances. From Januamry 2020 to December 2024, the U.S. saw:
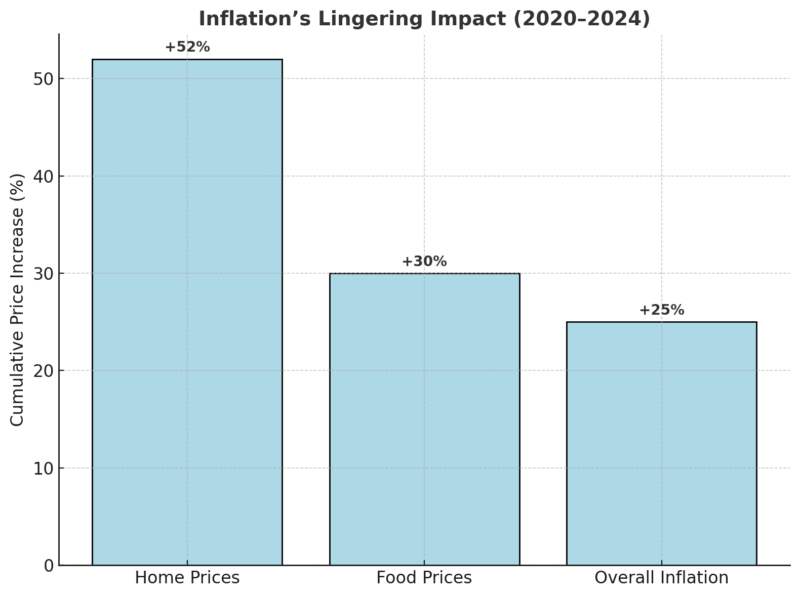
Even though inflation slowed to ~3% in 2024–2025 (close to the Fed’s 2% target), the cumulative effect has been devastating.
According to a 2024 National True Cost of Living Coalition survey, nearly two-thirds of middle-class Americans said they were struggling financially and didn’t expect things to improve.
This means a household making $100,000 today has the same purchasing power as about $80,000 in 2020.
So while more households report six-figure salaries, their standard of living has not risen at the same pace.
Where Six Figures Still Doesn’t Go Far
View this post on Instagram
Take the major coastal states. In Massachusetts, California, New York, and Hawaii, a household earning between $120,000 and $140,000 is technically within the middle class, but living costs in these regions erase much of the financial breathing room that the salary once offered.
The biggest pressure point is housing. In Boston, the average home value sits around $766,000. In the San Francisco area, average rent is now hovering near $3,600 per month, and a typical two-bedroom apartment in the city jumps to about $4,565 per month.
New York City remains just as tough. Between rent, transit, taxes, and childcare costs that routinely reach $2,000 to $3,000 per month per child, many households earning what used to feel like “upper middle class income” are simply breaking even each month.
A salary that might register as upper middle class income on a national chart can easily behave like lower middle class income once you factor in the local rents, mortgages, tax rates, and childcare bills.
The contrast becomes even clearer when you look at lower-cost states. In Arkansas, Mississippi, and parts of West Virginia, median home prices remain comfortably under $200,000. Everyday expenses, food, utilities, insurance, transportation, sit far below national averages.
A household earning six figures in these regions often lands near the top of the state’s middle-income range and experiences a very different lifestyle than a similar household on the coasts.
National Context
At the national level, the median U.S. household income is around $85,157 (U.S. Census Bureau, 2025). That means, under Pew’s the middle class nationally = $50,000–$150,000 (two-thirds to double).
But the range shifts dramatically depending on state-specific medians.
For example, in Maryland, a household can make nearly $200,000 and still be considered middle class. In Mississippi, making $110,000 puts you at the very top of the middle class range.
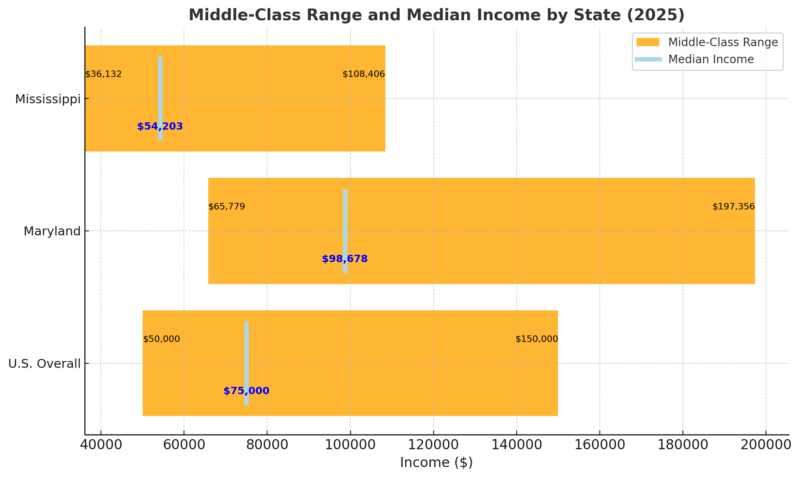
This national overview highlights the geographic inequality of middle-class life. Living standards are increasingly determined by local housing markets, job concentrations, and inflation pressures rather than just salary figures.
Methodology
This report uses the most recent nationwide income and cost-of-living data to define middle class income 2025 and compare how the middle class varies across U.S. states and metro areas.
1. Income Classification
Middle-class income follows the Pew Research Center standard:
This method adjusts the definition to each state’s economic conditions, rather than relying on one national number.
2. Data Sources
State income ranges come from 2023 U.S. Census Bureau ACS data, summarized in SmartAsset’s February 2025 analysis. For each state, three values were used:
3. Inflation and Cost-of-Living
To explain what annual income is considered middle class in real-world terms, the analysis includes:
These sources show why the same income can act like upper-middle-class income in one state and lower-middle-class income in another.
4. Housing, Rent, and Childcare
Local costs were added using:
These values illustrate the financial pressure on households earning six figures in high-cost markets.
5. Metro-Level Comparison
Pew Research Center’s income calculator was referenced to:
This explains why what yearly income is considered middle class can vary widely even within the same state.
6. National Context
The analysis includes the 2025 national median household income ($85,157) to place state ranges in context.
Bottom Line
After going through the numbers for middle-class income 2025, one thing is clear to me: being middle class in America is less about your paycheck and more about the place you live.
A household earning $100,000 in Mississippi often feels solidly upper middle class, but that same income in Massachusetts or California barely covers the essentials once housing, childcare, taxes, and everyday costs are added in. I see this contrast in almost every dataset I review.
@skynews Inflation remained the same in September at 3.8%, the latest Office for National Statistics figures show. While the figure is still relatively high, it’s lower than expected. Economists had widely predicted that it would reach a peak of 4% in September before starting to fall. #inflation #economy #money ♬ original sound – Sky News
The pandemic years changed the financial landscape in ways that still haven’t fully unwound. Inflation in US may have slowed, but the cumulative increases in food, housing, healthcare, insurance, and utilities have reshaped how far a middle-class salary can stretch.
Many families earning what used to feel like a comfortable six-figure income now describe a constant sense of financial pressure, a feeling that would have seemed unlikely a decade ago.
Nationally, the middle class still falls roughly between $50,000 and $150,000, but the lived reality behind those numbers is highly uneven.
The middle-class experience in Boston, San Francisco, or New York City has little in common with life in Little Rock, Jackson, or Charleston.
The same income can land a household in the lower middle class income range in one city and near the top of the middle tier in another.