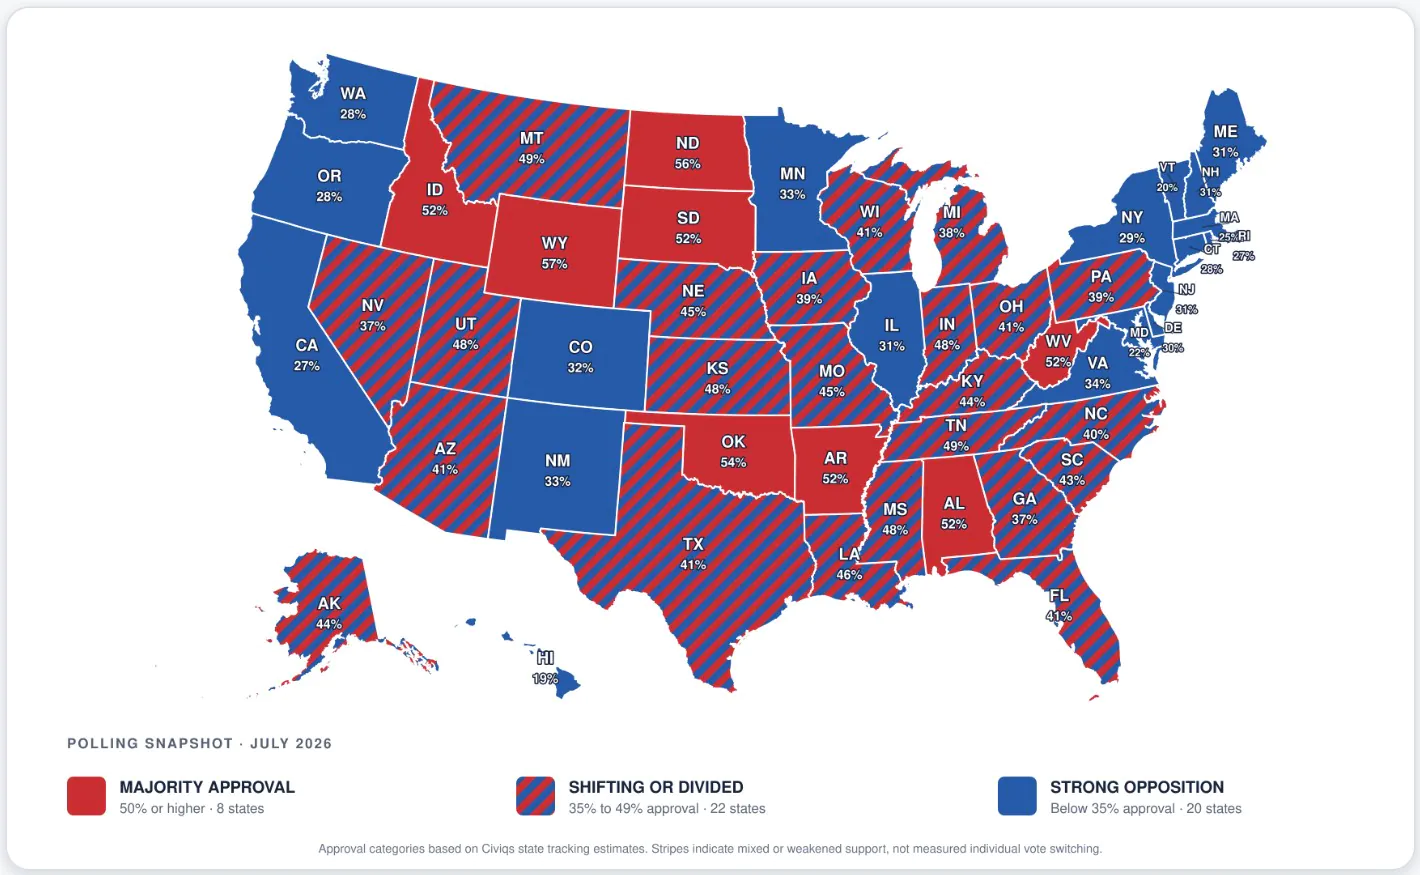
The current Donald Trump state approval map looks very different from the electoral map that returned him to the White House.
Trump won every major presidential battleground in 2024. In the latest state-level approval estimates, however, he is below 50% in Arizona, Georgia, Michigan, Nevada, North Carolina, Pennsylvania and Wisconsin. His rating also sits below a majority in large Republican states including Florida and Texas.
The current map of red and blue states does not show how people will vote in the next election. It measures whether residents approve of Trump’s performance as president at the time they were surveyed. Even with that distinction, the geographic pattern matters as Republicans prepare for congressional races that will determine control of the House and Senate.
Only eight states give Trump an approval rating above 50% in the latest Civiqs tracking data. His approval is highest in Wyoming at 57%, followed by North Dakota at 56% and Oklahoma at 54%. Hawaii gives him his lowest rating at 19%.
Nationally, the same tracker places Trump at 36% approval and 59% disapproval.
Donald Trump Approval Rating in Every State
State
Trump approval
Current position
Alabama
52%
Majority approval
Alaska
44%
Below 50%
Arizona
41%
Below 50%
Arkansas
52%
Majority approval
California
27%
Below 30%
Colorado
32%
Below 40%
Connecticut
28%
Below 30%
Delaware
30%
Below 40%
Florida
41%
Below 50%
Georgia
37%
Below 40%
Hawaii
19%
Lowest approval
Idaho
52%
Majority approval
Illinois
31%
Below 40%
Indiana
48%
Close to 50%
Iowa
39%
Below 40%
Kansas
48%
Close to 50%
Kentucky
44%
Below 50%
Louisiana
46%
Below 50%
Maine
31%
Below 40%
Maryland
22%
Below 30%
Massachusetts
25%
Below 30%
Michigan
38%
Below 40%
Minnesota
33%
Below 40%
Mississippi
48%
Close to 50%
Missouri
45%
Below 50%
Montana
49%
One point below 50%
Nebraska
45%
Below 50%
Nevada
37%
Below 40%
New Hampshire
31%
Below 40%
New Jersey
31%
Below 40%
New Mexico
33%
Below 40%
New York
29%
Below 30%
North Carolina
40%
Below 50%
North Dakota
56%
Majority approval
Ohio
41%
Below 50%
Oklahoma
54%
Majority approval
Oregon
28%
Below 30%
Pennsylvania
39%
Below 40%
Rhode Island
27%
Below 30%
South Carolina
43%
Below 50%
South Dakota
52%
Majority approval
Tennessee
49%
One point below 50%
Texas
41%
Below 50%
Utah
48%
Close to 50%
Vermont
20%
Second-lowest approval
Virginia
34%
Below 40%
Washington
28%
Below 30%
West Virginia
52%
Majority approval
Wisconsin
41%
Below 50%
Wyoming
57%
Highest approval
Source: Civiqs daily presidential approval tracking estimates reported in July 2026. Figures are rounded to whole percentages.
Only Eight States Give Trump Majority Approval
View this post on Instagram
Trump remains above 50% in Alabama, Arkansas, Idaho, North Dakota, Oklahoma, South Dakota, West Virginia and Wyoming.
All eight are reliable Republican states, but the narrow size of some majorities is notable. Alabama, Arkansas, Idaho, South Dakota and West Virginia each place him at 52%. Oklahoma is only two points higher at 54%.
Wyoming is the strongest state on the map at 57%. That is still well below Trump’s share of the vote there in 2024 and below his approval during the opening months of his second term.
Several other Republican states stop just short of majority approval. Montana and Tennessee place him at 49%. Indiana, Kansas, Mississippi and Utah put him at 48%.
A rating below 50% does not automatically mean more residents disapprove than approve. Some respondents may select neither option or remain unsure. It does show that Trump cannot currently claim majority approval in states that gave him comfortable election victories.
Every Major 2024 Battleground Has Moved Below 50%
The most useful part of the map is not the predictable contrast between Wyoming and Vermont. The seven presidential battlegrounds offer a clearer view of the political pressure facing Republicans.
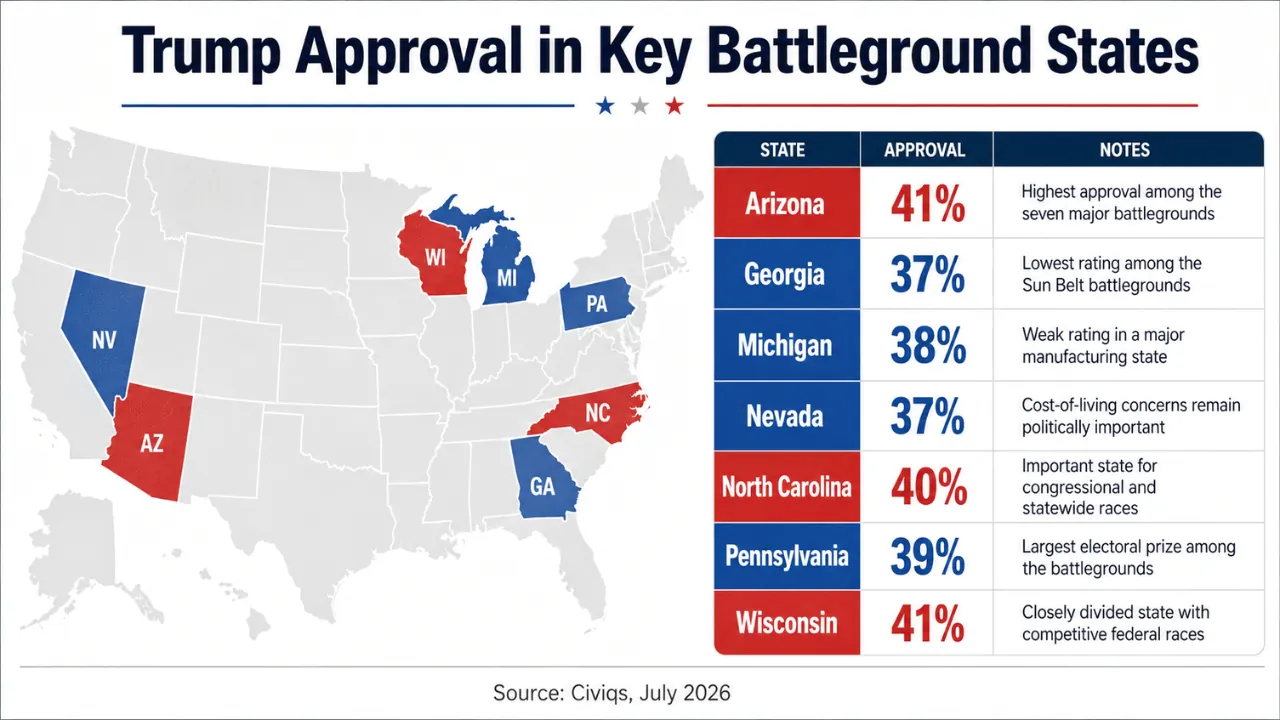
Trump won all seven in 2024. None now gives him approval above 41%.
Approval is not the same as a ballot test. A voter can disapprove of Trump and still vote for a Republican congressional candidate. Another voter may dislike both parties or decide not to participate in a midterm election.
Republican candidates still have to consider what the numbers mean for their campaigns. Running closely with Trump may energize loyal supporters, but it can also create problems with independents and occasional voters who have become dissatisfied with his performance.
The situation is particularly uncomfortable in Pennsylvania, Michigan and Wisconsin. Those states contain manufacturing communities that supported Trump’s argument for tariffs and tougher trade policy but could also feel the effects of higher input prices, interrupted supply chains or retaliation against American exports.
Florida and Texas No Longer Look Like Easy Political Territory
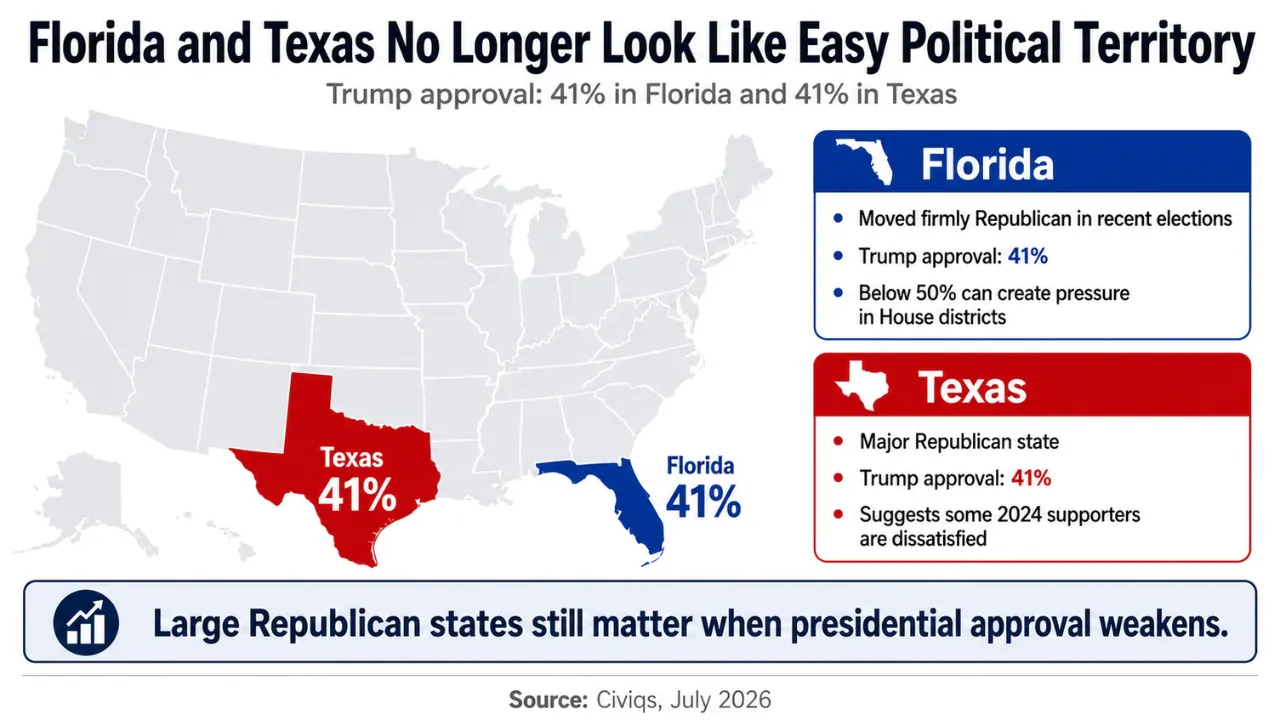
Florida and Texas stand out because both have moved firmly toward Republicans in recent elections, yet Trump’s approval is only 41% in each state.
No serious reading of the map turns Florida or Texas into an automatic Democratic win. Approval ratings describe the president, not the full partisan balance of a state. Republican registration, organization and turnout remain strong in both places.
The figures still matter because Florida and Texas are enormous.
They rank among the largest state economies in the country, as shown in our breakdown of GDP across all 50 states, and decisions made in Washington can quickly reach their employers, ports, farms, energy companies and consumers.
Texas is especially revealing. Trump won the state comfortably in 2024, but an approval rating of 41% suggests that a meaningful share of people who supported him are not satisfied with the job he is doing now.
Florida presents a similar gap. The state is no longer treated as a classic presidential toss-up, but a president polling below 50% can still create trouble for members of his party in individual House districts.
The Economy Remains Trump’s Main Polling Problem
The state map does not tell us why each respondent approves or disapproves. National polling supplies more context.
An AP-NORC survey conducted in May found 37% of adults approved of Trump’s overall performance and 62% disapproved. Only about one-third approved of his handling of the economy, Iran and foreign policy. Immigration remained his strongest issue, with 45% approval.
A July Economist/YouGov poll placed Trump at 37% approval and 59% disapproval. The results arrived after months of public concern about fuel costs, food prices, tariffs and the continuing conflict involving Iran.
State economic conditions differ considerably. The latest unemployment rates by state show relatively low joblessness in parts of the Midwest and South, but low unemployment does not necessarily mean residents feel comfortable. Rent, groceries, insurance, utilities and borrowing costs can shape public opinion even when most people remain employed.
Tariffs add another layer. Supporters argue that higher import duties protect American producers and create leverage in trade negotiations. Consumers and businesses often notice the immediate cost before any promised long-term benefit becomes visible.
A household does not experience the economy as a GDP report. It experiences the economy at the supermarket, gas station, pharmacy, rent payment and credit-card statement. Presidential approval tends to suffer when those ordinary expenses feel harder to manage.
Immigration Is Stronger for Trump but No Longer Enough
Immigration continues to perform better for Trump than the economy. His second administration has expanded enforcement, fought states and advocacy groups in court and pursued tighter rules for legal and unauthorized immigration.
Several policies remain popular with Republican voters. Broader surveys indicate that many Americans also support deporting people convicted of serious crimes and strengthening border enforcement.
Disputes arise over how enforcement is carried out, which immigrants are targeted and how much authority the executive branch should have. Court challenges have complicated policies involving H-1B workers, Temporary Protected Status, detention and deportation.
A federal judge, for example, blocked the administration’s proposed $100,000 fee for new H-1B petitions, finding that the charge operated more like an unauthorized tax than a normal processing fee.
Immigration may still be Trump’s best major issue, but the approval map suggests it is not offsetting dissatisfaction elsewhere.
The Map Is a Warning for Republicans, Not an Election Forecast
Presidential approval is one of the broad indicators used to judge the environment before a midterm election. Voters often use congressional elections to register frustration with the president, even when his name is not on the ballot.
Trump experienced that pattern in 2018, when Democrats gained 41 House seats during his first presidency.
Similar comparisons have limits. District boundaries are different, congressional candidates matter and turnout can change sharply between a presidential election and a midterm. Republicans can also outperform Trump’s personal approval if their candidates build separate identities or face unpopular Democratic opponents.
The pool of registered voters is large, but participation is never guaranteed. NCHStats’ review of voter registration across the United States found more than 200 million registered voters, with substantial differences in registration systems and rates among states.
Campaigns therefore care about intensity as much as approval. A smaller group of highly motivated Trump supporters can have more influence in a low-turnout election than a larger group of dissatisfied residents who do not vote.
How the Donald Trump State Approval Map Is Calculated
The figures come from Civiqs, which operates a large online polling panel covering all 50 states and Washington, D.C.
According to the company’s published polling methodology, respondents are sampled and the results are adjusted for demographic, geographic and political differences. Its daily tracker uses a statistical model to reduce abrupt swings caused by a small number of new responses.
The July estimates were based on more than 114,000 accumulated responses. That large number does not mean 114,000 people were interviewed in every state during one week. Civiqs continuously collects responses and uses modeling to estimate current opinion at the state and national levels.
Readers should not treat a one-point difference as proof that one state is more supportive than another. Montana at 49% and Tennessee at 49%, for example, are functionally in the same position. The broader tiers are more informative than tiny differences.
Comparisons with other polls also require care. Some pollsters survey all adults, others use registered voters, and others focus on likely voters. Question wording, field dates and weighting methods can produce different results.
Final Thoughts
@adammocklerTrump’s approval numbers just hit second-worst of all time♬ original sound – adam mockler
The most important states to monitor are not Wyoming, Vermont or Hawaii. Their underlying political identities make a dramatic shift unlikely.
Watch Arizona, Georgia, Michigan, Nevada, North Carolina, Pennsylvania and Wisconsin. Movement in those states can affect competitive House, Senate and gubernatorial races.
Florida, Texas, Iowa and Ohio also deserve attention because weak presidential approval there can force Republicans to spend time and money defending territory they expected to hold comfortably.
For now, the Donald Trump state approval map shows a president who retains a loyal regional base but lacks majority approval across most of the country. The map does not say Democrats will win the midterms, and it does not mean Trump has lost every state where his approval falls below 50%. It does show that the political coalition that elected him is less satisfied than it was on Election Day. That difference is the part both parties will be watching as voters move closer to the next national election.