United States Population (2025) per State
Take a closer look at the 2025 population data for each U.S. state with this interactive map.
Users can hover over any state to see its population number and click on the state to access a detailed article about its demographic trends and changes.
Huntsville - 228,616
Anchorage - 284,469
Little Rock - 204,244
Bridgeport - 148,131
Wilmington - 71,954
Boise City - 235,216
Des Moines - 209,232
Wichita - 395,484
Portland - 69,847
Jackson - 140,613
Kansas City - 511,532
Billings - 122,077
Omaha - 480,194
Manchester - 115,181
Newark - 305,368
Albuquerque - 558,736
Fargo - 135,588
Providence - 190,807
Charleston - 156,868
Sioux Falls - 210,734
Salt Lake City - 212,570
Burlington - 44,455
As of 2025, the live population of the United States is approximately 346,163,343, according to World Population Review.
Unlike other populous nations such as China and India, the U.S. population is projected to continue growing steadily throughout the century without any foreseeable decline but amidst that population is growing also older.
By 2067, it is expected to surpass 400 million people.
The sustained population growth in the U.S. is primarily driven by two factors: immigration, which has seen a decline since 2016, and natural increase, which is the difference between births and deaths.
On average, the U.S. population grows by about 0.9% per year, though this rate has varied over time.
In 2019, the growth rate dropped to 0.60%, the lowest in a century, due to a decrease in total births and an increase in deaths as more post-World War II baby boomers reached old age.
United States Population Growth
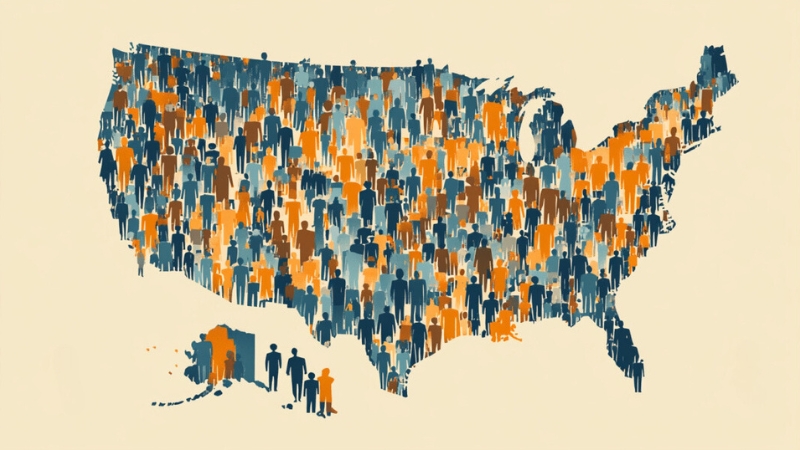
During the colonial era, formal censuses were not conducted, but historical records reveal significant population growth. Starting from just 3,800 people in 1610, the colonial population expanded to over 1 million by 1750. This rapid growth continued, and by the time of the first official census in 1790, shortly after independence, the U.S. population had reached nearly 4 million.
The United States Census, conducted every ten years, collects data on the number of people in the country along with essential demographic information, such as age, sex, and race. The most recent census occurred in 2020, following the previous census in 2010.
Data collected through the census serves multiple purposes, including:
- Congressional Representation: Ensuring each congressional seat represents a roughly equal number of people.
- Government Planning: Assisting national and state governments in planning for services such as housing, schools, and hospitals in areas experiencing rapid population growth.
- Annual Estimates: The Census Bureau releases annual population estimates based on statistical modeling, providing a current view of population changes between official censuses.
Population Projections
The U.S. population continues to grow, largely driven by high levels of immigration.
The Census Bureau estimates current annual growth rates of between 0.7% and 0.9%.
A Census Bureau Report projects that population growth will slow slightly in the coming decades.
It forecasts a population of 417 million by 2060, with the country surpassing the 400 million mark in 2051.
In contrast, the United Nations projects a slightly lower population total, estimating that the U.S. will have just over 400 million people by 2060.
United States Population Clock
| Metric | Value |
|---|---|
| United States Population (as of 11/19/2024) | 346,163,343 |
| Last UN Estimate (July 1, 2024) | 345,427,000 |
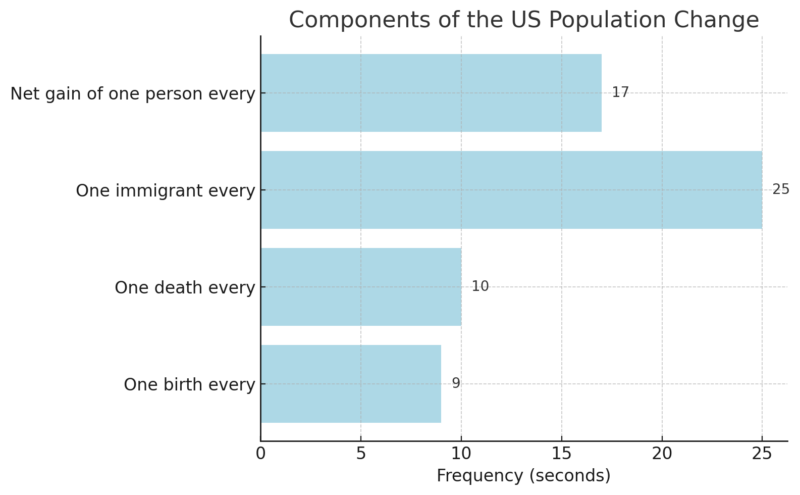
| Births per Day | 10,005 |
| Deaths per Day | 8,341 |
| Migrations per Day | 3,521 |
| Net Change per Day | 5,186 |
| Population Change Since Jan. 1 | 1,680,264 |
| Net increase of 1 person every | 17 seconds |
Components of Population Change
Population Density
The United States is the third most populous country in the world, following China and India.
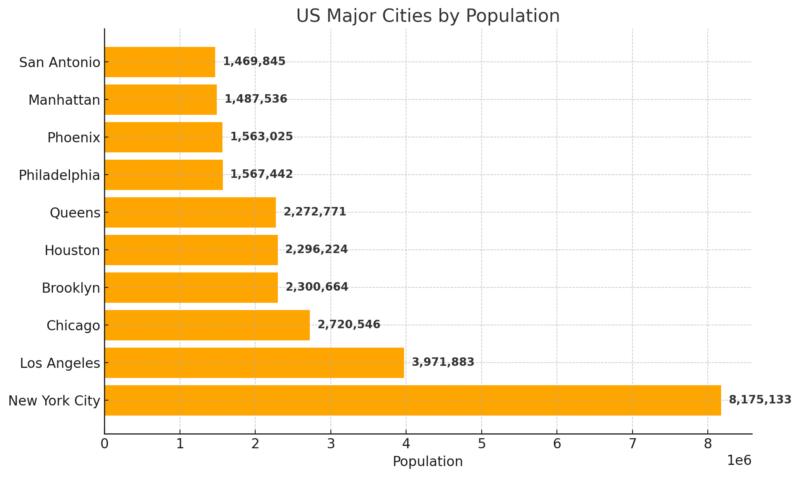
Its population is concentrated in several key states and cities, with California and Texas being the most populous states and New York City being the most populous city.
Major Cities by Population
The United States is the 3rd largest country in the world by population, following China (1.39 billion) and India (1.31 billion).
- California: Population of 39.5 million. If it were a country, California would be the 36th most populous in the world, larger than Iraq and Poland. It would also have the eighth largest economy globally, comparable to Italy.
- Texas: Population of 31 million.
- New York City: Population of 8.4 million. This makes it larger than Los Angeles (4 million) and Chicago (2.7 million) combined.
Largest Cities in the United States
New York City is the largest and most densely populated city in the U.S. with a population of 8.4 million.
By 1930, it was the largest city in the world, a title it held until 1980.
While no longer among the top 20 largest cities globally by population, it is the second-largest city worldwide by GDP at $1.55 trillion, following Tokyo, Japan.
Los Angeles is the second-largest U.S. city, with a population of approximately 4 million, about half the size of New York City.
Population Data of All U.S. States and Territories (2025)
| Rank | State/Territory | 2024 Population | 2023 Population | Growth Rate (%) | 2020 Population | Growth Since 2020 (%) | US Share (%) | Population Density (per sq mi) |
|---|---|---|---|---|---|---|---|---|
| 1 | California | 39,431,263 | 38,965,200 | -0.19 | 39,503,200 | -1.55 | 11.58 | 250 |
| 2 | Texas | 31,290,831 | 30,503,300 | 1.55 | 29,234,400 | 5.96 | 9.22 | 119 |
| 3 | Florida | 22,975,900 | 22,610,700 | 1.62 | 21,591,300 | 6.41 | 6.84 | 428 |
| 4 | New York | 19,795,791 | 19,571,200 | -0.52 | 20,104,700 | -3.16 | 5.80 | 413 |
| 5 | Pennsylvania | 12,951,300 | 12,961,700 | -0.08 | 12,995,500 | -0.34 | 3.86 | 289 |
| 6 | Illinois | 12,516,900 | 12,549,700 | -0.26 | 12,790,400 | -2.14 | 3.73 | 225 |
| 7 | Ohio | 11,812,200 | 11,785,900 | 0.22 | 11,798,300 | 0.12 | 3.52 | 289 |
| 8 | Georgia | 11,145,300 | 11,029,200 | 1.05 | 10,732,400 | 3.85 | 3.32 | 194 |
| 9 | North Carolina | 10,975,000 | 10,835,500 | 1.29 | 10,453,800 | 4.99 | 3.27 | 226 |
| 10 | Michigan | 10,041,200 | 10,037,300 | 0.04 | 10,070,600 | -0.29 | 2.99 | 178 |
| 11 | New Jersey | 9,320,860 | 9,290,840 | 0.32 | 9,272,390 | 0.52 | 2.78 | 1,267 |
| 12 | Virginia | 8,752,300 | 8,715,700 | 0.42 | 8,637,190 | 1.33 | 2.61 | 222 |
| 13 | Washington | 7,841,280 | 7,812,880 | 0.36 | 7,724,570 | 1.51 | 2.33 | 118 |
| 14 | Arizona | 7,497,000 | 7,431,340 | 0.88 | 7,186,680 | 4.32 | 2.23 | 66 |
| 15 | Tennessee | 7,204,000 | 7,126,490 | 1.09 | 6,926,090 | 4.01 | 2.14 | 175 |
| 16 | Massachusetts | 7,020,060 | 7,001,400 | 0.27 | 6,997,710 | 0.32 | 2.09 | 900 |
| 17 | Indiana | 6,892,120 | 6,862,200 | 0.44 | 6,789,100 | 1.52 | 2.05 | 192 |
| 18 | Missouri | 6,215,140 | 6,196,160 | 0.31 | 6,154,430 | 0.99 | 1.85 | 90 |
| 19 | Maryland | 6,196,520 | 6,180,250 | 0.26 | 6,173,690 | 0.37 | 1.84 | 638 |
| 20 | Wisconsin | 5,931,370 | 5,910,960 | 0.34 | 5,896,700 | 0.59 | 1.77 | 110 |
| 21 | Colorado | 5,914,180 | 5,877,610 | 0.62 | 5,785,220 | 2.23 | 1.76 | 57 |
| 22 | Minnesota | 5,761,530 | 5,737,920 | 0.41 | 5,710,580 | 0.89 | 1.72 | 72 |
| 23 | South Carolina | 5,464,160 | 5,373,560 | 1.69 | 5,132,150 | 6.47 | 1.63 | 182 |
| 24 | Alabama | 5,143,030 | 5,108,470 | 0.68 | 5,031,860 | 2.21 | 1.53 | 102 |
| 25 | Louisiana | 4,559,480 | 4,573,750 | -0.31 | 4,652,020 | -1.99 | 1.36 | 106 |
| 26 | Kentucky | 4,540,740 | 4,526,150 | 0.32 | 4,508,160 | 0.72 | 1.35 | 115 |
| 27 | Oregon | 4,227,340 | 4,233,360 | -0.14 | 4,245,040 | -0.42 | 1.26 | 44 |
| 28 | Oklahoma | 4,088,380 | 4,053,820 | 0.85 | 3,965,230 | 3.11 | 1.22 | 60 |
| 29 | Connecticut | 3,625,650 | 3,617,180 | 0.23 | 3,577,590 | 1.34 | 1.08 | 749 |
| 30 | Utah | 3,503,613 | 3,417,730 | 1.07 | 3,283,980 | 5.18 | 1.03 | 42 |
| 31 | Iowa | 3,214,320 | 3,207,000 | 0.23 | 3,190,900 | 0.73 | 0.96 | 58 |
| 32 | Nevada | 3,210,930 | 3,194,180 | 0.52 | 3,115,840 | 3.05 | 0.96 | 29 |
| 33 | Arkansas | 3,089,060 | 3,067,730 | 0.69 | 3,014,350 | 2.48 | 0.92 | 59 |
| 34 | Kansas | 2,944,380 | 2,940,550 | 0.13 | 2,938,120 | 0.21 | 0.88 | 36 |
| 35 | Mississippi | 2,940,450 | 2,939,690 | 0.03 | 2,958,410 | -0.61 | 0.88 | 63 |
| 36 | New Mexico | 2,115,270 | 2,114,370 | 0.04 | 2,118,490 | -0.15 | 0.63 | 17 |
| 37 | Idaho | 1,990,460 | 1,964,730 | 1.31 | 1,849,340 | 7.63 | 0.59 | 24 |
| 38 | Nebraska | 1,988,700 | 1,978,380 | 0.52 | 1,963,270 | 1.29 | 0.59 | 26 |
| 39 | West Virginia | 1,766,110 | 1,770,070 | -0.22 | 1,791,560 | -1.42 | 0.53 | 73 |
| 40 | Hawaii | 1,430,880 | 1,435,140 | -0.30 | 1,451,180 | -1.40 | 0.43 | 223 |
| 41 | New Hampshire | 1,405,100 | 1,402,050 | 0.22 | 1,378,700 | 1.92 | 0.42 | 157 |
| 42 | Maine | 1,402,110 | 1,395,720 | 0.46 | 1,364,520 | 2.76 | 0.42 | 45 |
| 43 | Montana | 1,142,750 | 1,132,810 | 0.88 | 1,087,210 | 5.11 | 0.34 | 8 |
| 44 | Rhode Island | 1,098,080 | 1,095,960 | 0.19 | 1,096,440 | 0.15 | 0.33 | 1,062 |
| 45 | Delaware | 1,044,320 | 1,031,890 | 1.21 | 991,862 | 5.29 | 0.31 | 536 |
| 46 | South Dakota | 928,767 | 919,318 | 1.03 | 887,852 | 4.61 | 0.28 | 12 |
| 47 | North Dakota | 788,940 | 783,926 | 0.64 | 779,563 | 1.20 | 0.23 | 11 |
| 48 | Alaska | 733,536 | 733,406 | 0.02 | 732,964 | 0.08 | 0.22 | 1 |
| 49 | Vermont | 647,818 | 647,464 | 0.06 | 642,936 | 0.76 | 0.19 | 70 |
| 50 | Wyoming | 586,485 | 584,057 | 0.42 | 577,664 | 1.53 | 0.17 | 6 |
| 51 | Puerto Rico | 3,191,270 | 3,205,690 | -0.45 | 3,281,560 | -2.75 | - | 923 |
| 52 | District of Columbia | 686,995 | 678,972 | 1.18 | 670,839 | 2.41 | - | 11,262 |
Population Pyramid 2024
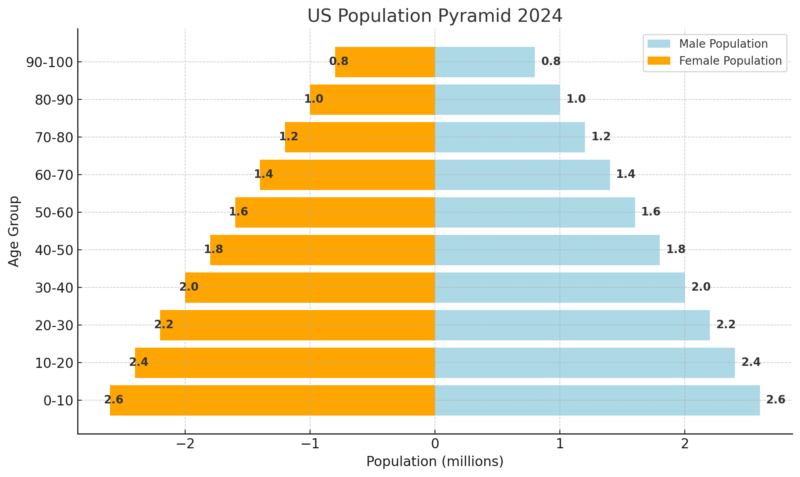
The population pyramid indicates a relatively balanced distribution between males and females across all age groups.
The largest cohorts are in the youngest age group (0-10) with both males and females at 2.6 million.
The population gradually decreases as age increases, showing fewer individuals in the older age groups.
This is typical of many developed countries with longer life expectancies but lower birth rates.
Median Age by Gender (2024)
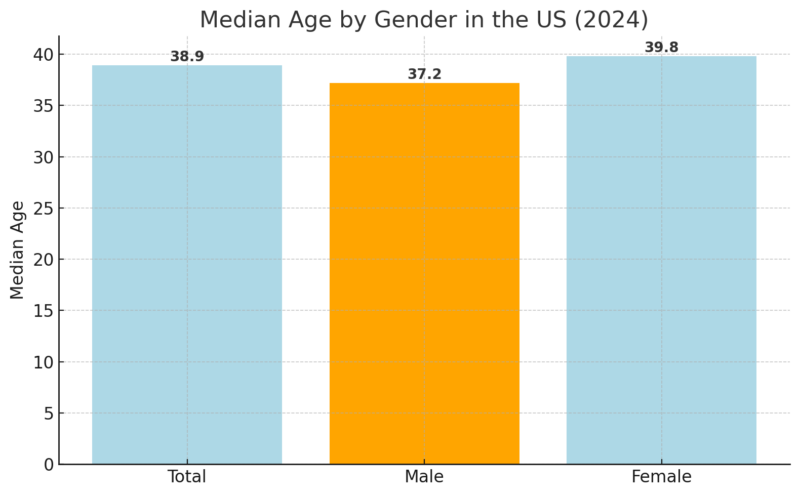
The median age of the U.S. population is 38.9 years, reflecting an aging population according to Census report.
Females have a higher median age (39.8) compared to males (37.2), which aligns with global trends where women generally have higher life expectancies.
The data underscores the importance of planning for aging-related services and infrastructure.
U.S. Demographics
| Category | 2015 Data | 2055 Projections | 2060 Projections |
|---|---|---|---|
| Racial Composition | 60.4% White | 48% White | - |
| - | 24% Hispanic | - | |
| - | 14% Asian | - | |
| - | 13% Black | - | |
| Foreign-Born Population | 14% of the population | - | 19% of the population |
| 39 million immigrants, mostly from Asia and Latin America | Significant driver of growth | ||
| - | - | - | |
| Major Foreign-Born Groups | 3.8M Chinese; 4.4M Indians | - | - |
| Age Demographics | 17% aged 65+ | - | 24% aged 65+ |
| 63% working age (18-64) | - | 52% working age (18-64) |
Currently, approximately 60.4% of the U.S. population identifies as white.
However, according to the Pew Research Center, this proportion is expected to decline significantly. By 2055, whites will no longer constitute a majority, though they will remain the largest single racial group at 48%.
Meanwhile, the Hispanic and Asian populations are set to experience substantial growth, nearly tripling in size. By 2055, Hispanics are projected to represent 24% of the population, Asians 14%, and Black Americans 13%.
Foreign-born residents are another area of significant demographic change. In 1965, just 5% of the U.S. population was foreign-born. By 2015, that figure had risen to 14%, with nearly 39 million immigrants arriving since 1965, predominantly from Asia and Latin America.
China and India rank second and third, respectively, in terms of foreign-born populations, with 3.8 million Chinese and 4.4 million Indians residing in the U.S. As immigration continues to rise, projections suggest the foreign-born population will reach 19% of the total by 2060, accounting for a large share of overall growth.
The age structure of the U.S. is also shifting. By 2060, nearly one in four people will be aged 65 or older, reflecting an aging population. At the same time, the working-age population (18-64) is expected to shrink from 63% today to 52% in 2060.
Life Expectancy in the United States
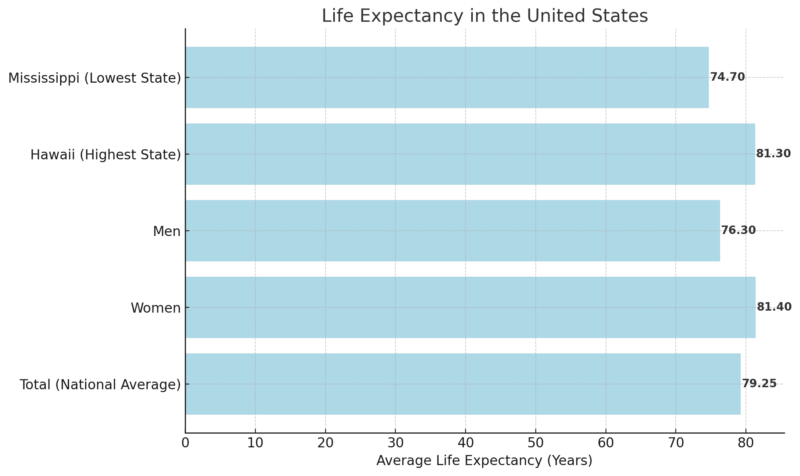
The average lifespan of individuals born in the United States is 79.25 years.
As observed worldwide, women in the U.S. tend to outlive men, with an average life expectancy of 81.4 years compared to 76.3 years for men.
Among U.S. states, Hawaii boasts the highest life expectancy at 81.3 years, while Mississippi has the lowest at 74.7 years.
Globally, the United States ranks 39th in life expectancy, based on United Nations data.
Interestingly, residents of U.S. territories like the Virgin Islands and Puerto Rico tend to live longer than those in the mainland states.
Economic Indicators: GDP Per Capita and Median Income
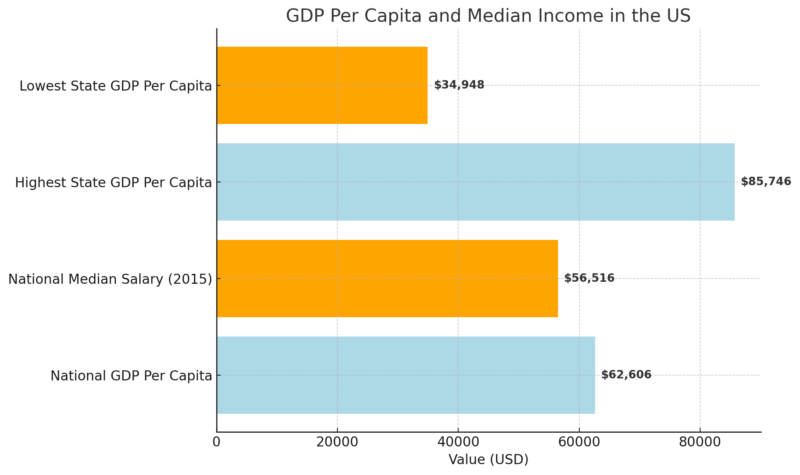
The United States has the largest economy globally but does not lead in GDP per capita, ranking 8th with $$76,399 as noted by Worldometer.
Median salaries are closely aligned, with a national figure of $56,516 recorded in 2015.
On the state level, New York boasts the highest GDP per capita at $110,980, while Mississippi ranks lowest at $39,103 as noted by Statista.
Languages in the United States
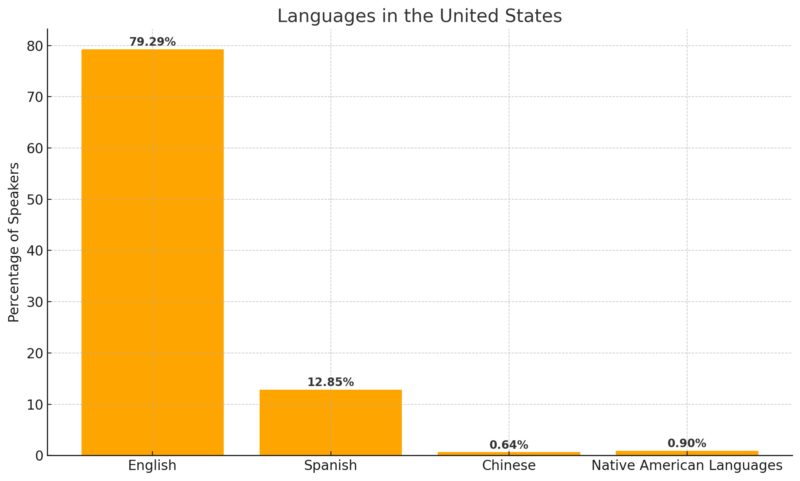
Noted by Census English is the primary language for 79.29% of people in the United States, followed by Spanish, spoken by 12.85%.
Chinese accounts for 0.64% of speakers, while Native American languages are used by 0.9% of the population.
Among Native languages, Southern Quechua has the widest reach. Although English dominates legal and administrative use, the U.S. has no federally recognized official language.
Hawaii is unique among states, recognizing both English and Hawaiian as official languages.
Religious Composition in the United States
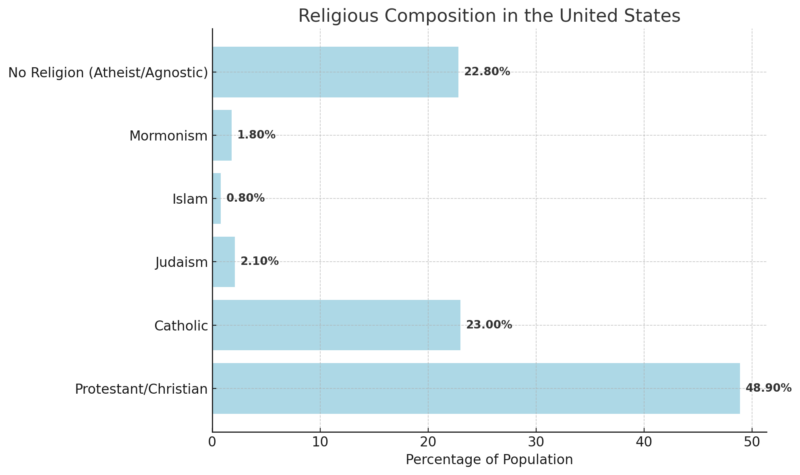
The United States is religiously diverse, with Protestant Christianity being the most prominent, accounting for 48.9% of the population.
Catholics make up 23%, while other notable faiths include Judaism (2.1%), Islam (0.8%), and Mormonism (1.8%).
Additionally, 22.8% of Americans identify as atheist, agnostic, or unaffiliated with any religion, a group largely made up of younger generations.
The nation’s foundational principle of religious freedom ensures the protection of beliefs across all faiths and non-beliefs, enshrined in the U.S. Constitution.
History of Population
1776
In 1776, the estimated population of the United States was 2.5 million. Philadelphia, the largest city, housed 40,000 residents, followed by New York City (25,000), Boston (15,000), Charleston (12,000), and Newport (11,000). The country had 3,228 religious congregations, with Congregational, Presbyterian, Baptist, Episcopal, and Quakers being the top denominations.
The 13 colonies were divided into three regions: New England, the Middle Colonies, and the Southern Colonies. Membership rates in churches were 12% in New England, 11% in the Middle Colonies, and 7% in the Southern Colonies. July 4, 1776, marked the adoption of the Declaration of Independence, formally establishing the United States.
1800
By 1800, the U.S. population had grown to 5,308,483, with 16 states included in the census. New York City was the largest urban center, with 60,515 residents, followed by Philadelphia with 41,220.
Major historical events included the presidential election between Jefferson and Burr and the establishment of the Library of Congress. The census also marked a prelude to the Louisiana Purchase in 1803.
1900
In 1900, the population reached 76,212,168. New York City was the most populated city (3,437,202), followed by Chicago (1,698,575) and Philadelphia (1,293,679). Homeownership was at 46.5%, with North Dakota achieving the highest rate at 80%. The Galveston Hurricane of 1900, which claimed between 6,000 and 12,000 lives, marked the deadliest natural disaster in U.S. history.
2000
The 2000 census recorded a population of 281,982,778. California was the most populated state with 33.8 million residents, and New York City led among cities with 8 million people.
The racial breakdown included 75.1% white, 12.3% black, 3.6% Asian, and 12.5% Hispanic. Housing units grew by 13.3% over the previous decade, and the homeownership rate rose to 66.2%.
2010
U.S. #population grew 9.7% in past decade to 308,745,538 -- slowest growth rate since Great Depression. http://on.cnn.com/gecTcT
— CNN Breaking News (@cnnbrk) December 21, 2010
By 2010, the population grew to 308.7 million, with the South and West experiencing the fastest regional growth. New York City remained the largest city with 8.17 million residents.
The racial composition was 72% white, 13% black, and 5% Asian, with Hispanic or Latino individuals making up 16.3% of the population. Homeownership slightly declined to 65.1%.
Projected 2050
The U.S. population is expected to reach 380 million by 2050. Immigrants and their descendants will contribute 82% of this growth. Racial demographics are projected to shift significantly: 47% will be non-Hispanic white, 29% Hispanic, 5% Asian, and 13% black. The aging population will rise, with 22% of Americans being 65 or older, compared to 15% in 2014.
Methodology
To craft this, we sourced credible data from reputable organizations like the United Nations, World Population Review, Statista, and the U.S. Census Bureau.
We analyzed historical records, census reports, and population projections to provide accurate and concise information.
Relevant statistics were organized into tables and charts for clarity and readability.
Projections and trends were supported by links to authoritative research and publications.
References
- World Population Review – United States Population 2024
- Statista – Life Expectancy in the United States
- Population United Nations – World Population Prospects 2024 Summary of Results
- Worldometer – GDP Per Capita by Country
- Statista – Mississippi GDP Per Capita
- United States Census Bureau – Population Estimates and Characteristics 2023
- United States Census Bureau – ACS 50 Years of Surveys
- Pew Research Center – Population Tables: 1965-2065

